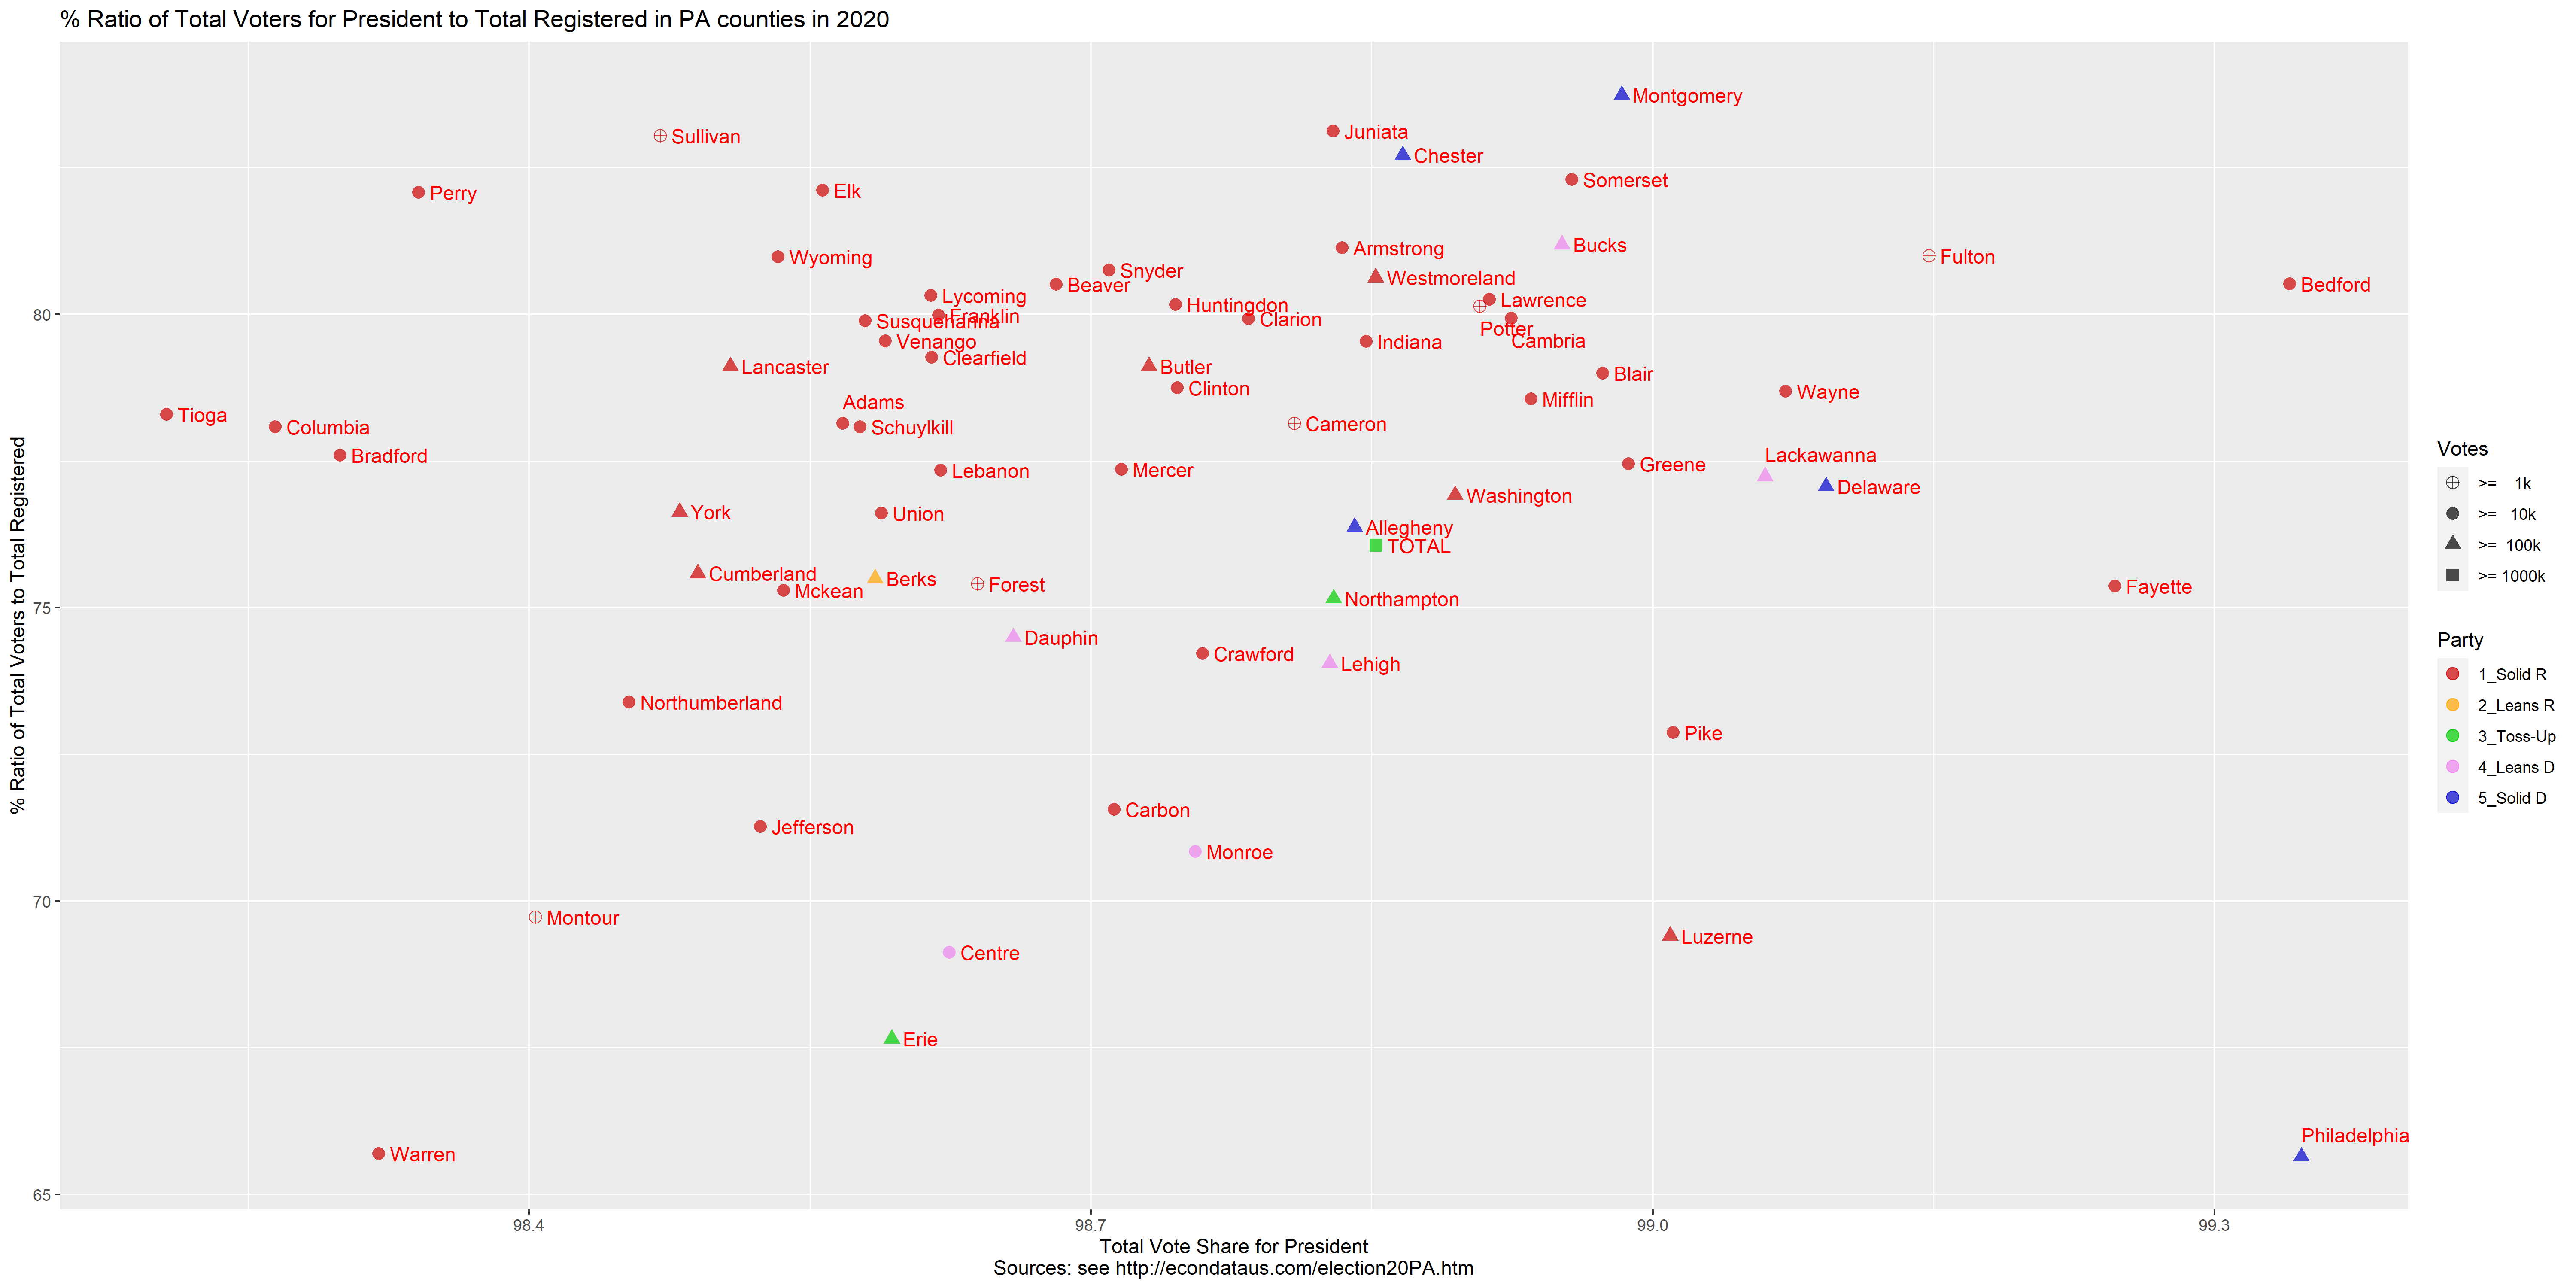
Percent ratio of Voters for President to Registered Voters in PA counties in 2020 (Count)

           COUNTY     BIDEN     TRUMP MARGIN1    TOTAL1   Democratic   Republican    MARGIN2    TOTAL2 DEM_SH REP_SH   MAR_SH TOT_SH
1           Adams    18,207    37,523 -19,316    56,540    22,714.22    46,181.78 -23,467.55    72,357  80.16  81.25    82.31  78.14
2       Allegheny   429,065   282,324 146,741   719,733   600,158.68   297,897.32 302,261.35   942,356  71.49  94.77    48.55  76.38
3       Armstrong     8,457    27,489 -19,032    36,370    14,774.42    28,101.58 -13,327.16    44,827  57.24  97.82   142.81  81.13
4          Beaver    38,122    54,759 -16,637    94,122    59,316.84    51,639.16   7,677.67   116,903  64.27 106.04  -216.69  80.51
5         Bedford     4,367    23,025 -18,658    27,574     7,764.49    25,354.51 -17,590.03    34,244  56.24  90.81   106.07  80.52
6           Berks    92,895   109,736 -16,841   205,540   134,397.87   125,346.13   9,051.74   272,251  69.12  87.55  -186.05  75.50
7           Blair    17,636    45,306 -27,670    63,595    24,122.30    53,050.70 -28,928.39    80,500  73.11  85.40    95.65  79.00
8        Bradford     8,046    21,600 -13,554    30,159    10,352.92    26,504.08 -16,151.16    38,863  77.72  81.50    83.92  77.60
9           Bucks   204,712   187,367  17,345   396,234   237,162.21   225,492.79  11,669.43   488,037  86.32  83.09   148.64  81.19
10         Butler    37,508    74,359 -36,851   113,305    48,066.50    87,741.50 -39,674.99   143,211  78.03  84.75    92.88  79.12
11        Cambria    21,730    48,085 -26,355    70,574    41,502.11    44,306.89  -2,804.78    88,290  52.36 108.53   939.64  79.93
12        Cameron       634     1,771  -1,137     2,434     1,011.26     1,933.74    -922.48     3,115  62.69  91.58   123.25  78.14
13         Carbon    11,212    21,984 -10,772    33,629    19,956.93    24,438.07  -4,481.13    46,994  56.18  89.96   240.39  71.56
14         Centre    40,055    36,372   3,683    77,493    54,901.90    52,220.10   2,681.80   112,098  72.96  69.65   137.33  69.13
15        Chester   182,372   128,565  53,807   314,502   179,141.70   176,915.30   2,226.40   380,237 101.80  72.67 2,416.77  82.71
16        Clarion     4,678    14,578  -9,900    19,493     7,440.00    16,114.00  -8,674.01    24,389  62.88  90.47   114.13  79.93
17     Clearfield     9,673    29,203 -19,530    39,422    16,682.27    30,789.73 -14,107.47    49,734  57.98  94.85   138.44  79.27
18        Clinton     5,502    11,902  -6,400    17,625     8,369.66    13,102.34  -4,732.68    22,382  65.74  90.84   135.23  78.75
19       Columbia    10,532    20,098  -9,566    31,171    15,428.68    22,710.32  -7,281.63    39,920  68.26  88.50   131.37  78.08
20       Crawford    12,924    28,559 -15,635    42,004    20,123.08    34,009.92 -13,886.84    56,595  64.22  83.97   112.59  74.22
21     Cumberland    62,245    77,212 -14,967   141,595    72,916.43   105,420.57 -32,504.15   187,334  85.36  73.24    46.05  75.58
22        Dauphin    78,983    66,408  12,575   147,368   101,425.84    87,272.16  14,153.67   197,814  77.87  76.09    88.85  74.50
23       Delaware   206,423   118,532  87,891   327,931   228,226.55   176,367.45  51,859.11   425,517  90.45  67.21   169.48  77.07
24            Elk     4,522    12,140  -7,618    16,906     8,197.77    11,454.23  -3,256.47    20,589  55.16 105.99   233.93  82.11
25           Erie    68,286    66,869   1,417   137,083   109,855.36    82,825.64  27,029.72   202,625  62.16  80.73     5.24  67.65
26        Fayette    20,444    41,227 -20,783    62,139    42,811.58    37,098.42   5,713.15    82,447  47.75 111.13  -363.77  75.37
27         Forest       728     1,882  -1,154     2,646     1,236.02     2,113.98    -877.97     3,509  58.90  89.03   131.44  75.41
28       Franklin    22,422    57,245 -34,823    80,783    28,196.07    69,148.93 -40,952.86   101,000  79.52  82.79    85.03  79.98
29         Fulton     1,085     6,824  -5,739     7,977     2,162.00     7,334.00  -5,172.01     9,849  50.19  93.05   110.96  80.99
30         Greene     4,911    12,579  -7,668    17,669    10,869.90    11,182.10    -312.19    22,812  45.18 112.49 2,456.17  77.45
31     Huntingdon     5,445    17,061 -11,616    22,792     8,106.10    19,559.90 -11,453.80    28,431  67.17  87.22   101.42  80.17
32        Indiana    12,634    28,089 -15,455    41,198    19,734.51    29,857.49 -10,122.99    51,797  64.02  94.08   152.67  79.54
33      Jefferson     4,527    17,960 -13,433    22,824     8,994.91    21,518.09 -12,523.17    32,025  50.33  83.46   107.27  71.27
34        Juniata     2,253     9,649  -7,396    12,043     3,649.58    10,444.42  -6,794.84    14,488  61.73  92.38   108.85  83.12
35     Lackawanna    61,991    52,334   9,657   115,410    94,289.12    51,615.88  42,673.25   149,419  65.75 101.39    22.63  77.24
36      Lancaster   115,847   160,209 -44,362   280,239   129,786.38   204,098.62 -74,312.24   354,206  89.26  78.50    59.70  79.12
37       Lawrence    15,978    29,597 -13,619    46,076    26,257.50    28,847.50  -2,589.99    57,413  60.85 102.60   525.83  80.25
38        Lebanon    23,932    46,731 -22,799    71,652    31,103.22    57,307.78 -26,204.56    92,640  76.94  81.54    87.00  77.34
39         Lehigh    98,288    84,259  14,029   184,713   140,422.35   100,681.65  39,740.71   249,438  69.99  83.69    35.30  74.05
40        Luzerne    64,873    86,929 -22,056   153,321   117,917.70    95,756.30  22,161.40   220,897  55.02  90.78   -99.52  69.41
41       Lycoming    16,971    41,462 -24,491    59,254    23,149.86    47,252.14 -24,102.27    73,768  73.31  87.75   101.61  80.32
42         Mckean     5,098    14,083  -8,985    19,466     7,177.59    17,400.41 -10,222.83    25,852  71.03  80.93    87.89  75.30
43         Mercer    21,067    36,143 -15,076    57,954    32,695.25    39,874.75  -7,179.51    74,917  64.43  90.64   209.99  77.36
44        Mifflin     4,603    16,670 -12,067    21,502     7,263.63    19,346.37 -12,082.74    27,370  63.37  86.17    99.87  78.56
45         Monroe    44,060    38,726   5,334    83,829    63,845.09    47,315.91  16,529.19   118,330  69.01  81.85    32.27  70.84
46     Montgomery   319,511   185,460 134,051   510,157   337,123.34   236,658.66 100,464.68   609,211  94.78  78.37   133.43  83.74
47        Montour     3,771     5,844  -2,073     9,771     5,508.34     7,916.66  -2,408.32    14,013  68.46  73.82    86.08  69.73
48    Northampton    85,087    83,854   1,233   170,942   119,734.71    95,107.29  24,627.41   227,440  71.06  88.17     5.01  75.16
49 Northumberland    12,677    28,952 -16,275    42,283    21,098.84    33,547.16 -12,448.33    57,611  60.08  86.30   130.74  73.39
50          Perry     5,950    18,293 -12,343    24,652     7,283.53    21,744.47 -14,460.95    30,035  81.69  84.13    85.35  82.08
51   Philadelphia   603,790   132,740 471,050   741,377   948,490.22   144,531.78 803,958.44 1,129,338  63.66  91.84    58.59  65.65
52           Pike    13,019    19,213  -6,194    32,554    17,557.88    24,067.12  -6,509.23    44,670  74.15  79.83    95.16  72.88
53         Potter     1,726     7,239  -5,513     9,064     2,513.50     8,456.50  -5,942.99    11,310  68.67  85.60    92.76  80.14
54     Schuylkill    20,727    48,871 -28,144    70,603    32,826.30    53,123.70 -20,297.40    90,424  63.14  91.99   138.66  78.08
55         Snyder     4,910    13,983  -9,073    19,140     5,923.56    16,941.44 -11,017.88    23,702  82.89  82.54    82.35  80.75
56       Somerset     8,654    31,466 -22,812    40,543    14,822.17    32,961.83 -18,139.65    49,262  58.39  95.46   125.76  82.30
57       Sullivan       921     2,619  -1,698     3,595     1,379.87     2,780.13  -1,400.27     4,329  66.75  94.20   121.26  83.04
58    Susquehanna     6,236    15,207  -8,971    21,752     7,954.48    17,908.52  -9,954.04    27,228  78.40  84.91    90.12  79.89
59          Tioga     4,955    15,742 -10,787    21,075     6,693.23    19,279.77 -12,586.55    26,918  74.03  81.65    85.70  78.29
60          Union     7,475    12,356  -4,881    20,115     9,016.08    16,024.92  -7,008.83    26,256  82.91  77.10    69.64  76.61
61        Venango     7,585    18,569 -10,984    26,528    10,685.96    21,205.04 -10,519.09    33,350  70.98  87.57   104.42  79.54
62         Warren     6,066    14,237  -8,171    20,650    10,644.31    18,395.69  -7,751.39    31,433  56.99  77.39   105.41  65.70
63     Washington    45,088    72,080 -26,992   118,478    74,104.51    75,405.49  -1,300.97   154,023  60.84  95.59 2,074.76  76.92
64          Wayne     9,191    18,637  -9,446    28,089    11,430.51    22,982.49 -11,551.98    35,694  80.41  81.09    81.77  78.69
65   Westmoreland    72,129   130,218 -58,089   204,697   112,321.06   130,038.94 -17,717.87   253,882  64.22 100.14   327.86  80.63
66        Wyoming     4,704     9,936  -5,232    14,858     5,786.58    11,737.42  -5,950.83    18,348  81.29  84.65    87.92  80.98
67           York    88,114   146,733 -58,619   238,471   117,120.21   184,454.79 -67,334.58   311,195  75.23  79.55    87.06  76.63
68          TOTAL 3,458,229 3,377,674  80,555 6,915,283 4,723,697.54 3,960,214.46 763,483.08 9,091,462  73.21  85.29    10.55  76.06

Source: Pennsylvania Department of State Reporting Center, (select "2020 Presidential Election" for Election,
        County for Report Type, CSV for Export Type, "Select All" for everything else and click "Generate");
        Voting & Election Statistics, Voter registration statistics by county, November 16, 2020
Percent ratio of Voters for President to Registered Voters in PA counties in 2020 (Percent)

           COUNTY BIDEN TRUMP MARGIN1 TOTAL1 Democratic Republican MARGIN2 TOTAL2 DEM_SH REP_SH   MAR_SH TOT_SH
1           Adams 32.20 66.37  -34.16  98.57      31.39      63.82  -32.43  95.22  80.16  81.25    82.31  78.14
2       Allegheny 59.61 39.23   20.39  98.84      63.69      31.61   32.08  95.30  71.49  94.77    48.55  76.38
3       Armstrong 23.25 75.58  -52.33  98.83      32.96      62.69  -29.73  95.65  57.24  97.82   142.81  81.13
4          Beaver 40.50 58.18  -17.68  98.68      50.74      44.17    6.57  94.91  64.27 106.04  -216.69  80.51
5         Bedford 15.84 83.50  -67.67  99.34      22.67      74.04  -51.37  96.71  56.24  90.81   106.07  80.52
6           Berks 45.20 53.39   -8.19  98.58      49.37      46.04    3.32  95.41  69.12  87.55  -186.05  75.50
7           Blair 27.73 71.24  -43.51  98.97      29.97      65.90  -35.94  95.87  73.11  85.40    95.65  79.00
8        Bradford 26.68 71.62  -44.94  98.30      26.64      68.20  -41.56  94.84  77.72  81.50    83.92  77.60
9           Bucks 51.66 47.29    4.38  98.95      48.60      46.20    2.39  94.80  86.32  83.09   148.64  81.19
10         Butler 33.10 65.63  -32.52  98.73      33.56      61.27  -27.70  94.83  78.03  84.75    92.88  79.12
11        Cambria 30.79 68.13  -37.34  98.92      47.01      50.18   -3.18  97.19  52.36 108.53   939.64  79.93
12        Cameron 26.05 72.76  -46.71  98.81      32.46      62.08  -29.61  94.54  62.69  91.58   123.25  78.14
13         Carbon 33.34 65.37  -32.03  98.71      42.47      52.00   -9.54  94.47  56.18  89.96   240.39  71.56
14         Centre 51.69 46.94    4.75  98.62      48.98      46.58    2.39  95.56  72.96  69.65   137.33  69.13
15        Chester 57.99 40.88   17.11  98.87      47.11      46.53    0.59  93.64 101.80  72.67 2,416.77  82.71
16        Clarion 24.00 74.79  -50.79  98.78      30.51      66.07  -35.57  96.58  62.88  90.47   114.13  79.93
17     Clearfield 24.54 74.08  -49.54  98.61      33.54      61.91  -28.37  95.45  57.98  94.85   138.44  79.27
18        Clinton 31.22 67.53  -36.31  98.75      37.39      58.54  -21.15  95.93  65.74  90.84   135.23  78.75
19       Columbia 33.79 64.48  -30.69  98.26      38.65      56.89  -18.24  95.54  68.26  88.50   131.37  78.08
20       Crawford 30.77 67.99  -37.22  98.76      35.56      60.09  -24.54  95.65  64.22  83.97   112.59  74.22
21     Cumberland 43.96 54.53  -10.57  98.49      38.92      56.27  -17.35  95.20  85.36  73.24    46.05  75.58
22        Dauphin 53.60 45.06    8.53  98.66      51.27      44.12    7.16  95.39  77.87  76.09    88.85  74.50
23       Delaware 62.95 36.15   26.80  99.09      53.64      41.45   12.19  95.08  90.45  67.21   169.48  77.07
24            Elk 26.75 71.81  -45.06  98.56      39.82      55.63  -15.82  95.45  55.16 105.99   233.93  82.11
25           Erie 49.81 48.78    1.03  98.59      54.22      40.88   13.34  95.09  62.16  80.73     5.24  67.65
26        Fayette 32.90 66.35  -33.45  99.25      51.93      45.00    6.93  96.92  47.75 111.13  -363.77  75.37
27         Forest 27.51 71.13  -43.61  98.64      35.22      60.24  -25.02  95.47  58.90  89.03   131.44  75.41
28       Franklin 27.76 70.86  -43.11  98.62      27.92      68.46  -40.55  96.38  79.52  82.79    85.03  79.98
29         Fulton 13.60 85.55  -71.94  99.15      21.95      74.46  -52.51  96.42  50.19  93.05   110.96  80.99
30         Greene 27.79 71.19  -43.40  98.99      47.65      49.02   -1.37  96.67  45.18 112.49 2,456.17  77.45
31     Huntingdon 23.89 74.86  -50.97  98.75      28.51      68.80  -40.29  97.31  67.17  87.22   101.42  80.17
32        Indiana 30.67 68.18  -37.51  98.85      38.10      57.64  -19.54  95.74  64.02  94.08   152.67  79.54
33      Jefferson 19.83 78.69  -58.85  98.52      28.09      67.19  -39.10  95.28  50.33  83.46   107.27  71.27
34        Juniata 18.71 80.12  -61.41  98.83      25.19      72.09  -46.90  97.28  61.73  92.38   108.85  83.12
35     Lackawanna 53.71 45.35    8.37  99.06      63.10      34.54   28.56  97.65  65.75 101.39    22.63  77.24
36      Lancaster 41.34 57.17  -15.83  98.51      36.64      57.62  -20.98  94.26  89.26  78.50    59.70  79.12
37       Lawrence 34.68 64.24  -29.56  98.91      45.73      50.25   -4.51  95.98  60.85 102.60   525.83  80.25
38        Lebanon 33.40 65.22  -31.82  98.62      33.57      61.86  -28.29  95.44  76.94  81.54    87.00  77.34
39         Lehigh 53.21 45.62    7.60  98.83      56.30      40.36   15.93  96.66  69.99  83.69    35.30  74.05
40        Luzerne 42.31 56.70  -14.39  99.01      53.38      43.35   10.03  96.73  55.02  90.78   -99.52  69.41
41       Lycoming 28.64 69.97  -41.33  98.61      31.38      64.06  -32.67  95.44  73.31  87.75   101.61  80.32
42         Mckean 26.19 72.35  -46.16  98.54      27.76      67.31  -39.54  95.07  71.03  80.93    87.89  75.30
43         Mercer 36.35 62.36  -26.01  98.72      43.64      53.23   -9.58  96.87  64.43  90.64   209.99  77.36
44        Mifflin 21.41 77.53  -56.12  98.93      26.54      70.68  -44.15  97.22  63.37  86.17    99.87  78.56
45         Monroe 52.56 46.20    6.36  98.76      53.96      39.99   13.97  93.94  69.01  81.85    32.27  70.84
46     Montgomery 62.63 36.35   26.28  98.98      55.34      38.85   16.49  94.18  94.78  78.37   133.43  83.74
47        Montour 38.59 59.81  -21.22  98.40      39.31      56.50  -17.19  95.80  68.46  73.82    86.08  69.73
48    Northampton 49.78 49.05    0.72  98.83      52.64      41.82   10.83  94.46  71.06  88.17     5.01  75.16
49 Northumberland 29.98 68.47  -38.49  98.45      36.62      58.23  -21.61  94.85  60.08  86.30   130.74  73.39
50          Perry 24.14 74.20  -50.07  98.34      24.25      72.40  -48.15  96.65  81.69  84.13    85.35  82.08
51   Philadelphia 81.44 17.90   63.54  99.35      83.99      12.80   71.19  96.78  63.66  91.84    58.59  65.65
52           Pike 39.99 59.02  -19.03  99.01      39.31      53.88  -14.57  93.18  74.15  79.83    95.16  72.88
53         Potter 19.04 79.87  -60.82  98.91      22.22      74.77  -52.55  96.99  68.67  85.60    92.76  80.14
54     Schuylkill 29.36 69.22  -39.86  98.58      36.30      58.75  -22.45  95.05  63.14  91.99   138.66  78.08
55         Snyder 25.65 73.06  -47.40  98.71      24.99      71.48  -46.49  96.47  82.89  82.54    82.35  80.75
56       Somerset 21.35 77.61  -56.27  98.96      30.09      66.91  -36.82  97.00  58.39  95.46   125.76  82.30
57       Sullivan 25.62 72.85  -47.23  98.47      31.87      64.22  -32.35  96.10  66.75  94.20   121.26  83.04
58    Susquehanna 28.67 69.91  -41.24  98.58      29.21      65.77  -36.56  94.99  78.40  84.91    90.12  79.89
59          Tioga 23.51 74.70  -51.18  98.21      24.87      71.62  -46.76  96.49  74.03  81.65    85.70  78.29
60          Union 37.16 61.43  -24.27  98.59      34.34      61.03  -26.69  95.37  82.91  77.10    69.64  76.61
61        Venango 28.59 70.00  -41.41  98.59      32.04      63.58  -31.54  95.63  70.98  87.57   104.42  79.54
62         Warren 29.38 68.94  -39.57  98.32      33.86      58.52  -24.66  92.39  56.99  77.39   105.41  65.70
63     Washington 38.06 60.84  -22.78  98.89      48.11      48.96   -0.84  97.07  60.84  95.59 2,074.76  76.92
64          Wayne 32.72 66.35  -33.63  99.07      32.02      64.39  -32.36  96.41  80.41  81.09    81.77  78.69
65   Westmoreland 35.24 63.62  -28.38  98.85      44.24      51.22   -6.98  95.46  64.22 100.14   327.86  80.63
66        Wyoming 31.66 66.87  -35.21  98.53      31.54      63.97  -32.43  95.51  81.29  84.65    87.92  80.98
67           York 36.95 61.53  -24.58  98.48      37.64      59.27  -21.64  96.91  75.23  79.55    87.06  76.63
68          TOTAL 50.01 48.84    1.16  98.85      51.96      43.56    8.40  95.52  73.21  85.29    10.55  76.06

Source: Pennsylvania Department of State Reporting Center, (select "2020 Presidential Election" for Election,
        County for Report Type, CSV for Export Type, "Select All" for everything else and click "Generate");
        Voting & Election Statistics, Voter registration statistics by county, November 16, 2020
Note: The above plot and tables contradict the following statement from page 9 of Volume 3 of the Navarro Report, titled "Yes, President Trump Won: The Case, Evidence, & Statistical Receipts":
State Representative Frank Ryan, along with several other members of the State Legislature, found that over 202,000 more ballots were cast than actual registered voters in the state.
The source for this claim is this statement by Representative Russ Diamond. The claim has been debunked by The Associated Press, The Washington Post, and Snopes. However, the claim still exists here, linked to from Representative Frank Ryan's website and here, linked to from Representative Russ Diamond's website.