Shift in Votes from President to Senate Race in AZ counties in 2020 (Count)

       COUNTY     Biden     Trump MARGIN1    TOTAL1     Kelly   McSally MARGIN2    TOTAL2 DEM_SH  REP_SH MAR_SH  TOT_SH
1      Apache    23,293    11,442  11,851    35,172    24,050    11,052  12,998    35,102    757    -390  1,147     -70
2     Cochise    23,732    35,557 -11,825    60,442    24,843    35,214 -10,371    60,057  1,111    -343  1,454    -385
3    Coconino    44,698    27,052  17,646    73,272    45,561    27,255  18,306    72,816    863     203    660    -456
4        Gila     8,943    18,377  -9,434    27,662     9,648    17,889  -8,241    27,537    705    -488  1,193    -125
5      Graham     4,034    10,749  -6,715    14,995     4,506    10,303  -5,797    14,809    472    -446    918    -186
6    Greenlee     1,182     2,433  -1,251     3,685     1,403     2,225    -822     3,628    221    -208    429     -57
7      La Paz     2,236     5,129  -2,893     7,458     2,492     4,835  -2,343     7,327    256    -294    550    -131
8    Maricopa 1,040,774   995,665  45,109 2,068,144 1,064,396   984,203  80,193 2,048,599 23,622 -11,462 35,084 -19,545
9      Mohave    24,831    78,535 -53,704   104,668    27,414    75,359 -47,945   102,773  2,583  -3,176  5,759  -1,895
10     Navajo    23,383    27,657  -4,274    51,767    24,396    26,952  -2,556    51,348  1,013    -705  1,718    -419
11       Pima   304,981   207,758  97,223   520,397   309,142   207,317 101,825   516,459  4,161    -441  4,602  -3,938
12      Pinal    75,106   107,077 -31,971   184,974    79,114   104,048 -24,934   183,162  4,008  -3,029  7,037  -1,812
13 Santa Cruz    13,138     6,194   6,944    19,556    13,689     5,685   8,004    19,374    551    -509  1,060    -182
14    Yavapai    49,602    91,527 -41,925   143,221    51,852    90,180 -38,328   142,032  2,250  -1,347  3,597  -1,189
15       Yuma    32,210    36,534  -4,324    69,881    33,961    35,144  -1,183    69,105  1,751  -1,390  3,141    -776
16      TOTAL 1,672,143 1,661,686  10,457 3,385,294 1,716,467 1,637,661  78,806 3,354,128 44,324 -24,025 68,349 -31,166

Source: State of Arizona - 2020 General Election, (select "View More" in upper right of race, then select "By County");
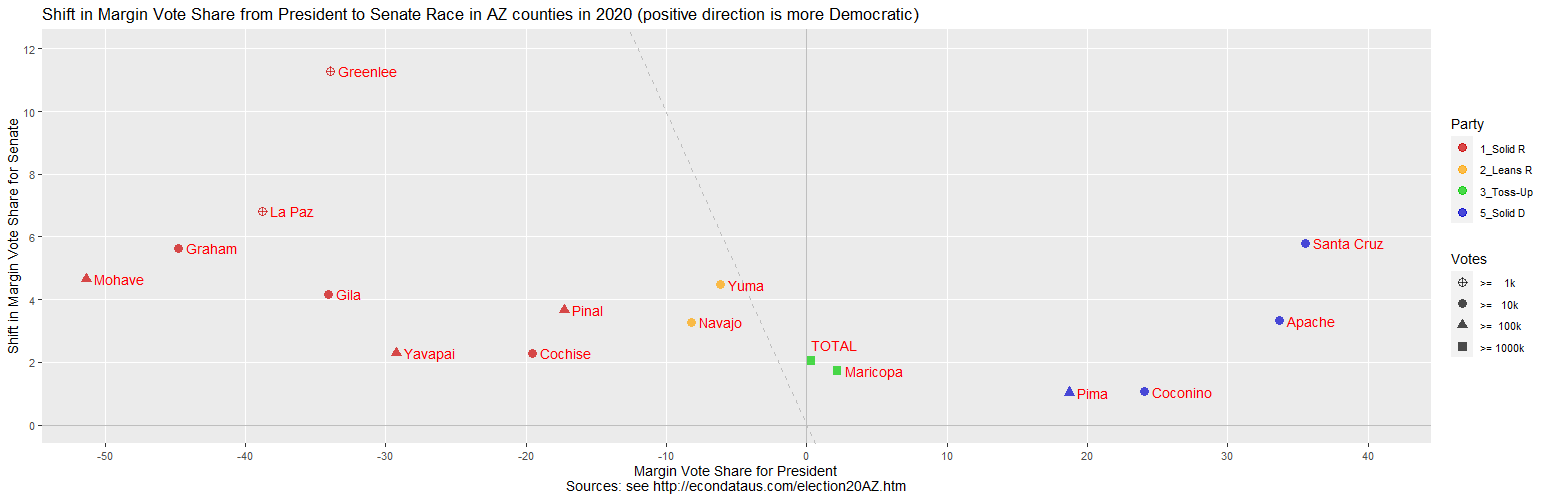
Shift in Vote Share from President to Senate Race in AZ counties in 2020 (Percent)

       COUNTY Biden Trump MARGIN1 TOTAL1 Kelly McSally MARGIN2 TOTAL2 DEM_SH REP_SH MAR_SH TOT_SH
1      Apache 66.23 32.53   33.69  98.76 68.51   31.49   37.03    100   2.29  -1.05   3.33   1.24
2     Cochise 39.26 58.83  -19.56  98.09 41.37   58.63  -17.27    100   2.10  -0.19   2.30   1.91
3    Coconino 61.00 36.92   24.08  97.92 62.57   37.43   25.14    100   1.57   0.51   1.06   2.08
4        Gila 32.33 66.43  -34.10  98.76 35.04   64.96  -29.93    100   2.71  -1.47   4.18   1.24
5      Graham 26.90 71.68  -44.78  98.59 30.43   69.57  -39.15    100   3.53  -2.11   5.64   1.41
6    Greenlee 32.08 66.02  -33.95  98.10 38.67   61.33  -22.66    100   6.60  -4.70  11.29   1.90
7      La Paz 29.98 68.77  -38.79  98.75 34.01   65.99  -31.98    100   4.03  -2.78   6.81   1.25
8    Maricopa 50.32 48.14    2.18  98.47 51.96   48.04    3.91    100   1.63  -0.10   1.73   1.53
9      Mohave 23.72 75.03  -51.31  98.76 26.67   73.33  -46.65    100   2.95  -1.71   4.66   1.24
10     Navajo 45.17 53.43   -8.26  98.60 47.51   52.49   -4.98    100   2.34  -0.94   3.28   1.40
11       Pima 58.61 39.92   18.68  98.53 59.86   40.14   19.72    100   1.25   0.22   1.03   1.47
12      Pinal 40.60 57.89  -17.28  98.49 43.19   56.81  -13.61    100   2.59  -1.08   3.67   1.51
13 Santa Cruz 67.18 31.67   35.51  98.85 70.66   29.34   41.31    100   3.48  -2.33   5.80   1.15
14    Yavapai 34.63 63.91  -29.27  98.54 36.51   63.49  -26.99    100   1.87  -0.41   2.29   1.46
15       Yuma 46.09 52.28   -6.19  98.37 49.14   50.86   -1.71    100   3.05  -1.42   4.48   1.63
16      TOTAL 49.39 49.09    0.31  98.48 51.17   48.83    2.35    100   1.78  -0.26   2.04   1.52

Source: State of Arizona - 2020 General Election, (select "View More" in upper right of race, then select "By County");
Percent ratio of Voters for President to Registered Voters in AZ counties in 2020 (Count)

       COUNTY     Biden     Trump MARGIN1    TOTAL1    TOTAL2 TOT_SH
1      Apache    23,293    11,442  11,851    35,172    51,906  67.76
2     Cochise    23,732    35,557 -11,825    60,442    82,022  73.69
3    Coconino    44,698    27,052  17,646    73,272    90,669  80.81
4        Gila     8,943    18,377  -9,434    27,662    34,001  81.36
5      Graham     4,034    10,749  -6,715    14,995    19,851  75.54
6    Greenlee     1,182     2,433  -1,251     3,685     4,866  75.73
7      La Paz     2,236     5,129  -2,893     7,458    10,909  68.37
8    Maricopa 1,040,774   995,665  45,109 2,068,144 2,595,272  79.69
9      Mohave    24,831    78,535 -53,704   104,668   135,180  77.43
10     Navajo    23,383    27,657  -4,274    51,767    70,650  73.27
11       Pima   304,981   207,758  97,223   520,397   638,355  81.52
12      Pinal    75,106   107,077 -31,971   184,974   248,874  74.32
13 Santa Cruz    13,138     6,194   6,944    19,556    29,963  65.27
14    Yavapai    49,602    91,527 -41,925   143,221   165,361  86.61
15       Yuma    32,210    36,534  -4,324    69,881   103,273  67.67
16      TOTAL 1,672,143 1,661,686  10,457 3,385,294 4,281,152  79.07

Source: State of Arizona - 2020 General Election, (select "View More" in upper right of race, then select "By County");
        Click on "Registered Voters:" at top of page to see Registered Voters
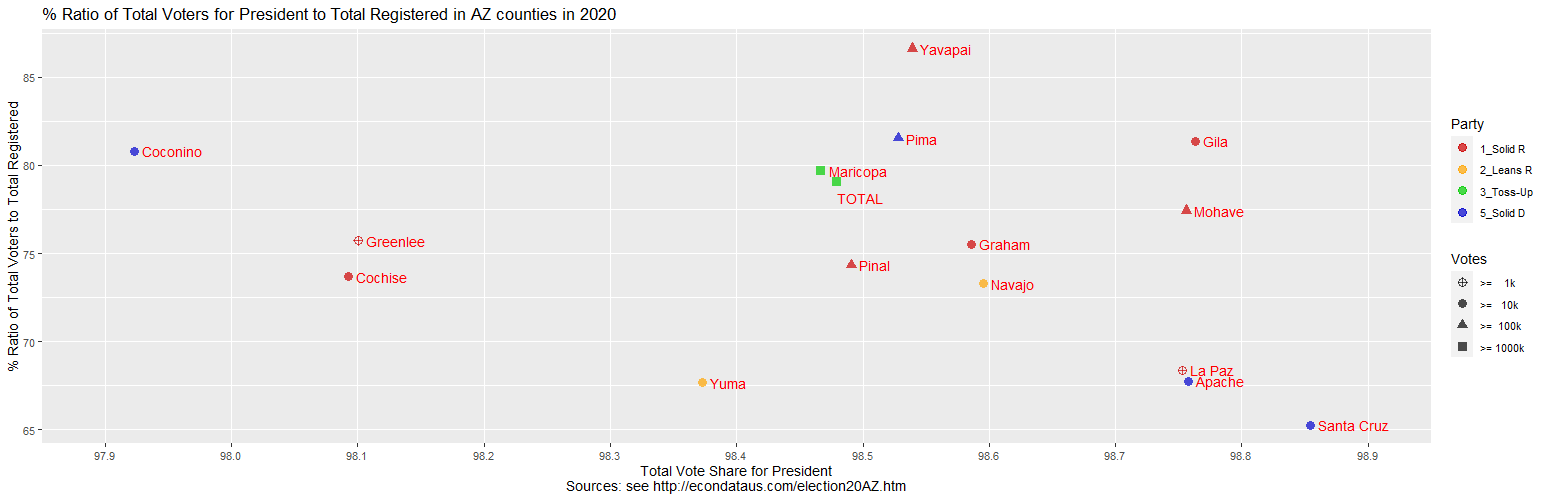
Percent ratio of Voters for President to Registered Voters in AZ counties in 2020 (Percent)

       COUNTY Biden Trump MARGIN1 TOTAL1 TOTAL2 TOT_SH
1      Apache 66.23 32.53   33.69  98.76    100  67.76
2     Cochise 39.26 58.83  -19.56  98.09    100  73.69
3    Coconino 61.00 36.92   24.08  97.92    100  80.81
4        Gila 32.33 66.43  -34.10  98.76    100  81.36
5      Graham 26.90 71.68  -44.78  98.59    100  75.54
6    Greenlee 32.08 66.02  -33.95  98.10    100  75.73
7      La Paz 29.98 68.77  -38.79  98.75    100  68.37
8    Maricopa 50.32 48.14    2.18  98.47    100  79.69
9      Mohave 23.72 75.03  -51.31  98.76    100  77.43
10     Navajo 45.17 53.43   -8.26  98.60    100  73.27
11       Pima 58.61 39.92   18.68  98.53    100  81.52
12      Pinal 40.60 57.89  -17.28  98.49    100  74.32
13 Santa Cruz 67.18 31.67   35.51  98.85    100  65.27
14    Yavapai 34.63 63.91  -29.27  98.54    100  86.61
15       Yuma 46.09 52.28   -6.19  98.37    100  67.67
16      TOTAL 49.39 49.09    0.31  98.48    100  79.07

Source: State of Arizona - 2020 General Election, (select "View More" in upper right of race, then select "By County");
        Click on "Registered Voters:" at top of page to see Registered Voters
Note: The above plot and tables contradict the following statement from page 4 of Volume 3 of the Navarro Report, titled "Yes, President Trump Won: The Case, Evidence, & Statistical Receipts":
The Copper State also accomplished the remarkable feat of exceeding 100% turnout of its registered voters. This is indeed a remarkable feat because Arizona does not allow same-day voter registration.