Ages by Occupation in the United States
(counts by age group in 2014)
Age Employed Computer Engineer Science Healthcare Legal CEOs
----- ---------- ---------- ---------- ---------- ---------- ---------- ----------
0- 4 0 0 0 0 0 0 0
5- 9 0 0 0 0 0 0 0
10-14 0 0 0 0 0 0 0
15-19 4992702 22059 9377 9401 28258 887 415
20-24 14746216 236507 154832 101936 472690 40004 5605
25-29 16408676 515461 299111 176943 1047155 156003 24690
30-34 16386246 655464 322807 177629 1212189 209175 59675
35-39 15520550 643236 295334 168280 1110823 194139 97251
40-44 16129203 642078 288963 139145 1135270 203938 147939
45-49 16089880 561603 305180 120490 1034263 198836 177651
50-54 16695091 515746 353201 121934 1070192 197160 199817
55-59 14476564 370216 303998 113476 1022979 172136 178575
60-64 9921469 212113 191847 95950 722110 154146 143440
65-69 4535972 69156 77873 50847 286193 88579 79529
70-74 1849726 17418 26601 19202 100316 40661 34935
75-79 796453 4046 10035 6492 39564 13307 12191
80-84 287078 924 3093 2801 10775 6257 5791
85-89 96414 359 1368 1060 4346 2534 3130
90-94 27977 418 130 275 1078 963 1016
95-99 1797 75 123 82 65 0 0
----- ---------- ---------- ---------- ---------- ---------- ---------- ----------
total 148962014 4466879 2643873 1305943 9298266 1678725 1171650
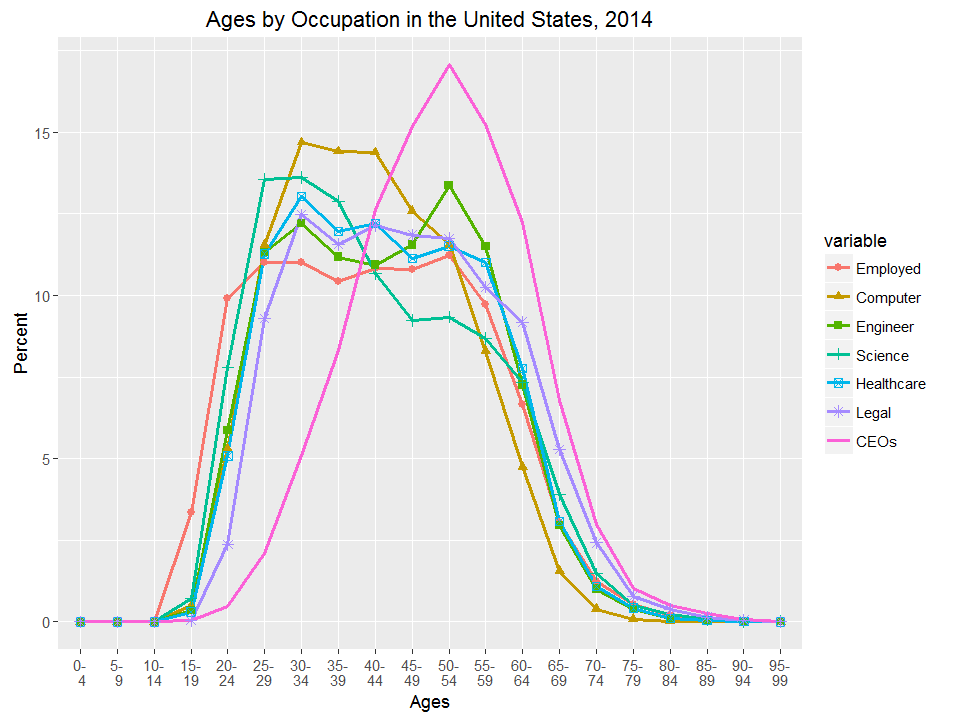
Ages by Occupation in the United States
(percents by age group in 2014)
Age Employed Computer Engineer Science Healthcare Legal CEOs
----- ---------- ---------- ---------- ---------- ---------- ---------- ----------
0- 4 0.0 0.0 0.0 0.0 0.0 0.0 0.0
5- 9 0.0 0.0 0.0 0.0 0.0 0.0 0.0
10-14 0.0 0.0 0.0 0.0 0.0 0.0 0.0
15-19 3.4 0.5 0.4 0.7 0.3 0.1 0.0
20-24 9.9 5.3 5.9 7.8 5.1 2.4 0.5
25-29 11.0 11.5 11.3 13.5 11.3 9.3 2.1
30-34 11.0 14.7 12.2 13.6 13.0 12.5 5.1
35-39 10.4 14.4 11.2 12.9 11.9 11.6 8.3
40-44 10.8 14.4 10.9 10.7 12.2 12.1 12.6
45-49 10.8 12.6 11.5 9.2 11.1 11.8 15.2
50-54 11.2 11.5 13.4 9.3 11.5 11.7 17.1
55-59 9.7 8.3 11.5 8.7 11.0 10.3 15.2
60-64 6.7 4.7 7.3 7.3 7.8 9.2 12.2
65-69 3.0 1.5 2.9 3.9 3.1 5.3 6.8
70-74 1.2 0.4 1.0 1.5 1.1 2.4 3.0
75-79 0.5 0.1 0.4 0.5 0.4 0.8 1.0
80-84 0.2 0.0 0.1 0.2 0.1 0.4 0.5
85-89 0.1 0.0 0.1 0.1 0.0 0.2 0.3
90-94 0.0 0.0 0.0 0.0 0.0 0.1 0.1
95-99 0.0 0.0 0.0 0.0 0.0 0.0 0.0
----- ---------- ---------- ---------- ---------- ---------- ---------- ----------
total 100.0 100.0 100.0 100.0 100.0 100.0 100.0
==================================================================================
Ages by Occupation in California
(counts by age group in 2014)
Age Employed Computer Engineer Science Healthcare Legal CEOs
----- ---------- ---------- ---------- ---------- ---------- ---------- ----------
0- 4 0 0 0 0 0 0 0
5- 9 0 0 0 0 0 0 0
10-14 0 0 0 0 0 0 0
15-19 437098 3562 1083 1289 1115 176 0
20-24 1775218 33453 15076 15643 34441 4360 928
25-29 2132801 75616 42372 25912 104537 20328 4788
30-34 2095053 103512 43499 28302 130716 29314 9743
35-39 1954425 94913 41109 27037 119281 19563 14826
40-44 1971346 87448 40378 19242 130234 26032 20536
45-49 1957982 72146 38782 16957 103930 26397 26225
50-54 1926499 57912 54858 18579 105079 23438 27231
55-59 1592851 41905 40200 11931 103693 20706 24812
60-64 1074751 23937 25025 13478 74169 22315 16568
65-69 509067 5866 12876 6754 32942 14174 8848
70-74 194248 3358 4799 2402 14399 5038 5241
75-79 80530 398 1776 1235 5876 1894 1645
80-84 29250 132 235 303 1452 874 796
85-89 12115 60 479 321 778 107 387
90-94 2887 0 0 0 0 300 401
95-99 0 0 0 0 0 0 0
----- ---------- ---------- ---------- ---------- ---------- ---------- ----------
total 17746121 604218 362547 189385 962642 215016 162975
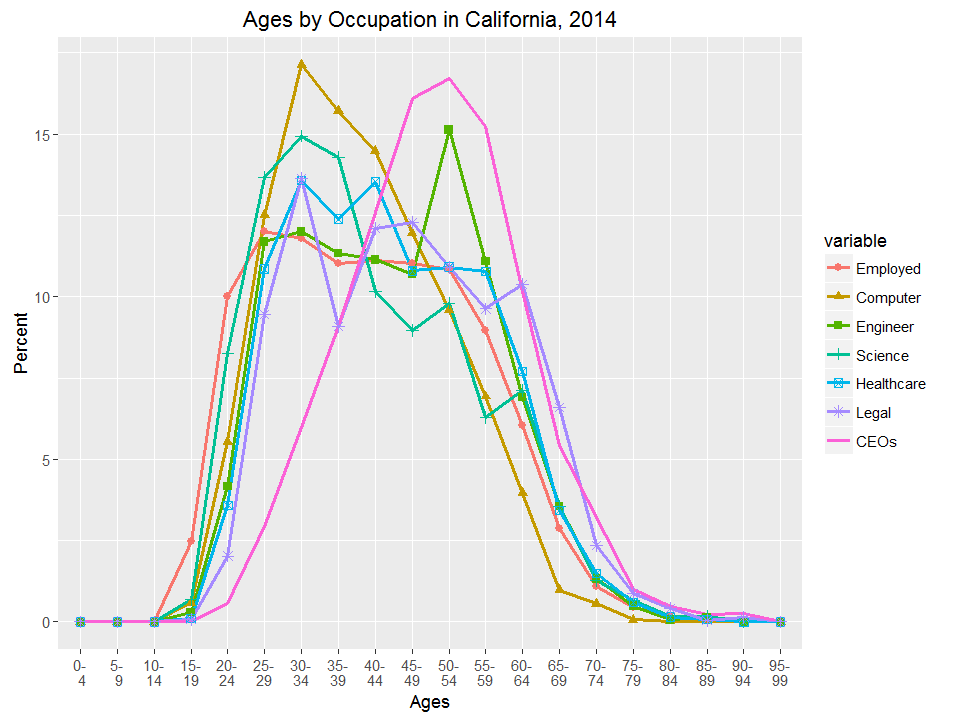
Ages by Occupation in California
(percents by age group in 2014)
Age Employed Computer Engineer Science Healthcare Legal CEOs
----- ---------- ---------- ---------- ---------- ---------- ---------- ----------
0- 4 0.0 0.0 0.0 0.0 0.0 0.0 0.0
5- 9 0.0 0.0 0.0 0.0 0.0 0.0 0.0
10-14 0.0 0.0 0.0 0.0 0.0 0.0 0.0
15-19 2.5 0.6 0.3 0.7 0.1 0.1 0.0
20-24 10.0 5.5 4.2 8.3 3.6 2.0 0.6
25-29 12.0 12.5 11.7 13.7 10.9 9.5 2.9
30-34 11.8 17.1 12.0 14.9 13.6 13.6 6.0
35-39 11.0 15.7 11.3 14.3 12.4 9.1 9.1
40-44 11.1 14.5 11.1 10.2 13.5 12.1 12.6
45-49 11.0 11.9 10.7 9.0 10.8 12.3 16.1
50-54 10.9 9.6 15.1 9.8 10.9 10.9 16.7
55-59 9.0 6.9 11.1 6.3 10.8 9.6 15.2
60-64 6.1 4.0 6.9 7.1 7.7 10.4 10.2
65-69 2.9 1.0 3.6 3.6 3.4 6.6 5.4
70-74 1.1 0.6 1.3 1.3 1.5 2.3 3.2
75-79 0.5 0.1 0.5 0.7 0.6 0.9 1.0
80-84 0.2 0.0 0.1 0.2 0.2 0.4 0.5
85-89 0.1 0.0 0.1 0.2 0.1 0.0 0.2
90-94 0.0 0.0 0.0 0.0 0.0 0.1 0.2
95-99 0.0 0.0 0.0 0.0 0.0 0.0 0.0
----- ---------- ---------- ---------- ---------- ---------- ---------- ----------
total 100.0 100.0 100.0 100.0 100.0 100.0 100.0
==================================================================================
Ages by Occupation in the San Francisco Bay Area
(counts by age group in 2014)
Age Employed Computer Engineer Science Healthcare Legal CEOs
----- ---------- ---------- ---------- ---------- ---------- ---------- ----------
0- 4 0 0 0 0 0 0 0
5- 9 0 0 0 0 0 0 0
10-14 0 0 0 0 0 0 0
15-19 51962 823 137 268 292 0 0
20-24 204922 12178 3317 3719 3111 589 23
25-29 333202 31636 13996 9612 14972 3373 935
30-34 346759 47079 13635 9246 20052 7287 1431
35-39 322549 39258 14223 8349 18028 5344 2202
40-44 308600 31898 14412 4995 21446 5363 3204
45-49 299408 25774 12818 4868 13530 4232 3527
50-54 280491 17322 12487 3975 13789 3853 5235
55-59 225766 11183 10312 2167 16744 3080 3261
60-64 155169 7660 7015 2767 10350 3471 2233
65-69 72451 1307 2639 1635 3681 2544 1260
70-74 29083 619 1029 571 1962 778 770
75-79 11110 51 534 277 1099 549 109
80-84 3945 0 0 107 282 297 115
85-89 1027 0 0 101 99 0 0
90-94 545 0 0 0 0 0 0
95-99 0 0 0 0 0 0 0
----- ---------- ---------- ---------- ---------- ---------- ---------- ----------
total 2646989 226788 106554 52657 139437 40760 24305
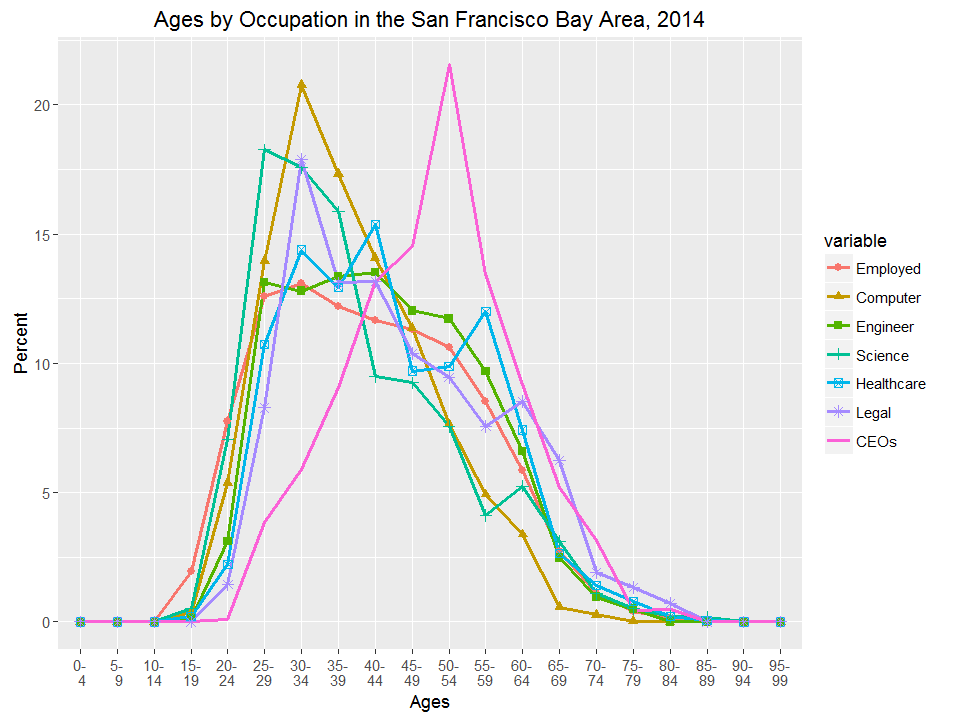
Ages by Occupation in the San Francisco Bay Area
(percents by age group in 2014)
Age Employed Computer Engineer Science Healthcare Legal CEOs
----- ---------- ---------- ---------- ---------- ---------- ---------- ----------
0- 4 0.0 0.0 0.0 0.0 0.0 0.0 0.0
5- 9 0.0 0.0 0.0 0.0 0.0 0.0 0.0
10-14 0.0 0.0 0.0 0.0 0.0 0.0 0.0
15-19 2.0 0.4 0.1 0.5 0.2 0.0 0.0
20-24 7.7 5.4 3.1 7.1 2.2 1.4 0.1
25-29 12.6 13.9 13.1 18.3 10.7 8.3 3.8
30-34 13.1 20.8 12.8 17.6 14.4 17.9 5.9
35-39 12.2 17.3 13.3 15.9 12.9 13.1 9.1
40-44 11.7 14.1 13.5 9.5 15.4 13.2 13.2
45-49 11.3 11.4 12.0 9.2 9.7 10.4 14.5
50-54 10.6 7.6 11.7 7.5 9.9 9.5 21.5
55-59 8.5 4.9 9.7 4.1 12.0 7.6 13.4
60-64 5.9 3.4 6.6 5.3 7.4 8.5 9.2
65-69 2.7 0.6 2.5 3.1 2.6 6.2 5.2
70-74 1.1 0.3 1.0 1.1 1.4 1.9 3.2
75-79 0.4 0.0 0.5 0.5 0.8 1.3 0.4
80-84 0.1 0.0 0.0 0.2 0.2 0.7 0.5
85-89 0.0 0.0 0.0 0.2 0.1 0.0 0.0
90-94 0.0 0.0 0.0 0.0 0.0 0.0 0.0
95-99 0.0 0.0 0.0 0.0 0.0 0.0 0.0
----- ---------- ---------- ---------- ---------- ---------- ---------- ----------
total 100.0 100.0 100.0 100.0 100.0 100.0 100.0
==================================================================================
Source: Integrated Public Use Microdata Series (IPUMS), United States Census Bureau;
ACS Occupation Codes (OCC);
U.S. Census STEM, STEM-related, and Non-STEM Occupation Code List 2010;
May 2015 Occupation Profiles, Bureau of Labor Statistics
Note: Bay Area is taken to include Santa Clara, Alameda, San Mateo, and San Francisco counties;
Following are the 2010 Census Codes used in the above tables:
Occupation occ values included for empstat == 2 (employed)
---------- -----------------------------------------------
Employed all values of occ
Computer occ %in% c(110,1000:1199)
Engineer occ %in% c(300,1310:1560)
Science occ %in% c(360,1600:1965)
Healthcare occ %in% c(350,3000:3540)
Legal occ %in% c(2100:2160)
CEOs occ %in% c(10)
Following is information on computer occupations taken chiefly from the Bureau of Labor Statistics:
| Census Code | SOC Code | SOC Title | SOC Description |
| 0110 | 11-3021 | Computer and Information Systems Managers | Plan, direct, or coordinate activities in such fields as electronic data processing, information systems, systems analysis, and computer programming. Excludes "Computer Occupations" (15-1111 through 15-1199). |
| 1005 | 15-1111 | Computer and Information Research Scientists | Conduct research into fundamental computer and information science as theorists, designers, or inventors. Develop solutions to problems in the field of computer hardware and software. |
| 1006 | 15-1121 | Computer Systems Analysts | Analyze science, engineering, business, and other data processing problems to implement and improve computer systems. Analyze user requirements, procedures, and problems to automate or improve existing systems and review computer system capabilities, workflow, and scheduling limitations. May analyze or recommend commercially available software. |
| 1007 | 15-1122 | Information Security Analysts | Plan, implement, upgrade, or monitor security measures for the protection of computer networks and information. May ensure appropriate security controls are in place that will safeguard digital files and vital electronic infrastructure. May respond to computer security breaches and viruses. Excludes "Computer Network Architects" (15-1143). |
| 1010 | 15-1131 | Computer Programmers | Create, modify, and test the code, forms, and script that allow computer applications to run. Work from specifications drawn up by software developers or other individuals. May assist software developers by analyzing user needs and designing software solutions. May develop and write computer programs to store, locate, and retrieve specific documents, data, and information. |
| 1020+ | 15-1132 | Software Developers, Applications | Develop, create, and modify general computer applications software or specialized utility programs. Analyze user needs and develop software solutions. Design software or customize software for client use with the aim of optimizing operational efficiency. May analyze and design databases within an application area, working individually or coordinating database development as part of a team. May supervise computer programmers. |
| 1020+ | 15-1133 | Software Developers, Systems Software | Research, design, develop, and test operating systems-level software, compilers, and network distribution software for medical, industrial, military, communications, aerospace, business, scientific, and general computing applications. Set operational specifications and formulate and analyze software requirements. May design embedded systems software. Apply principles and techniques of computer science, engineering, and mathematical analysis. |
| 1030 | 15-1134 | Web Developers | Design, create, and modify Web sites. Analyze user needs to implement Web site content, graphics, performance, and capacity. May integrate Web sites with other computer applications. May convert written, graphic, audio, and video components to compatible Web formats by using software designed to facilitate the creation of Web and multimedia content. Excludes "Multimedia Artists and Animators" (27-1014). |
| 1060 | 15-1141 | Database Administrators | Administer, test, and implement computer databases, applying knowledge of database management systems. Coordinate changes to computer databases. May plan, coordinate, and implement security measures to safeguard computer databases. Excludes "Information Security Analysts" (15-1122). |
| 1105 | 15-1142 | Network and Computer Systems Administrators | Install, configure, and support an organization's local area network (LAN), wide area network (WAN), and Internet systems or a segment of a network system. Monitor network to ensure network availability to all system users and may perform necessary maintenance to support network availability. May monitor and test Web site performance to ensure Web sites operate correctly and without interruption. May assist in network modeling, analysis, planning, and coordination between network and data communications hardware and software. May supervise computer user support specialists and computer network support specialists. May administer network security measures. Excludes "Information Security Analysts"(15-1122), "Computer User Support Specialists" (15-1151), and "Computer Network Support Specialists" (15-1152). |
| 1106 | 15-1143 | Computer Network Architects | Design and implement computer and information networks, such as local area networks (LAN), wide area networks (WAN), intranets, extranets, and other data communications networks. Perform network modeling, analysis, and planning. May also design network and computer security measures. May research and recommend network and data communications hardware and software. Excludes "Information Security Analysts" (15-1122), "Network and Computer Systems Administrators" (15-1142), and "Computer Network Support Specialists" (15-1152). |
| 1050+ | 15-1151 | Computer User Support Specialists | Provide technical assistance to computer users. Answer questions or resolve computer problems for clients in person, or via telephone or electronically. May provide assistance concerning the use of computer hardware and software, including printing, installation, word processing, electronic mail, and operating systems. Excludes "Network and Computer Systems Administrators" (15-1142). |
| 1050+ | 15-1152 | Computer Network Support Specialists | Analyze, test, troubleshoot, and evaluate existing network systems, such as local area network (LAN), wide area network (WAN), and Internet systems or a segment of a network system. Perform network maintenance to ensure networks operate correctly with minimal interruption. Excludes "Network and Computer Systems Administrators" (15-1142) and "Computer Network Architects" (15-1143). |
| 1107 | 15-1199 | Computer Occupations, All Other | All computer occupations not listed separately. Excludes "Computer and Information Systems Managers" (11-3021), "Computer Hardware Engineers" (17-2061), "Electrical and Electronics Engineers" (17-2070), "Computer Science Teachers, Postsecondary" (25-1021), "Multimedia Artists and Animators" (27-1014), "Graphic Designers" (27-1024), "Computer Operators" (43-9011), and "Computer, Automated Teller, and Office Machine Repairs" (49-2011). |
For more information, see IPUMS Documentation: User's Guide
Ages of Software Developers, Applications and System Software
(counts by age group in 2014)
Santa San San United
Age Bay Area Clara Alameda Mateo Francisco California States
----- --------- --------- --------- --------- --------- ---------- ----------
15-19 332 161 0 0 171 610 2127
20-24 6642 2228 1370 769 2275 11325 52565
25-29 19241 10426 3226 1220 4369 34040 149691
30-34 28586 15744 5594 3337 3911 48921 200396
35-39 23615 12207 5979 2964 2465 38037 174051
40-44 16032 8651 3887 1909 1585 33350 154031
45-49 12379 8212 2452 934 781 23640 129594
50-54 7057 4455 972 898 732 15820 109912
55-59 4781 3806 725 109 141 11999 74374
60-64 2828 1839 312 389 288 5608 40091
65-69 569 288 98 0 183 2441 12763
70-74 61 0 61 0 0 478 2860
----- --------- --------- --------- --------- --------- ---------- ----------
total 122123 68017 24676 12529 16901 226456 1103843
Ages of Software Developers, Applications and System Software
(percents by age group in 2014)
Santa San San United
Age Bay Area Clara Alameda Mateo Francisco California States
----- --------- --------- --------- --------- --------- ---------- ----------
15-19 0.3 0.2 0.0 0.0 1.0 0.3 0.2
20-24 5.4 3.3 5.6 6.1 13.5 5.0 4.8
25-29 15.8 15.3 13.1 9.7 25.9 15.0 13.6
30-34 23.4 23.1 22.7 26.6 23.1 21.6 18.2
35-39 19.3 17.9 24.2 23.7 14.6 16.8 15.8
40-44 13.1 12.7 15.8 15.2 9.4 14.7 14.0
45-49 10.1 12.1 9.9 7.5 4.6 10.4 11.7
50-54 5.8 6.5 3.9 7.2 4.3 7.0 10.0
55-59 3.9 5.6 2.9 0.9 0.8 5.3 6.7
60-64 2.3 2.7 1.3 3.1 1.7 2.5 3.6
65-69 0.5 0.4 0.4 0.0 1.1 1.1 1.2
----- --------- --------- --------- --------- --------- ---------- ----------
total 100.0 100.0 100.0 100.0 100.0 100.0 100.0
===================================================================================
Ages of Computer Programmers, Software Developers, Applications and System Software
(counts by age group in 2014)
Santa San San United
Age Bay Area Clara Alameda Mateo Francisco California States
----- --------- --------- --------- --------- --------- ---------- ----------
15-19 332 161 0 0 171 1284 4776
20-24 8339 2897 1813 846 2783 16133 77463
25-29 21953 11707 3867 1376 5003 41481 192131
30-34 31741 16699 6799 3471 4772 56439 254953
35-39 25524 13265 6588 3035 2636 48569 228431
40-44 17691 9425 4591 1973 1702 39874 212807
45-49 15020 8875 3116 1308 1721 31015 193410
50-54 8132 4890 1307 965 970 19677 164265
55-59 5633 4152 869 239 373 16344 119125
60-64 3286 1993 495 389 409 8107 67790
65-69 653 288 98 84 183 2891 23432
70-74 427 0 427 0 0 1007 6646
----- --------- --------- --------- --------- --------- ---------- ----------
total 138731 74352 29970 13686 20723 283192 1547484
Ages of Computer Programmers, Software Developers, Applications and System Software
(percents by age group in 2014)
Santa San San United
Age Bay Area Clara Alameda Mateo Francisco California States
----- --------- --------- --------- --------- --------- ---------- ----------
15-19 0.2 0.2 0.0 0.0 0.8 0.5 0.3
20-24 6.0 3.9 6.0 6.2 13.4 5.7 5.0
25-29 15.8 15.7 12.9 10.1 24.1 14.6 12.4
30-34 22.9 22.5 22.7 25.4 23.0 19.9 16.5
35-39 18.4 17.8 22.0 22.2 12.7 17.2 14.8
40-44 12.8 12.7 15.3 14.4 8.2 14.1 13.8
45-49 10.8 11.9 10.4 9.6 8.3 11.0 12.5
50-54 5.9 6.6 4.4 7.1 4.7 6.9 10.6
55-59 4.1 5.6 2.9 1.7 1.8 5.8 7.7
60-64 2.4 2.7 1.7 2.8 2.0 2.9 4.4
65-69 0.5 0.4 0.3 0.6 0.9 1.0 1.5
70-74 0.3 0.0 1.4 0.0 0.0 0.4 0.4
----- --------- --------- --------- --------- --------- ---------- ----------
total 100.0 100.0 100.0 100.0 100.0 100.0 100.0
=============================================================================
Ages of All Computer Occupations (workers only)
(counts by age group in 2014)
Santa San San United
Age Bay Area Clara Alameda Mateo Francisco California States
----- --------- --------- --------- --------- --------- ---------- ----------
15-19 823 332 243 77 171 3562 21000
20-24 11680 4144 2937 1188 3411 32706 227874
25-29 29451 14331 6245 1802 7073 70616 486868
30-34 44181 20890 10650 4989 7652 95440 599466
35-39 35911 17482 9823 3965 4641 84920 562680
40-44 27422 12699 8008 3177 3538 74531 548031
45-49 22304 12015 5181 2353 2755 62232 470185
50-54 14429 6593 3122 1542 3172 47316 432740
55-59 9697 5754 2132 664 1147 36499 307658
60-64 7031 3041 2472 756 762 20995 181853
65-69 1101 437 263 84 317 4910 58600
70-74 619 0 517 102 0 2969 15124
75-79 51 0 0 51 0 398 3791
----- --------- --------- --------- --------- --------- ---------- ----------
total 204700 97718 51593 20750 34639 537286 3917415
Ages of All Computer Occupations (workers only)
(percents by age group in 2014)
Santa San San United
Age Bay Area Clara Alameda Mateo Francisco California States
----- --------- --------- --------- --------- --------- ---------- ----------
15-19 0.4 0.3 0.5 0.4 0.5 0.7 0.5
20-24 5.7 4.2 5.7 5.7 9.8 6.1 5.8
25-29 14.4 14.7 12.1 8.7 20.4 13.1 12.4
30-34 21.6 21.4 20.6 24.0 22.1 17.8 15.3
35-39 17.5 17.9 19.0 19.1 13.4 15.8 14.4
40-44 13.4 13.0 15.5 15.3 10.2 13.9 14.0
45-49 10.9 12.3 10.0 11.3 8.0 11.6 12.0
50-54 7.0 6.7 6.1 7.4 9.2 8.8 11.0
55-59 4.7 5.9 4.1 3.2 3.3 6.8 7.9
60-64 3.4 3.1 4.8 3.6 2.2 3.9 4.6
65-69 0.5 0.4 0.5 0.4 0.9 0.9 1.5
70-74 0.3 0.0 1.0 0.5 0.0 0.6 0.4
75-79 0.0 0.0 0.0 0.2 0.0 0.1 0.1
----- --------- --------- --------- --------- --------- ---------- ----------
total 100.0 100.0 100.0 100.0 100.0 100.0 100.0
================================================================================
Ages of All Computer and Mathematical Occupations (workers and managers) in 2014
(counts by age group in 2014)
Santa San San United
Age Bay Area Clara Alameda Mateo Francisco California States
----- --------- --------- --------- --------- --------- ---------- ----------
15-19 823 332 243 77 171 3562 22166
20-24 12385 4399 3002 1188 3796 33963 243643
25-29 32772 15452 6942 1920 8458 79299 546165
30-34 48225 22035 11194 5760 9236 108273 688840
35-39 40353 18831 11551 4422 5549 97518 671394
40-44 32327 14950 8879 3608 4890 90766 667437
45-49 26148 13425 6267 3095 3361 74325 584187
50-54 17877 7756 4433 1939 3749 61613 540010
55-59 11533 6387 3062 878 1206 43212 391221
60-64 7786 3274 2668 949 895 25485 226050
65-69 1437 637 263 155 382 6603 74983
70-74 753 134 517 102 0 3597 18775
75-79 51 0 0 51 0 398 4463
----- --------- --------- --------- --------- --------- ---------- ----------
total 232470 107612 59021 24144 41693 628806 4681412
Ages of All Computer and Mathematical Occupations (workers and managers) in 2014
(percents by age group in 2014)
Santa San San United
Age Bay Area Clara Alameda Mateo Francisco California States
----- --------- --------- --------- --------- --------- ---------- ----------
15-19 0.4 0.3 0.4 0.3 0.4 0.6 0.5
20-24 5.3 4.1 5.1 4.9 9.1 5.4 5.2
25-29 14.1 14.4 11.8 8.0 20.3 12.6 11.7
30-34 20.7 20.5 19.0 23.9 22.2 17.2 14.7
35-39 17.4 17.5 19.6 18.3 13.3 15.5 14.3
40-44 13.9 13.9 15.0 14.9 11.7 14.4 14.3
45-49 11.2 12.5 10.6 12.8 8.1 11.8 12.5
50-54 7.7 7.2 7.5 8.0 9.0 9.8 11.5
55-59 5.0 5.9 5.2 3.6 2.9 6.9 8.4
60-64 3.3 3.0 4.5 3.9 2.1 4.1 4.8
65-69 0.6 0.6 0.4 0.6 0.9 1.1 1.6
70-74 0.3 0.1 0.9 0.4 0.0 0.6 0.4
75-79 0.0 0.0 0.0 0.2 0.0 0.1 0.1
----- --------- --------- --------- --------- --------- ---------- ----------
total 100.0 100.0 100.0 100.0 100.0 100.0 100.0
=============================================================================
Ages of Computer and Information Systems Managers
(counts by age group in 2014)
Santa San San United
Age Bay Area Clara Alameda Mateo Francisco California States
----- --------- --------- --------- --------- --------- ---------- ----------
20-24 498 97 65 0 336 747 8633
25-29 2185 757 574 118 736 5000 28593
30-34 2898 845 383 350 1320 8072 55998
35-39 3347 997 985 457 908 9993 80556
40-44 4476 2014 679 431 1352 12917 94047
45-49 3470 1290 979 595 606 9914 91418
50-54 2893 958 1188 397 350 10596 83006
55-59 1486 472 741 214 59 5406 62558
60-64 629 233 129 193 74 2942 30260
65-69 206 141 0 0 65 956 10556
----- --------- --------- --------- --------- --------- ---------- ----------
total 22088 7804 5723 2755 5806 66932 549464
Ages of Computer and Information Systems Managers
(percents by age group in 2014)
Santa San San United
Age Bay Area Clara Alameda Mateo Francisco California States
----- --------- --------- --------- --------- --------- ---------- ----------
20-24 2.3 1.2 1.1 0.0 5.8 1.1 1.6
25-29 9.9 9.7 10.0 4.3 12.7 7.5 5.2
30-34 13.1 10.8 6.7 12.7 22.7 12.1 10.2
35-39 15.2 12.8 17.2 16.6 15.6 14.9 14.7
40-44 20.3 25.8 11.9 15.6 23.3 19.3 17.1
45-49 15.7 16.5 17.1 21.6 10.4 14.8 16.6
50-54 13.1 12.3 20.8 14.4 6.0 15.8 15.1
55-59 6.7 6.0 12.9 7.8 1.0 8.1 11.4
60-64 2.8 3.0 2.3 7.0 1.3 4.4 5.5
65-69 0.9 1.8 0.0 0.0 1.1 1.4 1.9
----- --------- --------- --------- --------- --------- ---------- ----------
total 100.0 100.0 100.0 100.0 100.0 100.0 100.0
================================================================================================
Ages of Computer Programmers, Software Developers, Applications and System Software
(counts by age group in Bay Area and all Santa Clara County PUMAs in 2014)
Bay MV&PA Sunny SClar Miltp AlmRk Gi&MH CuSLG Campb NW SJ Ce SJ So SJ SW SJ SE SJ Ea SJ
Age Area 8501 8502 8503 8504 8505 8506 8507 8508 8509 8510 8511 8512 8513 8514
----- ------ ----- ----- ----- ----- ----- ----- ----- ----- ----- ----- ----- ----- ----- -----
15-19 332 0 0 0 0 0 0 111 0 0 0 0 0 50 0
20-24 8339 852 574 236 0 0 0 336 302 147 81 96 181 92 0
25-29 21953 1713 3540 3062 1557 76 0 0 304 857 261 0 111 0 226
30-34 31741 3091 4784 3100 1498 171 64 859 1379 768 356 248 127 213 41
35-39 25524 1982 3258 1440 721 138 0 1895 1128 1129 288 371 459 353 103
40-44 17691 1586 1374 972 412 153 0 1368 1000 0 789 996 202 513 60
45-49 15020 1334 478 652 241 106 288 1757 1288 504 359 216 803 743 106
50-54 8132 572 398 233 170 61 0 1189 822 276 61 488 370 250 0
55-59 5633 659 381 0 533 0 661 373 343 221 336 369 126 0 150
60-64 3286 271 228 224 439 0 0 139 539 0 0 0 83 70 0
65-69 653 103 65 74 0 0 0 46 0 0 0 0 0 0 0
70-74 427 0 0 0 0 0 0 0 0 0 0 0 0 0 0
----- ------ ----- ----- ----- ----- ----- ----- ----- ----- ----- ----- ----- ----- ----- -----
total 138731 12163 15080 9993 5571 705 1013 8073 7105 3902 2531 2784 2462 2284 686
Ages of Computer Programmers, Software Developers, Applications and System Software
(percents by age group in Bay Area and all Santa Clara County PUMAs in 2014)
Bay MV&PA Sunny SClar Miltp AlmRk Gi&MH CuSLG Campb NW SJ Ce SJ So SJ SW SJ SE SJ Ea SJ
Age Area 8501 8502 8503 8504 8505 8506 8507 8508 8509 8510 8511 8512 8513 8514
----- ------ ----- ----- ----- ----- ----- ----- ----- ----- ----- ----- ----- ----- ----- -----
15-19 0.2 0.0 0.0 0.0 0.0 0.0 0.0 1.4 0.0 0.0 0.0 0.0 0.0 2.2 0.0
20-24 6.0 7.0 3.8 2.4 0.0 0.0 0.0 4.2 4.3 3.8 3.2 3.4 7.4 4.0 0.0
25-29 15.8 14.1 23.5 30.6 27.9 10.8 0.0 0.0 4.3 22.0 10.3 0.0 4.5 0.0 32.9
30-34 22.9 25.4 31.7 31.0 26.9 24.3 6.3 10.6 19.4 19.7 14.1 8.9 5.2 9.3 6.0
35-39 18.4 16.3 21.6 14.4 12.9 19.6 0.0 23.5 15.9 28.9 11.4 13.3 18.6 15.5 15.0
40-44 12.8 13.0 9.1 9.7 7.4 21.7 0.0 16.9 14.1 0.0 31.2 35.8 8.2 22.5 8.7
45-49 10.8 11.0 3.2 6.5 4.3 15.0 28.4 21.8 18.1 12.9 14.2 7.8 32.6 32.5 15.5
50-54 5.9 4.7 2.6 2.3 3.1 8.7 0.0 14.7 11.6 7.1 2.4 17.5 15.0 10.9 0.0
55-59 4.1 5.4 2.5 0.0 9.6 0.0 65.3 4.6 4.8 5.7 13.3 13.3 5.1 0.0 21.9
60-64 2.4 2.2 1.5 2.2 7.9 0.0 0.0 1.7 7.6 0.0 0.0 0.0 3.4 3.1 0.0
65-69 0.5 0.8 0.4 0.7 0.0 0.0 0.0 0.6 0.0 0.0 0.0 0.0 0.0 0.0 0.0
70-74 0.3 0.0 0.0 0.0 0.0 0.0 0.0 0.0 0.0 0.0 0.0 0.0 0.0 0.0 0.0
----- ------ ----- ----- ----- ----- ----- ----- ----- ----- ----- ----- ----- ----- ----- -----
total 100.0 100.0 100.0 100.0 100.0 100.0 100.0 100.0 100.0 100.0 100.0 100.0 100.0 100.0 100.0
Source: Integrated Public Use Microdata Series (IPUMS), United States Census Bureau
Create extract with variables STATEFIP, COUNTY, MET2013, PUMA, AGE, CITIZEN, EMPSTAT, and OCC.
The variables YEAR, DATANUM, SERIAL, HHWT, GQ, PERNUM, and PERWT are automatically preselected.
For samples, select ACS for 2014. For data format, select STATA. For structure, select rectangular.
For more information, see IPUMS Documentation: User's Guide
Note: Bay Area is taken to include Santa Clara, Alameda, San Mateo, and San Francisco counties;
Following are the 2010 Census Codes used in the above tables:
Codes Description
---------------- -----------
c(1020) Software Developers, Applications and System Software
c(1010,1020) Computer Programmers, Software Developers, Applications and System Software
c(1000:1199) All Computer Occupations (workers only)
c(110,1000:1240) All Computer and Mathematical Occupations (workers and managers)
c(110) Computer and Information Systems Managers
c(1010,1020) Computer Programmers, Software Developers, Applications and System Software
2010 Census Computer and Mathematical Occupation Code List
2010 2010
Census SOC
Occupation 2010 Description Code Code
------------------------------------------------------ ------ ---------
Computer and information systems managers 0110 11-3021
Computer and information research scientists 1005 15-1111
Computer systems analysts 1006 15-1121
Information security analysts 1007 15-1122
Computer programmers 1010 15-1131
Software developers, applications and systems software 1020 15-113X
Web developers 1030 15-1134
Computer support specialists 1050 15-1150
Database administrators 1060 15-1141
Network and computer systems administrators 1105 15-1142
Computer network architects 1106 15-1143
Computer occupations, all other 1107 15-1199
------------------------------------------------------ ------ ---------
Actuaries 1200 15-2011
Mathematicians 1210 15-2021
Operations research analysts 1220 15-2031
Statisticians 1230 15-2041
Miscellaneous mathematical science occupations 1240 15-2090
Source: 2010 Census STEM, STEM-related, and Non-STEM Occupation Code List 2010
2010 Census Public Use Microdata Areas (PUMAs) for San Francisco Bay Area
Code County and Description
-------- ----------------------
06 00101 Alameda County (North)--Berkeley & Albany Cities PUMA
06 00102 Alameda County (Northwest)--Oakland (Northwest) & Emeryville Cities PUMA
06 00103 Alameda County (Northeast)--Oakland (East) & Piedmont Cities PUMA
06 00104 Alameda County (North Central)--Oakland City (South Central) PUMA
06 00105 Alameda County (West)--San Leandro, Alameda & Oakland (Southwest) Cities PUMA
06 00106 Alameda County (North Central)--Castro Valley, San Lorenzo & Ashland PUMA
06 00107 Alameda County (Central)--Hayward City PUMA
06 00108 Alameda County (Southwest)--Union City, Newark & Fremont (West) Cities PUMA
06 00109 Alameda County (South Central)--Fremont City (East) PUMA
06 00110 Alameda County (East)--Livermore, Pleasanton & Dublin Cities PUMA
06 07501 San Francisco County (North & West)--Richmond District PUMA
06 07502 San Francisco County (North & East)--North Beach & Chinatown PUMA
06 07503 San Francisco County (Central)--South of Market & Potrero PUMA
06 07504 San Francisco County (Central)--Inner Mission & Castro PUMA
06 07505 San Francisco County (Central)--Sunset District (North) PUMA
06 07506 San Francisco County (South Central)--Sunset District (South) PUMA
06 07507 San Francisco County (South Central)--Bayview & Hunters Point PUMA
06 08101 San Mateo County (North Central)--Daly City, Pacifica Cities & Colma Town PUMA
06 08102 San Mateo County (North Central)--South San Francisco, San Bruno & Brisbane Cities PUMA
06 08103 San Mateo County (Central)--San Mateo (North), Burlingame & Millbrae Cities PUMA
06 08104 San Mateo County (South & West)--San Mateo (South) & Half Moon Bay Cities PUMA
06 08105 San Mateo County (East Central)--Redwood City, San Carlos & Belmont Cities PUMA
06 08106 San Mateo County (Southeast)--Menlo Park, East Palo Alto Cities & Atherton Town PUMA
06 08501 Santa Clara County (Northwest)--Mountain View, Palo Alto & Los Altos Cities PUMA
06 08502 Santa Clara County (Northwest)--Sunnyvale & San Jose (North) Cities PUMA
06 08503 Santa Clara County (Northwest)--San Jose (Northwest) & Santa Clara Cities PUMA
06 08504 Santa Clara County (North Central)--Milpitas & San Jose (Northeast) Cities PUMA
06 08505 Santa Clara County (North Central)--San Jose City (East Central) & Alum Rock PUMA
06 08506 Santa Clara County (East)--Gilroy, Morgan Hill & San Jose (South) Cities PUMA
06 08507 Santa Clara County (Southwest)--Cupertino, Saratoga Cities & Los Gatos Town PUMA
06 08508 Santa Clara County (Central)--San Jose (West Central) & Campbell Cities PUMA
06 08509 Santa Clara County (Central)--San Jose City (Northwest) PUMA
06 08510 Santa Clara County (Central)--San Jose City (Central) PUMA
06 08511 Santa Clara County (Central)--San Jose City (South Central/Branham) & Cambrian Park PUMA
06 08512 Santa Clara County (Central)--San Jose City (Southwest/Almaden Valley) PUMA
06 08513 Santa Clara County (Central)--San Jose City (Southeast/Evergreen) PUMA
06 08514 Santa Clara County (Central)--San Jose City (East Central/East Valley) PUMA
Source: 2010 Census Public Use Microdata Area (PUMA) Reference Maps - California