Checking the Shift Between Two Races via the Output Tab
Much has been written about how much national polling was off in the 2020 election. A recent article from FiveThirtyEight asks Why Was The National Polling Environment So Off In 2020?. The article begins:
Heading into the 2020 election, Democrats were favored to not only capture the presidency but also win back the Senate and retain their sizable majority in the House. Much of that came down to the overall national environment, which appeared to be pretty favorable to Democrats, as they held a 7.3-point lead in FiveThirtyEight's final polling average of congressional polls.
A New York Times article from November 12, 2020 is titled 'A Black Eye': Why Political Polling Missed the Mark. Again. It begins by listing some of the bad predictions:
Senator Susan Collins did not lead in a single publicly released poll during the final four months of her re-election campaign in Maine. But Ms. Collins, a Republican, won the election comfortably.
Senator Thom Tillis, a North Carolina Republican, trailed in almost every poll conducted in his race. He won, too.
And most polls underestimated President Trump's strength, in Iowa, Florida, Michigan, Texas, Wisconsin and elsewhere. Instead of winning a landslide, as the polls suggested, Joseph R. Biden Jr. beat Mr. Trump by less than two percentage points in the states that decided the election.
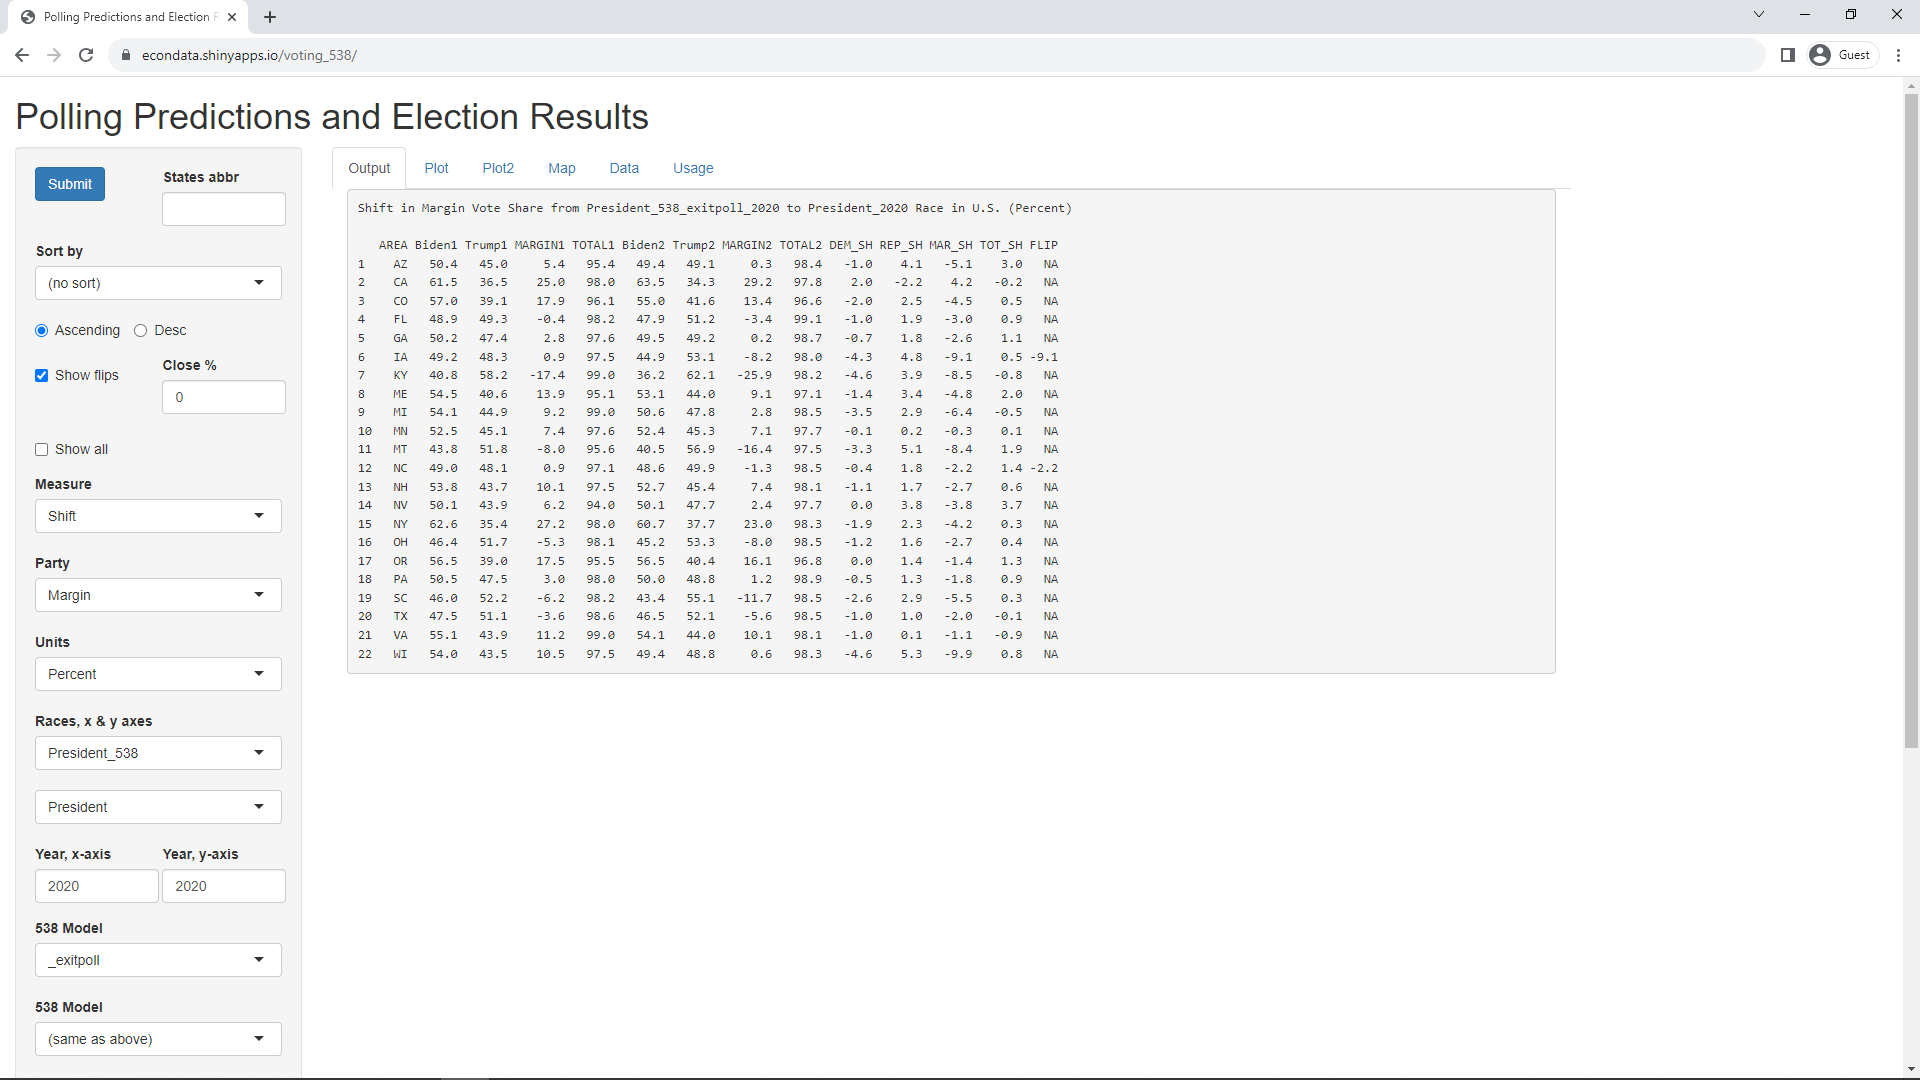
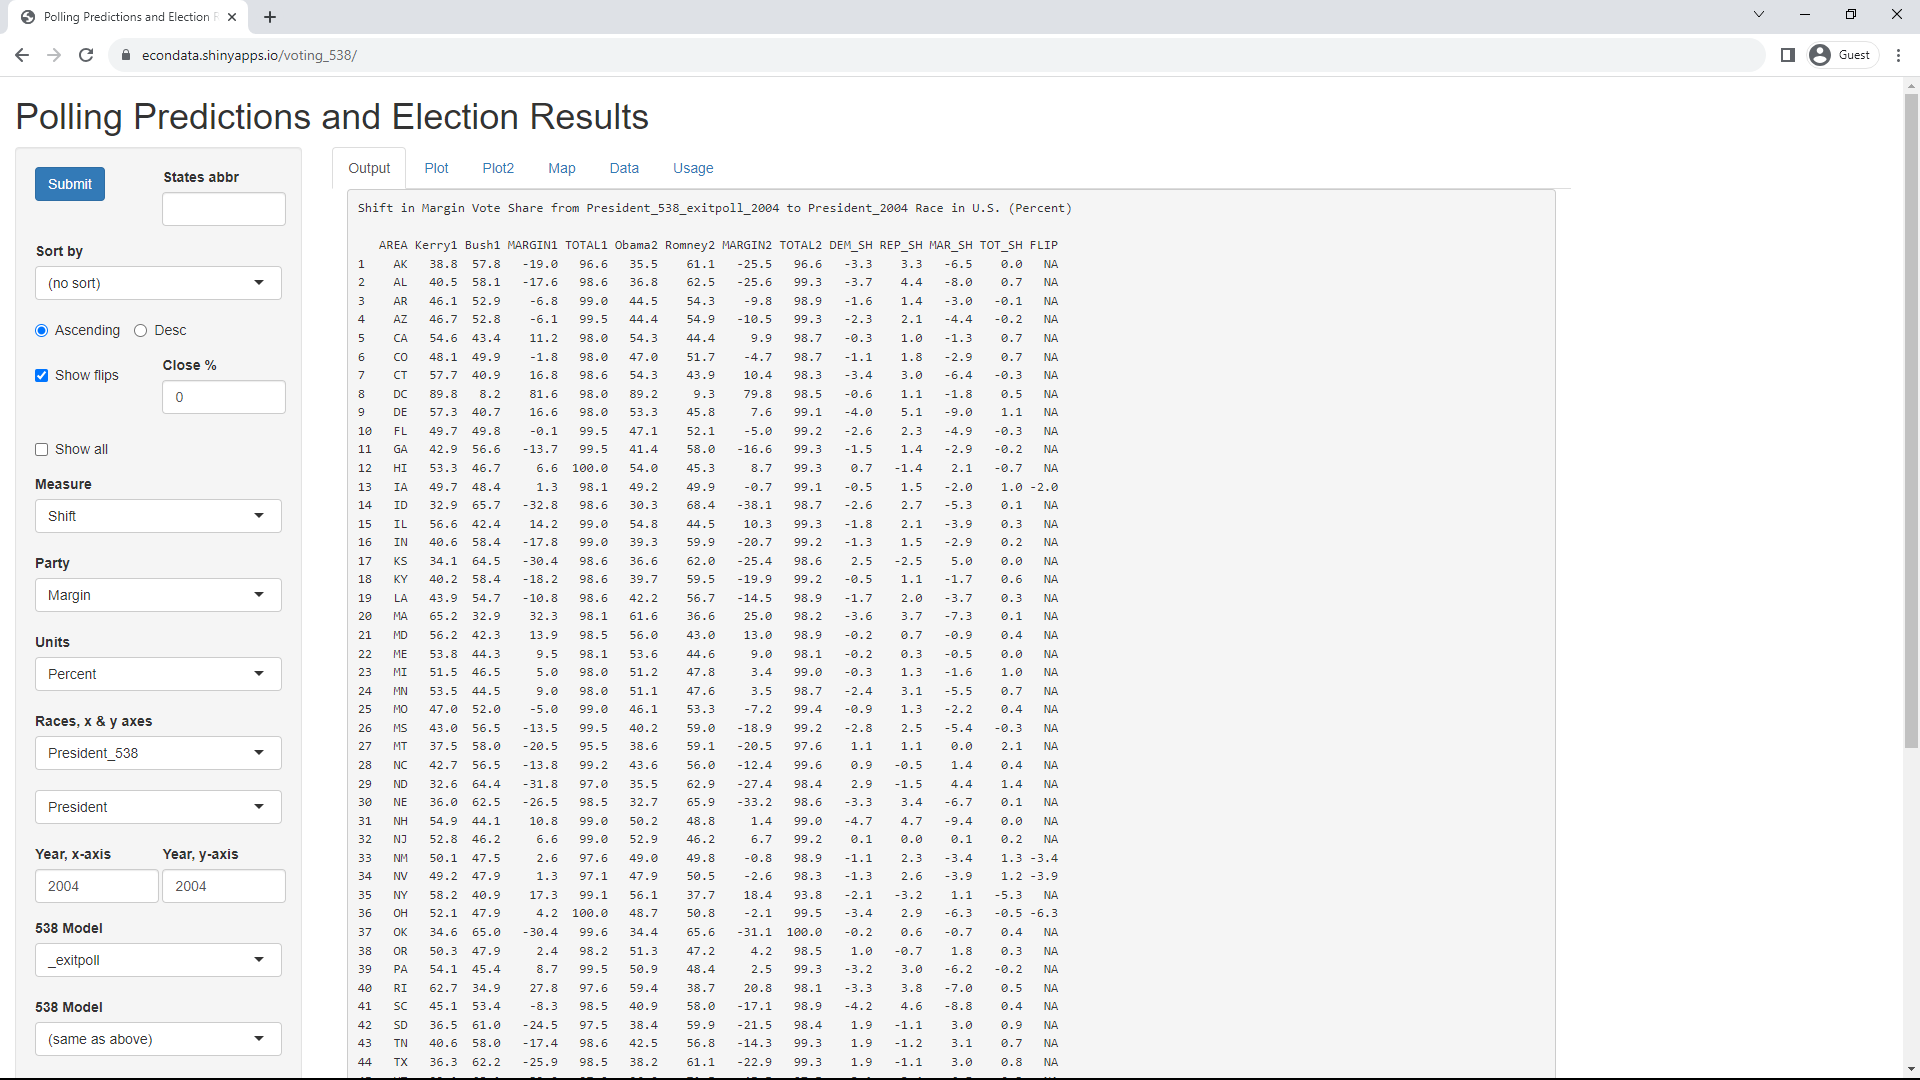
It is possible to check these numbers in the Shiny application at https://econdata.shinyapps.io/voting_538/. Going to that URL will display the following page:
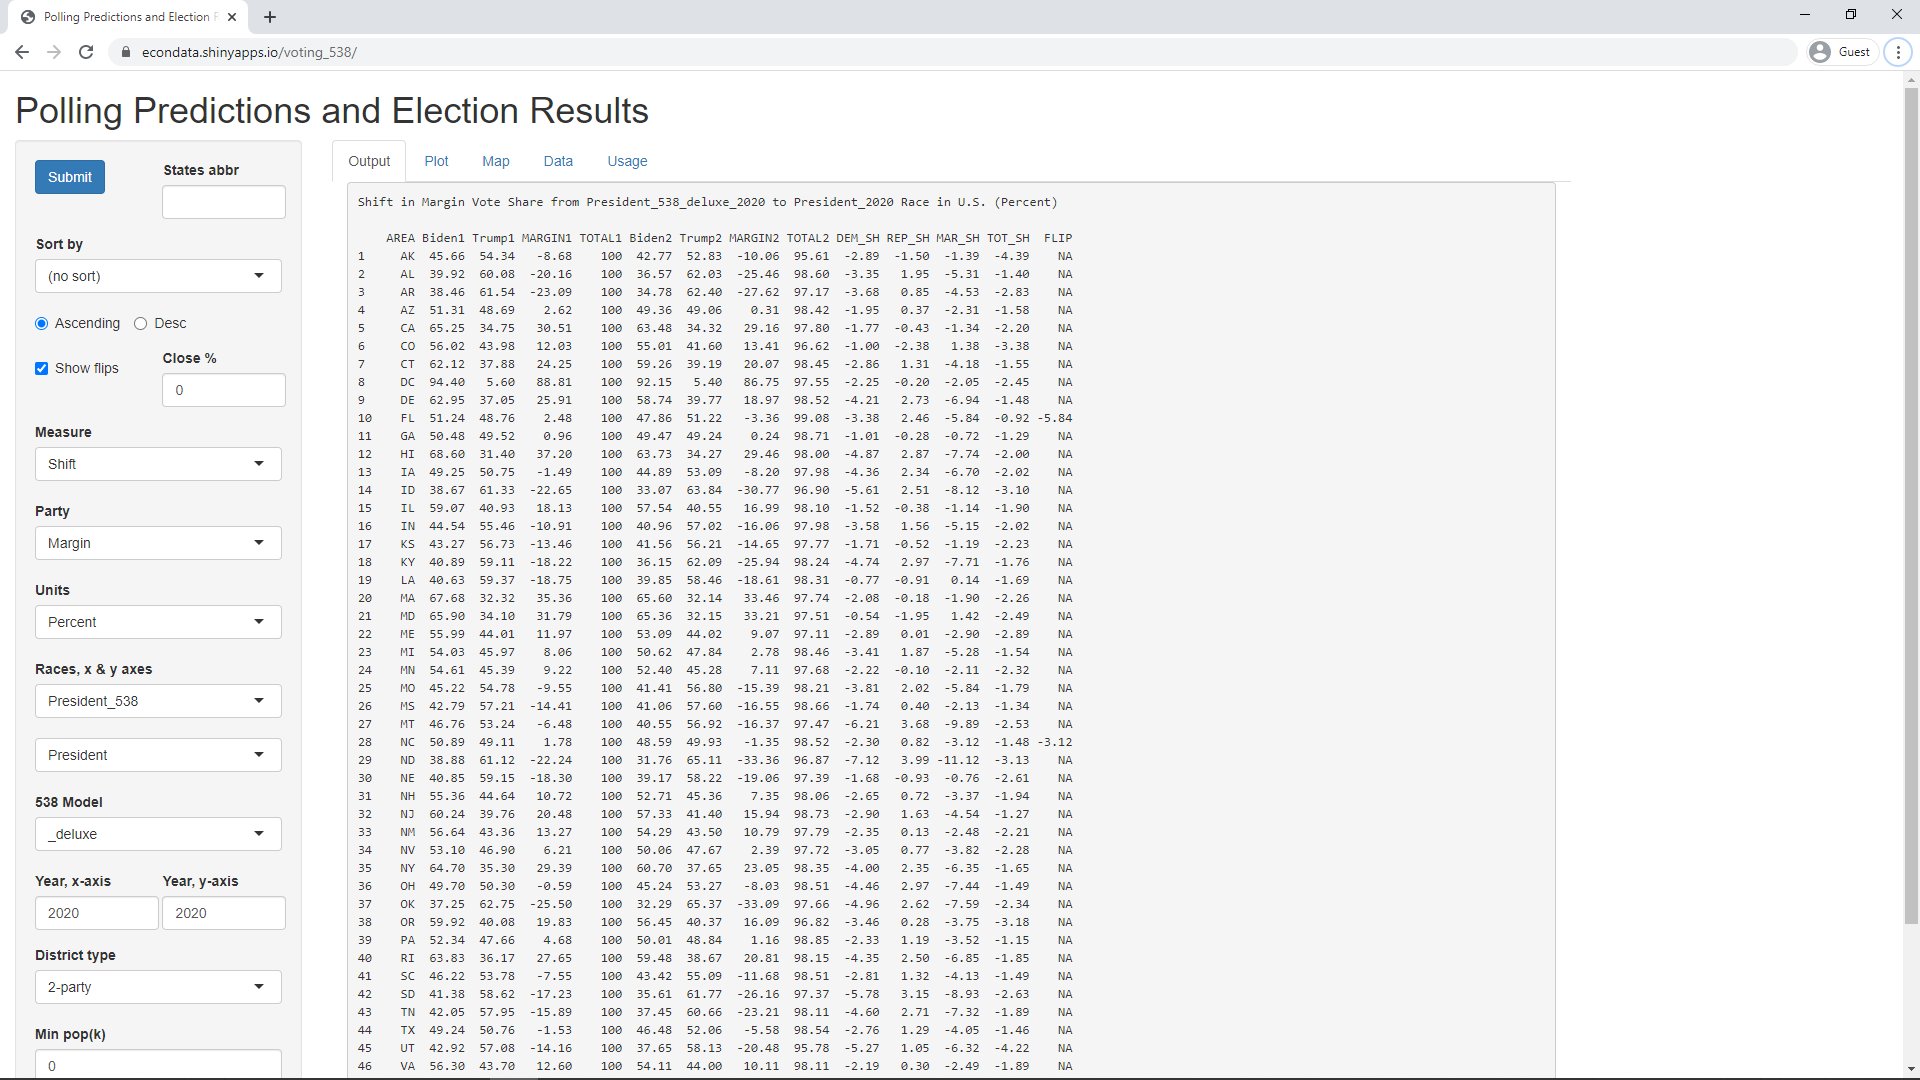
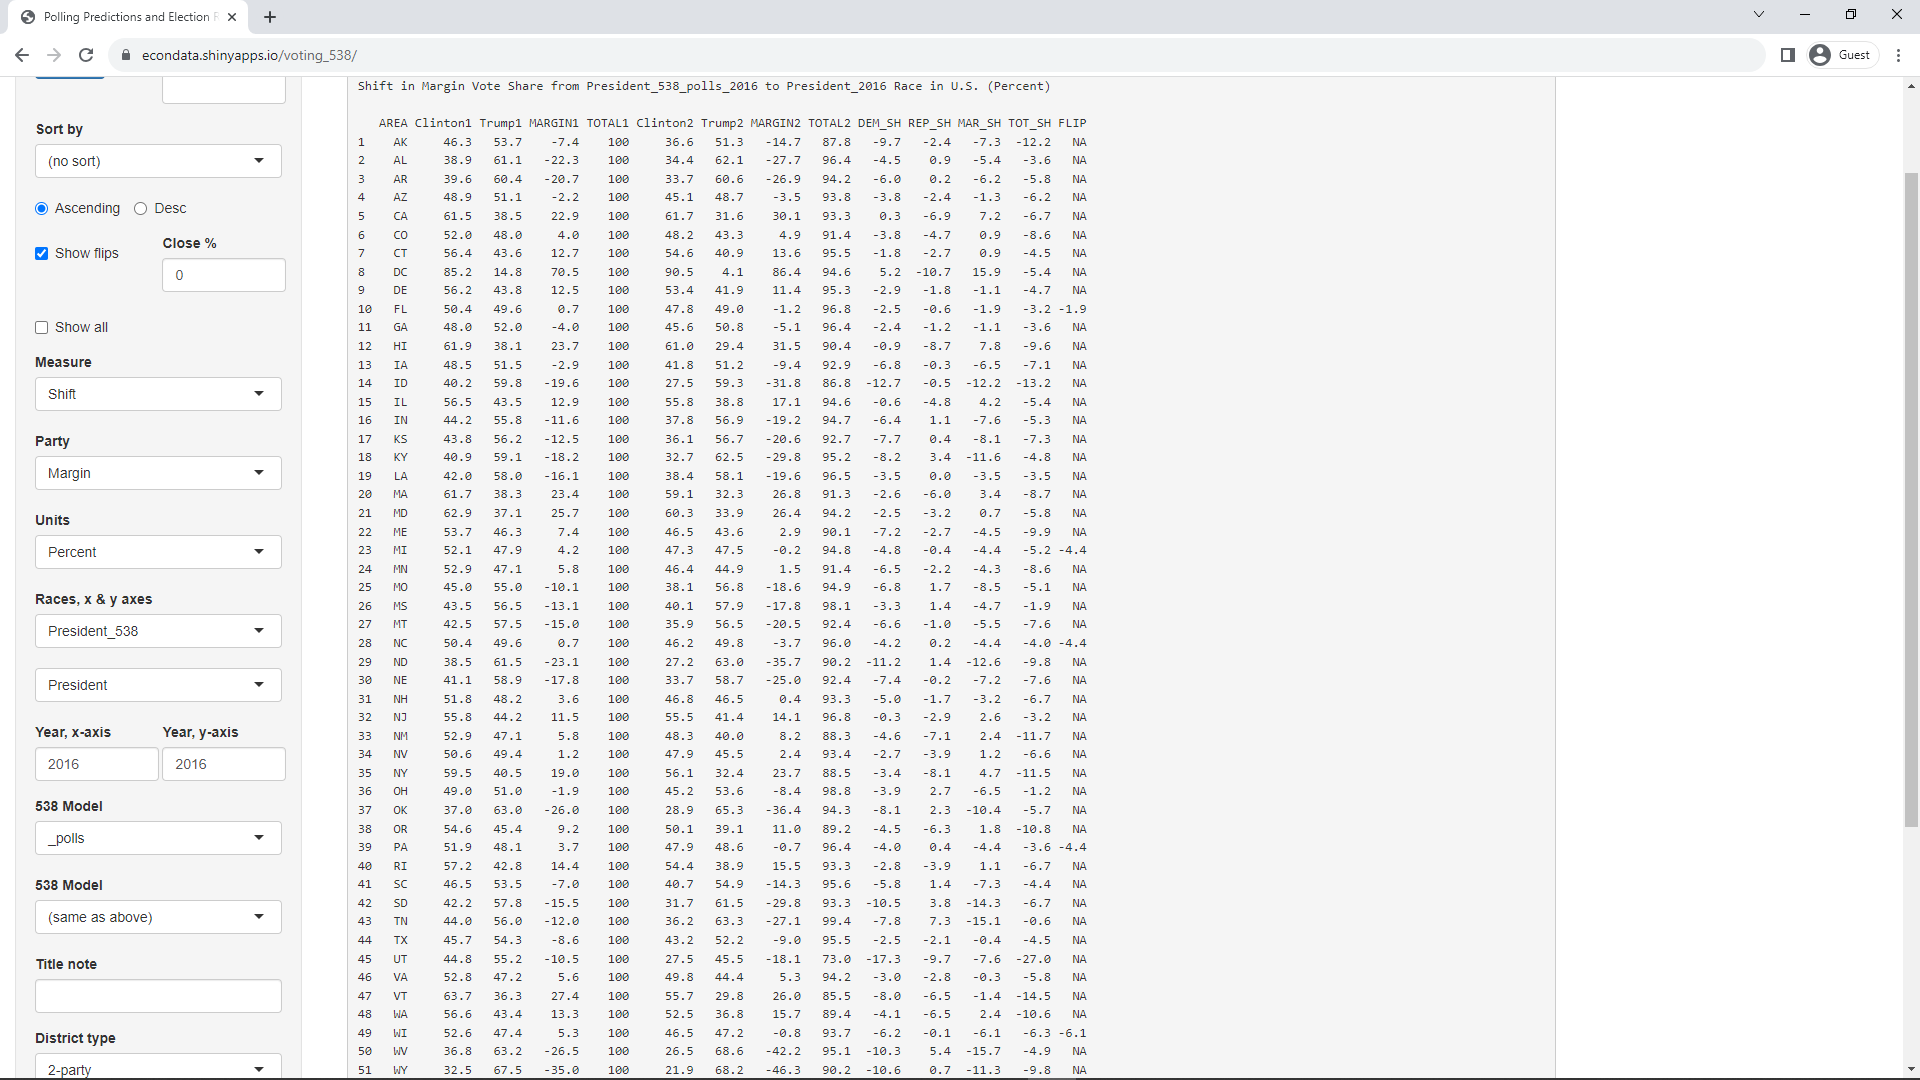
As can be seen, this page contains the following table:
Shift in Margin Vote Share from President_538_deluxe_2020 to President_2020 Race in U.S. (Percent)

    AREA Biden1 Trump1 MARGIN1 TOTAL1 Biden2 Trump2 MARGIN2 TOTAL2 DEM_SH REP_SH MAR_SH TOT_SH  FLIP
1     AK  45.66  54.34   -8.68    100  42.77  52.83  -10.06  95.61  -2.89  -1.50  -1.39  -4.39    NA
2     AL  39.92  60.08  -20.16    100  36.57  62.03  -25.46  98.60  -3.35   1.95  -5.31  -1.40    NA
3     AR  38.46  61.54  -23.09    100  34.78  62.40  -27.62  97.17  -3.68   0.85  -4.53  -2.83    NA
4     AZ  51.31  48.69    2.62    100  49.36  49.06    0.31  98.42  -1.95   0.37  -2.31  -1.58    NA
5     CA  65.25  34.75   30.51    100  63.48  34.32   29.16  97.80  -1.77  -0.43  -1.34  -2.20    NA
6     CO  56.02  43.98   12.03    100  55.01  41.60   13.41  96.62  -1.00  -2.38   1.38  -3.38    NA
7     CT  62.12  37.88   24.25    100  59.26  39.19   20.07  98.45  -2.86   1.31  -4.18  -1.55    NA
8     DC  94.40   5.60   88.81    100  92.15   5.40   86.75  97.55  -2.25  -0.20  -2.05  -2.45    NA
9     DE  62.95  37.05   25.91    100  58.74  39.77   18.97  98.52  -4.21   2.73  -6.94  -1.48    NA
10    FL  51.24  48.76    2.48    100  47.86  51.22   -3.36  99.08  -3.38   2.46  -5.84  -0.92 -5.84
11    GA  50.48  49.52    0.96    100  49.47  49.24    0.24  98.71  -1.01  -0.28  -0.72  -1.29    NA
12    HI  68.60  31.40   37.20    100  63.73  34.27   29.46  98.00  -4.87   2.87  -7.74  -2.00    NA
13    IA  49.25  50.75   -1.49    100  44.89  53.09   -8.20  97.98  -4.36   2.34  -6.70  -2.02    NA
14    ID  38.67  61.33  -22.65    100  33.07  63.84  -30.77  96.90  -5.61   2.51  -8.12  -3.10    NA
15    IL  59.07  40.93   18.13    100  57.54  40.55   16.99  98.10  -1.52  -0.38  -1.14  -1.90    NA
16    IN  44.54  55.46  -10.91    100  40.96  57.02  -16.06  97.98  -3.58   1.56  -5.15  -2.02    NA
17    KS  43.27  56.73  -13.46    100  41.56  56.21  -14.65  97.77  -1.71  -0.52  -1.19  -2.23    NA
18    KY  40.89  59.11  -18.22    100  36.15  62.09  -25.94  98.24  -4.74   2.97  -7.71  -1.76    NA
19    LA  40.63  59.37  -18.75    100  39.85  58.46  -18.61  98.31  -0.77  -0.91   0.14  -1.69    NA
20    MA  67.68  32.32   35.36    100  65.60  32.14   33.46  97.74  -2.08  -0.18  -1.90  -2.26    NA
21    MD  65.90  34.10   31.79    100  65.36  32.15   33.21  97.51  -0.54  -1.95   1.42  -2.49    NA
22    ME  55.99  44.01   11.97    100  53.09  44.02    9.07  97.11  -2.89   0.01  -2.90  -2.89    NA
23    MI  54.03  45.97    8.06    100  50.62  47.84    2.78  98.46  -3.41   1.87  -5.28  -1.54    NA
24    MN  54.61  45.39    9.22    100  52.40  45.28    7.11  97.68  -2.22  -0.10  -2.11  -2.32    NA
25    MO  45.22  54.78   -9.55    100  41.41  56.80  -15.39  98.21  -3.81   2.02  -5.84  -1.79    NA
26    MS  42.79  57.21  -14.41    100  41.06  57.60  -16.55  98.66  -1.74   0.40  -2.13  -1.34    NA
27    MT  46.76  53.24   -6.48    100  40.55  56.92  -16.37  97.47  -6.21   3.68  -9.89  -2.53    NA
28    NC  50.89  49.11    1.78    100  48.59  49.93   -1.35  98.52  -2.30   0.82  -3.12  -1.48 -3.12
29    ND  38.88  61.12  -22.24    100  31.76  65.11  -33.36  96.87  -7.12   3.99 -11.12  -3.13    NA
30    NE  40.85  59.15  -18.30    100  39.17  58.22  -19.06  97.39  -1.68  -0.93  -0.76  -2.61    NA
31    NH  55.36  44.64   10.72    100  52.71  45.36    7.35  98.06  -2.65   0.72  -3.37  -1.94    NA
32    NJ  60.24  39.76   20.48    100  57.33  41.40   15.94  98.73  -2.90   1.63  -4.54  -1.27    NA
33    NM  56.64  43.36   13.27    100  54.29  43.50   10.79  97.79  -2.35   0.13  -2.48  -2.21    NA
34    NV  53.10  46.90    6.21    100  50.06  47.67    2.39  97.72  -3.05   0.77  -3.82  -2.28    NA
35    NY  64.70  35.30   29.39    100  60.70  37.65   23.05  98.35  -4.00   2.35  -6.35  -1.65    NA
36    OH  49.70  50.30   -0.59    100  45.24  53.27   -8.03  98.51  -4.46   2.97  -7.44  -1.49    NA
37    OK  37.25  62.75  -25.50    100  32.29  65.37  -33.09  97.66  -4.96   2.62  -7.59  -2.34    NA
38    OR  59.92  40.08   19.83    100  56.45  40.37   16.09  96.82  -3.46   0.28  -3.75  -3.18    NA
39    PA  52.34  47.66    4.68    100  50.01  48.84    1.16  98.85  -2.33   1.19  -3.52  -1.15    NA
40    RI  63.83  36.17   27.65    100  59.48  38.67   20.81  98.15  -4.35   2.50  -6.85  -1.85    NA
41    SC  46.22  53.78   -7.55    100  43.42  55.09  -11.68  98.51  -2.81   1.32  -4.13  -1.49    NA
42    SD  41.38  58.62  -17.23    100  35.61  61.77  -26.16  97.37  -5.78   3.15  -8.93  -2.63    NA
43    TN  42.05  57.95  -15.89    100  37.45  60.66  -23.21  98.11  -4.60   2.71  -7.32  -1.89    NA
44    TX  49.24  50.76   -1.53    100  46.48  52.06   -5.58  98.54  -2.76   1.29  -4.05  -1.46    NA
45    UT  42.92  57.08  -14.16    100  37.65  58.13  -20.48  95.78  -5.27   1.05  -6.32  -4.22    NA
46    VA  56.30  43.70   12.60    100  54.11  44.00   10.11  98.11  -2.19   0.30  -2.49  -1.89    NA
47    VT  69.80  30.20   39.59    100  66.09  30.67   35.41  96.76  -3.71   0.47  -4.18  -3.24    NA
48    WA  62.15  37.85   24.31    100  57.97  38.77   19.20  96.74  -4.18   0.92  -5.10  -3.26    NA
49    WI  54.19  45.81    8.39    100  49.45  48.82    0.63  98.27  -4.75   3.02  -7.76  -1.73    NA
50    WV  34.37  65.63  -31.26    100  29.70  68.63  -38.94  98.33  -4.67   3.00  -7.68  -1.67    NA
51    WY  32.06  67.94  -35.87    100  26.55  69.94  -43.38  96.49  -5.51   2.00  -7.51  -3.51    NA
52 TOTAL  54.05  45.95    8.10    100  51.30  46.84    4.45  98.14  -2.76   0.90  -3.65  -1.86    NA

Source: 538 data: Model outputs - Click "Model outputs" (after "Download the data") to download
        election-forecasts-2020.zip, unzip, use file presidential_state_toplines_2020.csv
        Actual data: U.S. President 1976-2020 - download 1976-2020-president.tab
The first column contains the two-letter state abbreviation for each state plus DC (District of Columbia). This can be changed to the full name by checking the "Show full state" checkbox at the bottom of the leftmost panel. The next two columns give the percentage of the total vote for the primary Democratic and Republican candidates in the first race (specified by the first race selected under the "Races, x & y axes" label). The next column, MARGIN1, is the Democratic percentage minus the Republican percentage and the next column, TOTAL1, is the sum of the two percentages.
The next four columns are the same items as the last four except that they are for the second race (specified by the second race selected under the "Races, x & y axes" label). The next four columns are the "shifts" between the two prior groups of four columns and is obtained by subtracting each of the first four columns from the corresponding column in the second four columns. Hence, the first value of -1.39 for MAR_SH (short for "Margin Shift") is equal to the first MARGIN2 value of -10.06 minus the first MARGIN1 value of -8.68 (with roundoff error).
Finally, FLIP indicates any states for which the margin shift caused a prediction for a win by one party to be followed by an actual win by the other party. As can be seen, this happened in Florida and North Carolina in the 2020 presidential election. Florida was predicted to favor Democrats by 2.48 percent but ended up favoring Republicans by 3.36 percent, a swing of 5.84 percent. Likewise, North Carolina was predicted to favor Democrats by 1.78 percent but ended up favoring Republicans by 1.35 percent, a swing of about 3.12 percent.
Changing the "Units" select list on the far left panel from "Percent" to "Count" will cause the following actual vote counts to display:
Shift in Margin Votes from President_538_deluxe_2020 to President_2020 Race in U.S. (Count)

    AREA        Biden1        Trump1       MARGIN1        TOTAL1     Biden2     Trump2   MARGIN2      TOTAL2        DEM_SH       REP_SH        MAR_SH       TOT_SH       FLIP
1     AK    153,961.93    183,214.12    -29,252.19     337,176.0    153,778    189,951   -36,173     359,530       -183.93     6,736.88     -6,920.81    22,353.95         NA
2     AL    925,822.79  1,393,241.01   -467,418.22   2,319,063.8    849,624  1,441,170  -591,546   2,323,282    -76,198.79    47,928.99   -124,127.78     4,218.20         NA
3     AR    467,146.34    747,636.64   -280,490.30   1,214,783.0    423,932    760,647  -336,715   1,219,069    -43,214.34    13,010.36    -56,224.70     4,286.02         NA
4     AZ  1,575,306.27  1,494,843.50     80,462.77   3,070,149.8  1,672,143  1,661,686    10,457   3,387,326     96,836.73   166,842.50    -70,005.77   317,176.23         NA
5     CA 10,109,819.67  5,383,361.36  4,726,458.31  15,493,181.0 11,110,250  6,006,429 5,103,821  17,500,881  1,000,430.33   623,067.64    377,362.69 2,007,699.97         NA
6     CO  1,869,982.42  1,468,335.29    401,647.13   3,338,317.7  1,804,352  1,364,607   439,745   3,279,980    -65,630.42  -103,728.29     38,097.87   -58,337.71         NA
7     CT  1,104,464.84    673,365.07    431,099.77   1,777,829.9  1,080,831    714,717   366,114   1,823,857    -23,633.84    41,351.93    -64,985.77    46,027.09         NA
8     DC    308,940.28     18,314.99    290,625.30     327,255.3    317,323     18,586   298,737     344,356      8,382.72       271.01      8,111.70    17,100.73         NA
9     DE    310,993.31    183,002.60    127,990.71     493,995.9    296,268    200,603    95,665     504,346    -14,725.31    17,600.40    -32,325.71    10,350.09         NA
10    FL  5,706,729.02  5,430,299.33    276,429.68  11,137,028.3  5,297,045  5,668,731  -371,686  11,067,456   -409,684.02   238,431.67   -648,115.68   -69,572.35 -648,115.7
11    GA  2,451,711.09  2,405,115.57     46,595.52   4,856,826.7  2,473,633  2,461,854    11,779   4,999,960     21,921.91    56,738.43    -34,816.52   143,133.34         NA
12    HI    408,667.22    187,037.96    221,629.26     595,705.2    366,130    196,864   169,266     574,469    -42,537.22     9,826.04    -52,363.26   -21,236.18         NA
13    IA    824,718.60    849,731.23    -25,012.63   1,674,449.8    759,061    897,672  -138,611   1,690,871    -65,657.60    47,940.77   -113,598.37    16,421.17         NA
14    ID    306,017.77    485,251.66   -179,233.89     791,269.4    287,021    554,119  -267,098     868,014    -18,996.77    68,867.34    -87,864.11    76,744.57         NA
15    IL  3,604,922.04  2,498,242.16  1,106,679.88   6,103,164.2  3,471,915  2,446,891 1,025,024   6,033,743   -133,007.04   -51,351.16    -81,655.88   -69,421.20         NA
16    IN  1,360,371.39  1,693,642.35   -333,270.95   3,054,013.7  1,242,416  1,729,519  -487,103   3,033,118   -117,955.39    35,876.65   -153,832.05   -20,895.74         NA
17    KS    560,201.82    734,510.20   -174,308.38   1,294,712.0    570,323    771,406  -201,083   1,372,303     10,121.18    36,895.80    -26,774.62    77,590.97         NA
18    KY    848,258.45  1,226,349.55   -378,091.10   2,074,608.0    772,474  1,326,646  -554,172   2,136,768    -75,784.45   100,296.45   -176,080.90    62,160.00         NA
19    LA    871,217.93  1,273,242.58   -402,024.65   2,144,460.5    856,034  1,255,776  -399,742   2,148,062    -15,183.93   -17,466.58      2,282.65     3,601.49         NA
20    MA  2,438,704.10  1,164,702.31  1,274,001.79   3,603,406.4  2,382,202  1,167,202 1,215,000   3,631,402    -56,502.10     2,499.69    -59,001.79    27,995.59         NA
21    MD  2,009,000.69  1,039,702.97    969,297.73   3,048,703.7  1,985,023    976,414 1,008,609   3,037,030    -23,977.69   -63,288.97     39,311.27   -11,673.66         NA
22    ME    457,647.05    359,798.48     97,848.58     817,445.5    435,072    360,737    74,335     819,461    -22,575.05       938.52    -23,513.58     2,015.47         NA
23    MI  2,946,813.48  2,506,999.41    439,814.07   5,453,812.9  2,804,040  2,649,852   154,188   5,539,302   -142,773.48   142,852.59   -285,626.07    85,489.11         NA
24    MN  1,792,024.16  1,489,362.73    302,661.43   3,281,386.9  1,717,077  1,484,065   233,012   3,277,171    -74,947.16    -5,297.73    -69,649.43    -4,215.89         NA
25    MO  1,380,852.11  1,672,557.91   -291,705.80   3,053,410.0  1,253,014  1,718,736  -465,722   3,025,962   -127,838.11    46,178.09   -174,016.20   -27,448.02         NA
26    MS    561,581.40    750,739.46   -189,158.06   1,312,320.9    539,398    756,764  -217,366   1,313,759    -22,183.40     6,024.54    -28,207.94     1,438.13         NA
27    MT    303,413.14    345,436.39    -42,023.25     648,849.5    244,786    343,602   -98,816     603,674    -58,627.14    -1,834.39    -56,792.75   -45,175.54         NA
28    NC  2,873,954.00  2,773,687.70    100,266.30   5,647,641.7  2,684,292  2,758,773   -74,481   5,524,802   -189,662.00   -14,914.70   -174,747.30  -122,839.70 -174,747.3
29    ND    139,352.53    219,066.16    -79,713.63     358,418.7    114,902    235,595  -120,693     361,819    -24,450.53    16,528.84    -40,979.37     3,400.31         NA
30    NE    375,959.12    544,375.35   -168,416.22     920,334.5    374,583    556,846  -182,263     956,383     -1,376.12    12,470.65    -13,846.78    36,048.53         NA
31    NH    462,143.34    372,626.34     89,516.99     834,769.7    424,921    365,654    59,267     806,182    -37,222.34    -6,972.34    -30,249.99   -28,587.68         NA
32    NJ  2,620,104.72  1,729,468.71    890,636.02   4,349,573.4  2,608,335  1,883,274   725,061   4,549,353    -11,769.72   153,805.29   -165,575.02   199,779.57         NA
33    NM    543,929.26    416,458.33    127,470.94     960,387.6    501,614    401,894    99,720     923,965    -42,315.26   -14,564.33    -27,750.94   -36,422.59         NA
34    NV    712,356.72    629,099.12     83,257.60   1,341,455.8    703,486    669,890    33,596   1,405,376     -8,870.72    40,790.88    -49,661.60    63,920.17         NA
35    NY  5,413,839.24  2,954,103.26  2,459,735.98   8,367,942.5  5,230,985  3,244,798 1,986,187   8,618,194   -182,854.24   290,694.74   -473,548.98   250,251.50         NA
36    OH  3,038,526.57  3,074,854.21    -36,327.64   6,113,380.8  2,679,165  3,154,834  -475,669   5,922,202   -359,361.57    79,979.79   -439,341.36  -191,178.78         NA
37    OK    588,960.33    992,097.74   -403,137.42   1,581,058.1    503,890  1,020,280  -516,390   1,560,699    -85,070.33    28,182.26   -113,252.58   -20,359.07         NA
38    OR  1,445,733.05    967,172.49    478,560.56   2,412,905.5  1,340,383    958,448   381,935   2,374,321   -105,350.05    -8,724.49    -96,625.56   -38,584.54         NA
39    PA  3,555,660.50  3,237,438.38    318,222.12   6,793,098.9  3,458,229  3,377,674    80,555   6,915,283    -97,431.50   140,235.62   -237,667.12   122,184.12         NA
40    RI    322,349.38    182,691.61    139,657.77     505,041.0    307,486    199,922   107,564     516,990    -14,863.38    17,230.39    -32,093.77    11,949.01         NA
41    SC  1,102,926.19  1,283,079.25   -180,153.06   2,386,005.5  1,091,541  1,385,103  -293,562   2,514,096    -11,385.19   102,023.75   -113,408.94   128,090.55         NA
42    SD    168,134.99    238,138.81    -70,003.82     406,273.8    150,471    261,043  -110,572     422,609    -17,663.99    22,904.19    -40,568.18    16,335.20         NA
43    TN  1,184,835.93  1,632,609.79   -447,773.86   2,817,445.7  1,143,711  1,852,475  -708,764   3,053,851    -41,124.93   219,865.21   -260,990.14   236,405.29         NA
44    TX  5,926,574.22  6,110,641.09   -184,066.87  12,037,215.3  5,259,126  5,890,347  -631,221  11,315,056   -667,448.22  -220,294.09   -447,154.13  -722,159.32         NA
45    UT    565,167.53    751,678.17   -186,510.63   1,316,845.7    560,282    865,140  -304,858   1,488,289     -4,885.53   113,461.83   -118,347.37   171,443.30         NA
46    VA  2,565,601.16  1,991,288.32    574,312.84   4,556,889.5  2,413,568  1,962,430   451,138   4,460,524   -152,033.16   -28,858.32   -123,174.84   -96,365.48         NA
47    VT    232,502.88    100,610.44    131,892.44     333,113.3    242,820    112,704   130,116     367,428     10,317.12    12,093.56     -1,776.44    34,314.68         NA
48    WA  2,691,896.80  1,639,215.60  1,052,681.20   4,331,112.4  2,369,612  1,584,651   784,961   4,087,631   -322,284.80   -54,564.60   -267,720.20  -243,481.40         NA
49    WI  1,785,555.35  1,509,154.51    276,400.84   3,294,709.9  1,630,866  1,610,184    20,682   3,298,041   -154,689.35   101,029.49   -255,718.84     3,331.14         NA
50    WV    253,151.99    483,394.08   -230,242.08     736,546.1    235,984    545,382  -309,398     794,652    -17,167.99    61,987.92    -79,155.92    58,105.93         NA
51    WY     85,266.95    180,652.92    -95,385.97     265,919.9     73,491    193,559  -120,068     276,765    -11,775.95    12,906.08    -24,682.03    10,845.14         NA
52 TOTAL 84,313,772.11 71,671,639.20 12,642,132.91 155,985,411.3 81,268,908 74,216,146 7,052,762 158,429,663 -3,044,864.11 2,544,506.80 -5,589,370.91 2,444,251.68         NA

Source: 538 data: Model outputs - Click "Model outputs" (after "Download the data") to download
        election-forecasts-2020.zip, unzip, use file presidential_state_toplines_2020.csv
        Actual data: U.S. President 1976-2020 - download 1976-2020-president.tab
Getting a Plot of the Shift via the Plot Tab
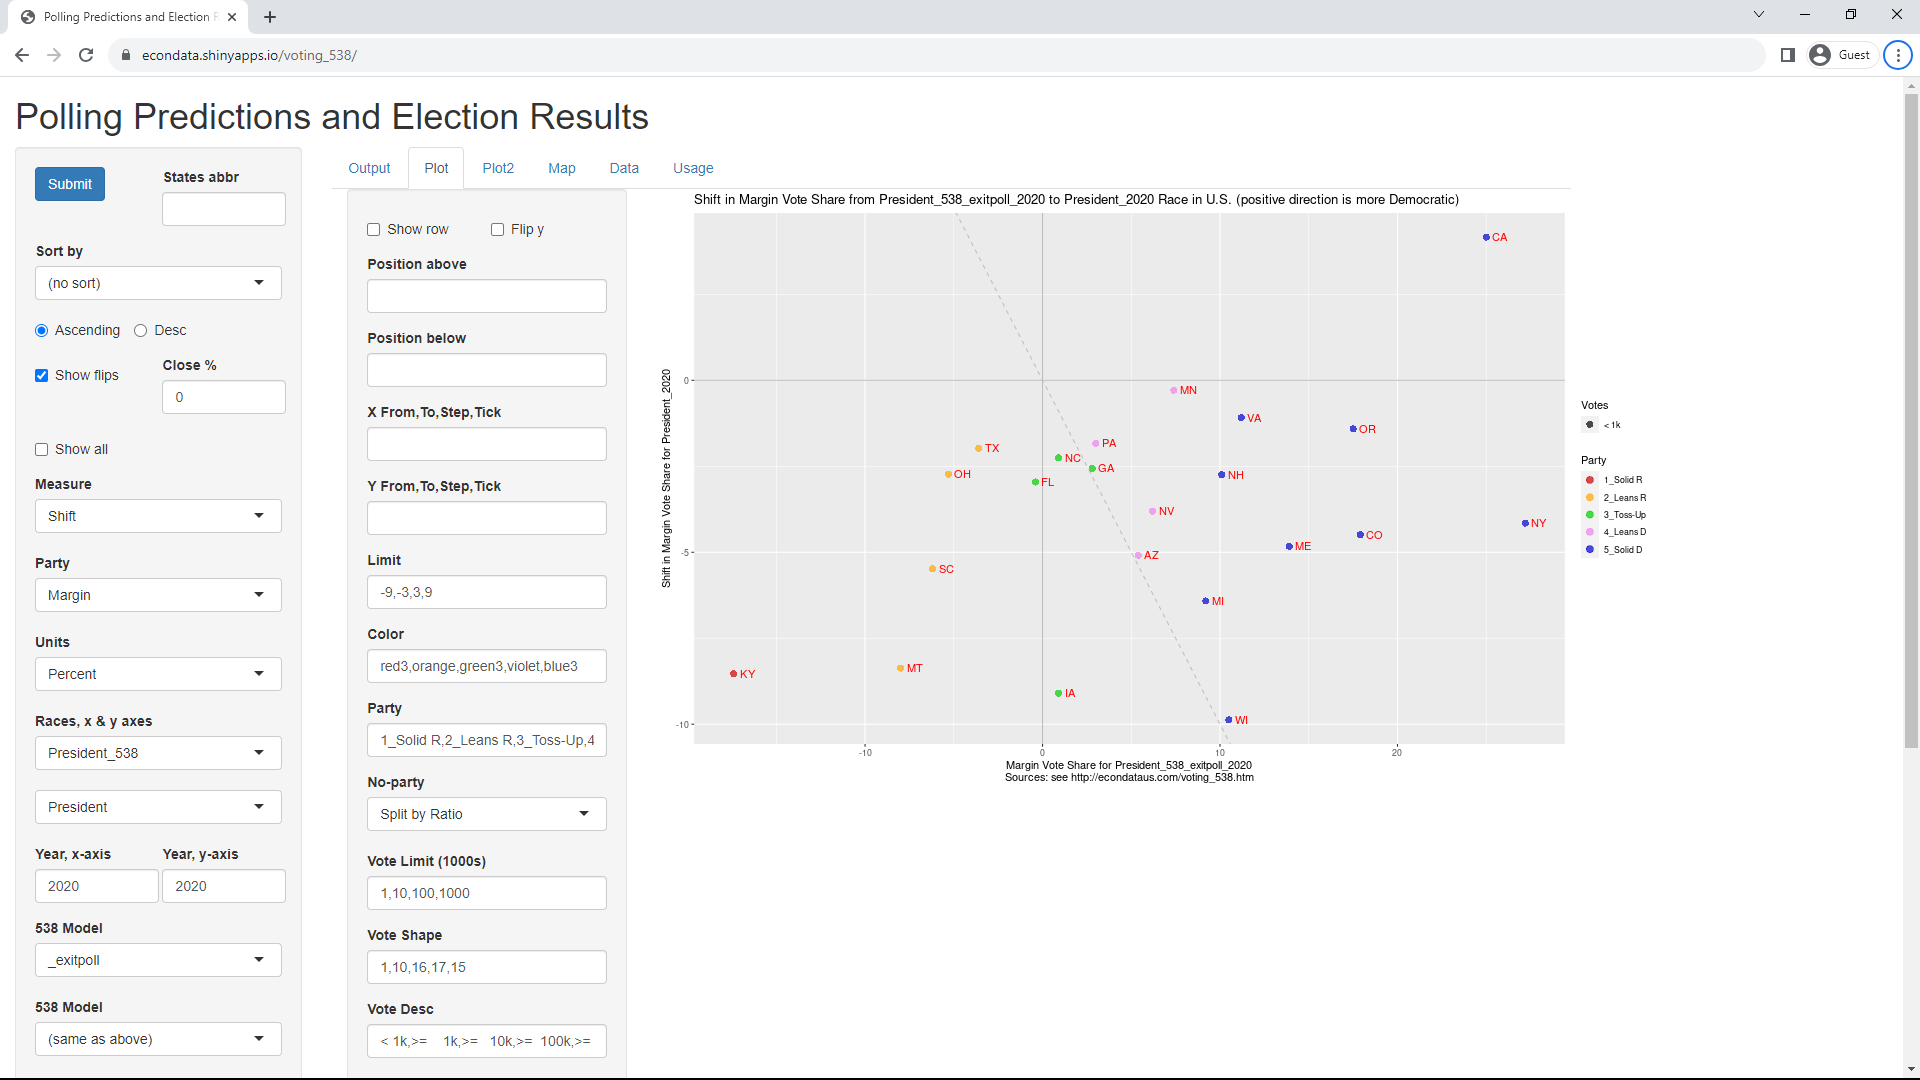
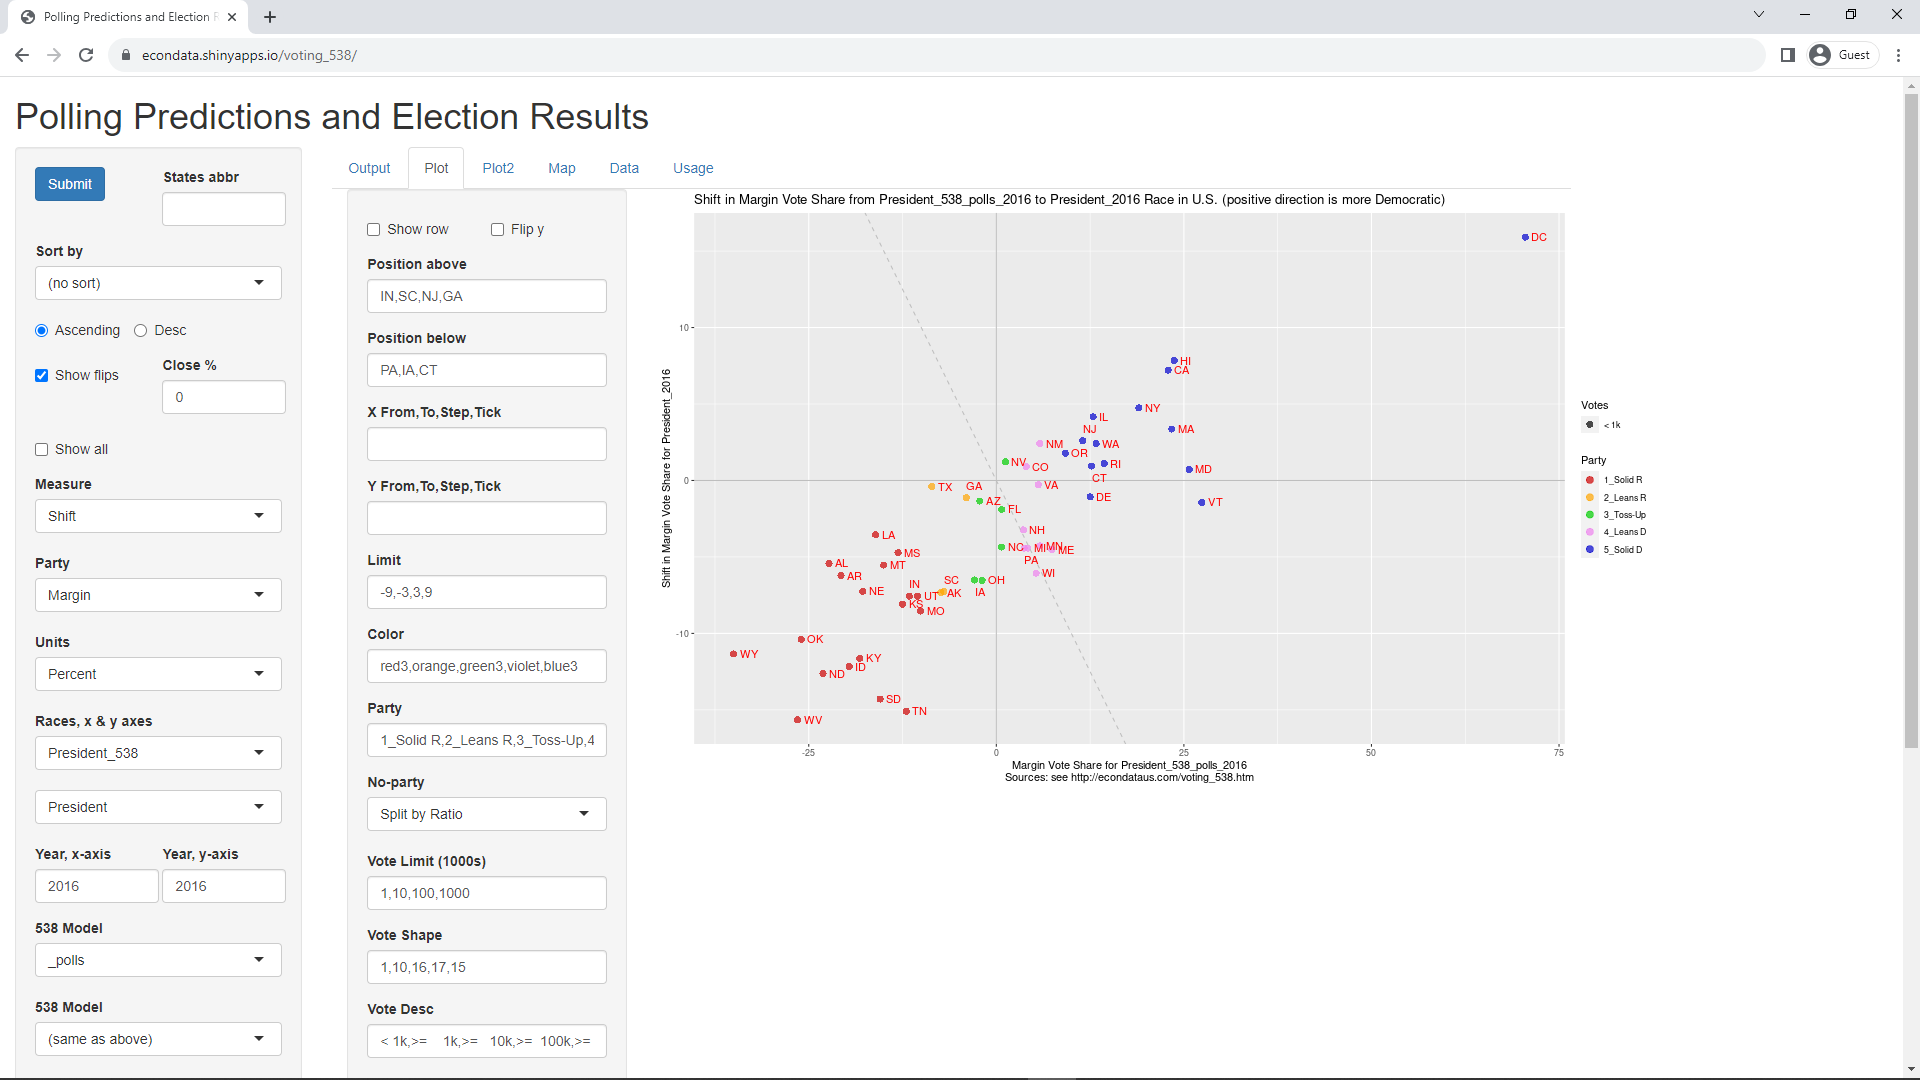
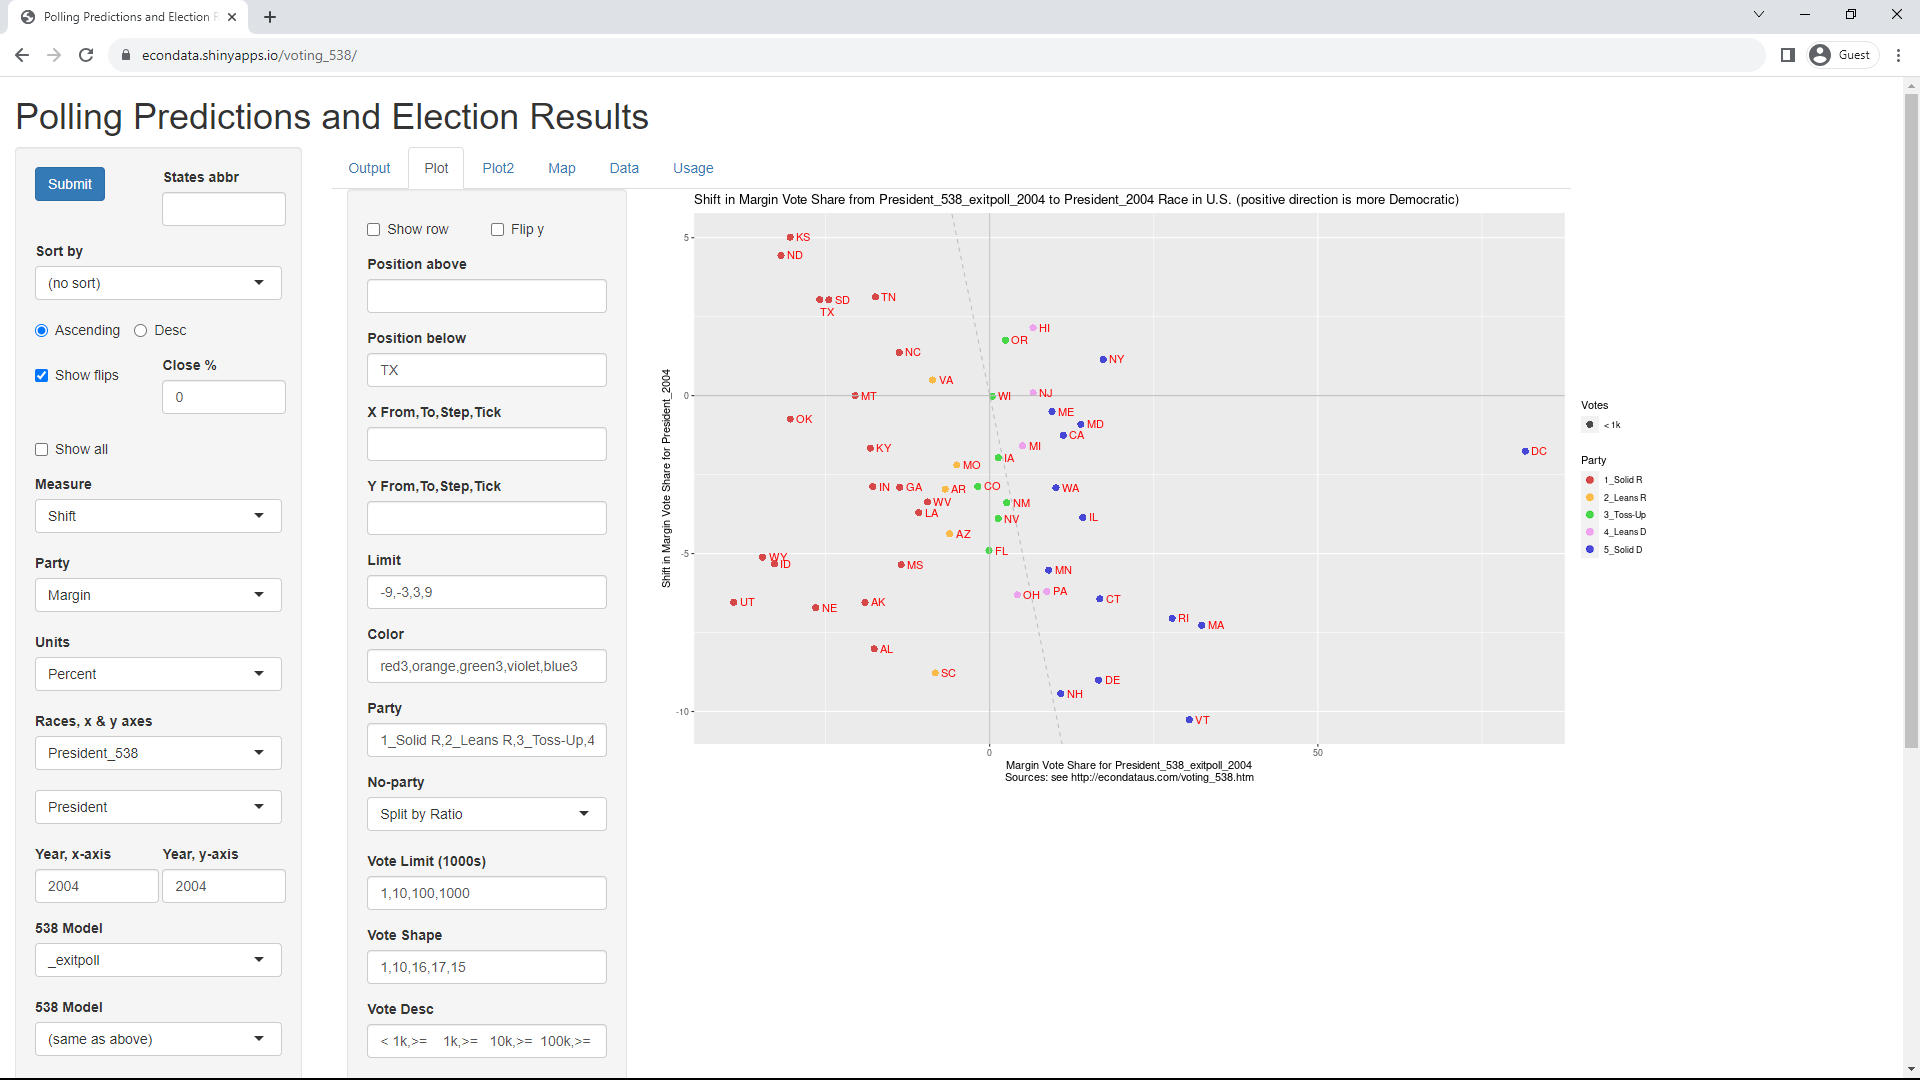
Changing the Units select list back to "Percent" and clicking on the Plot tab will display the following page:
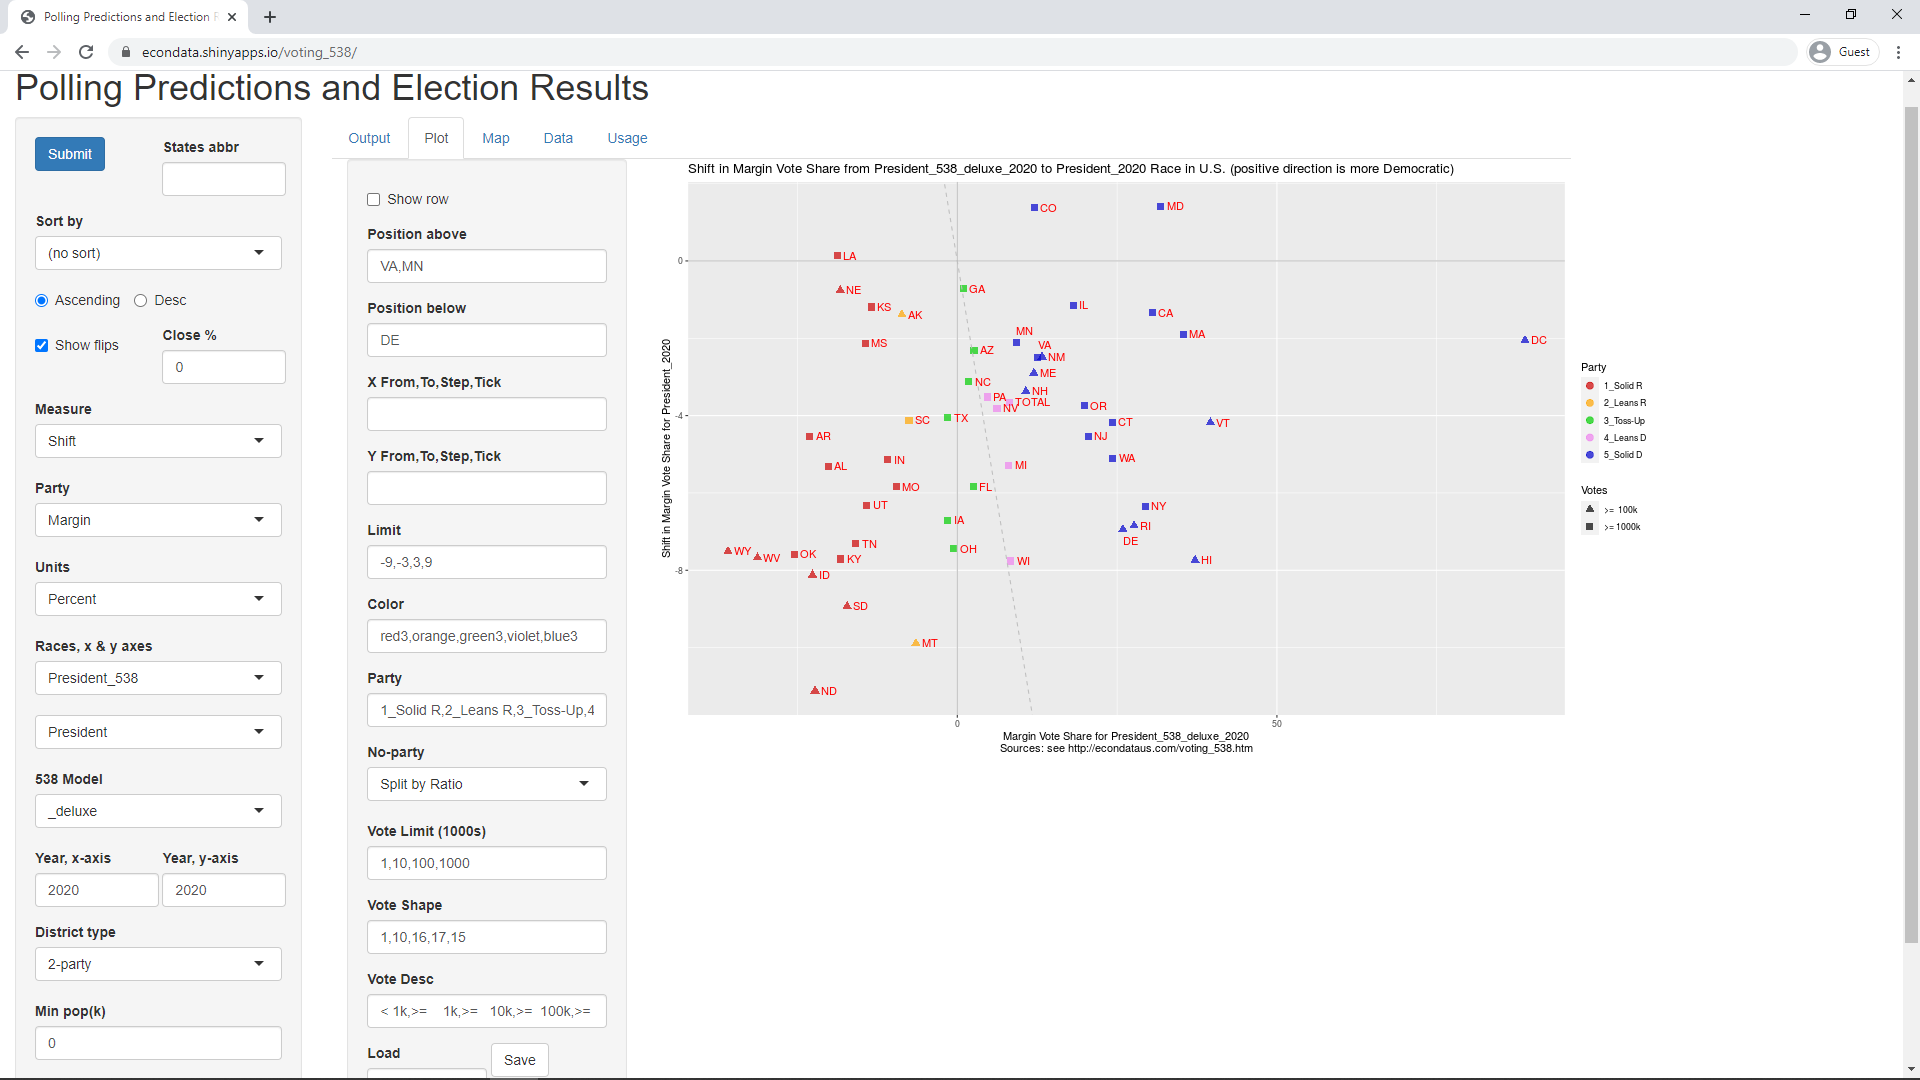
In the above plot, the x-coordinate of each point is equal to its margin in the first race. The y-coordinate is equal to its margin in the second race MINUS its margin in the first race. Hence, the y-coordinate is the SHIFT in the margin from the first to the second race. On both axes, the positive direction is defined to be more Democratic. Hence, the plot shows that only the margins of three states, Colorado, Louisiana, and Maryland, became more Democratic in the final results. All of the rest became more Republican. This shift to the right has been called the "red shift" as described here.
The dashed line has special significance. It is the line representing y = -x. As stated above, x is equal to Margin1 and y is equal to (Margin2 - Margin1). Taking M to be Margin, the dashed line represents (M2 - M1) = -M1. Adding M1 to both sides gives M2 = 0. Hence, the dashed line basically represents the y-axis of the second race. This means that the points between the solid y-axis and the dashed y-axis are points that, being left of one axis and right of the other, switched sides or "flipped" because of the shift. As expected, these include Florida (FL) and North Carolina (NC). Georgia (GA), Arizona (AZ), and Wisconsin (WI) can be seen to have almost flipped due to the shift and Iowa (IA), Ohio (OH), and Texas (TX) can be seen to have been predicted to be close but were not due to the red shift.
One other item of note for this plot is that the "Position above" and "Position below" fields have been set to "VA,MN" and "DE", respectively. This simply causes those labels to begin above or below the actual points so as to avoid overlapping with other labels. These two-letter state abbreviations must be used regardless of whether or not the full state names are being displayed. All of the settings in this second-from-the-left panel can be saved by clicking on the Save button at the bottom of that panel. The settings will be saved as the next free version number so that no settings are overwritten. Hence, the only way currently to edit or delete prior settings are to edit the files.
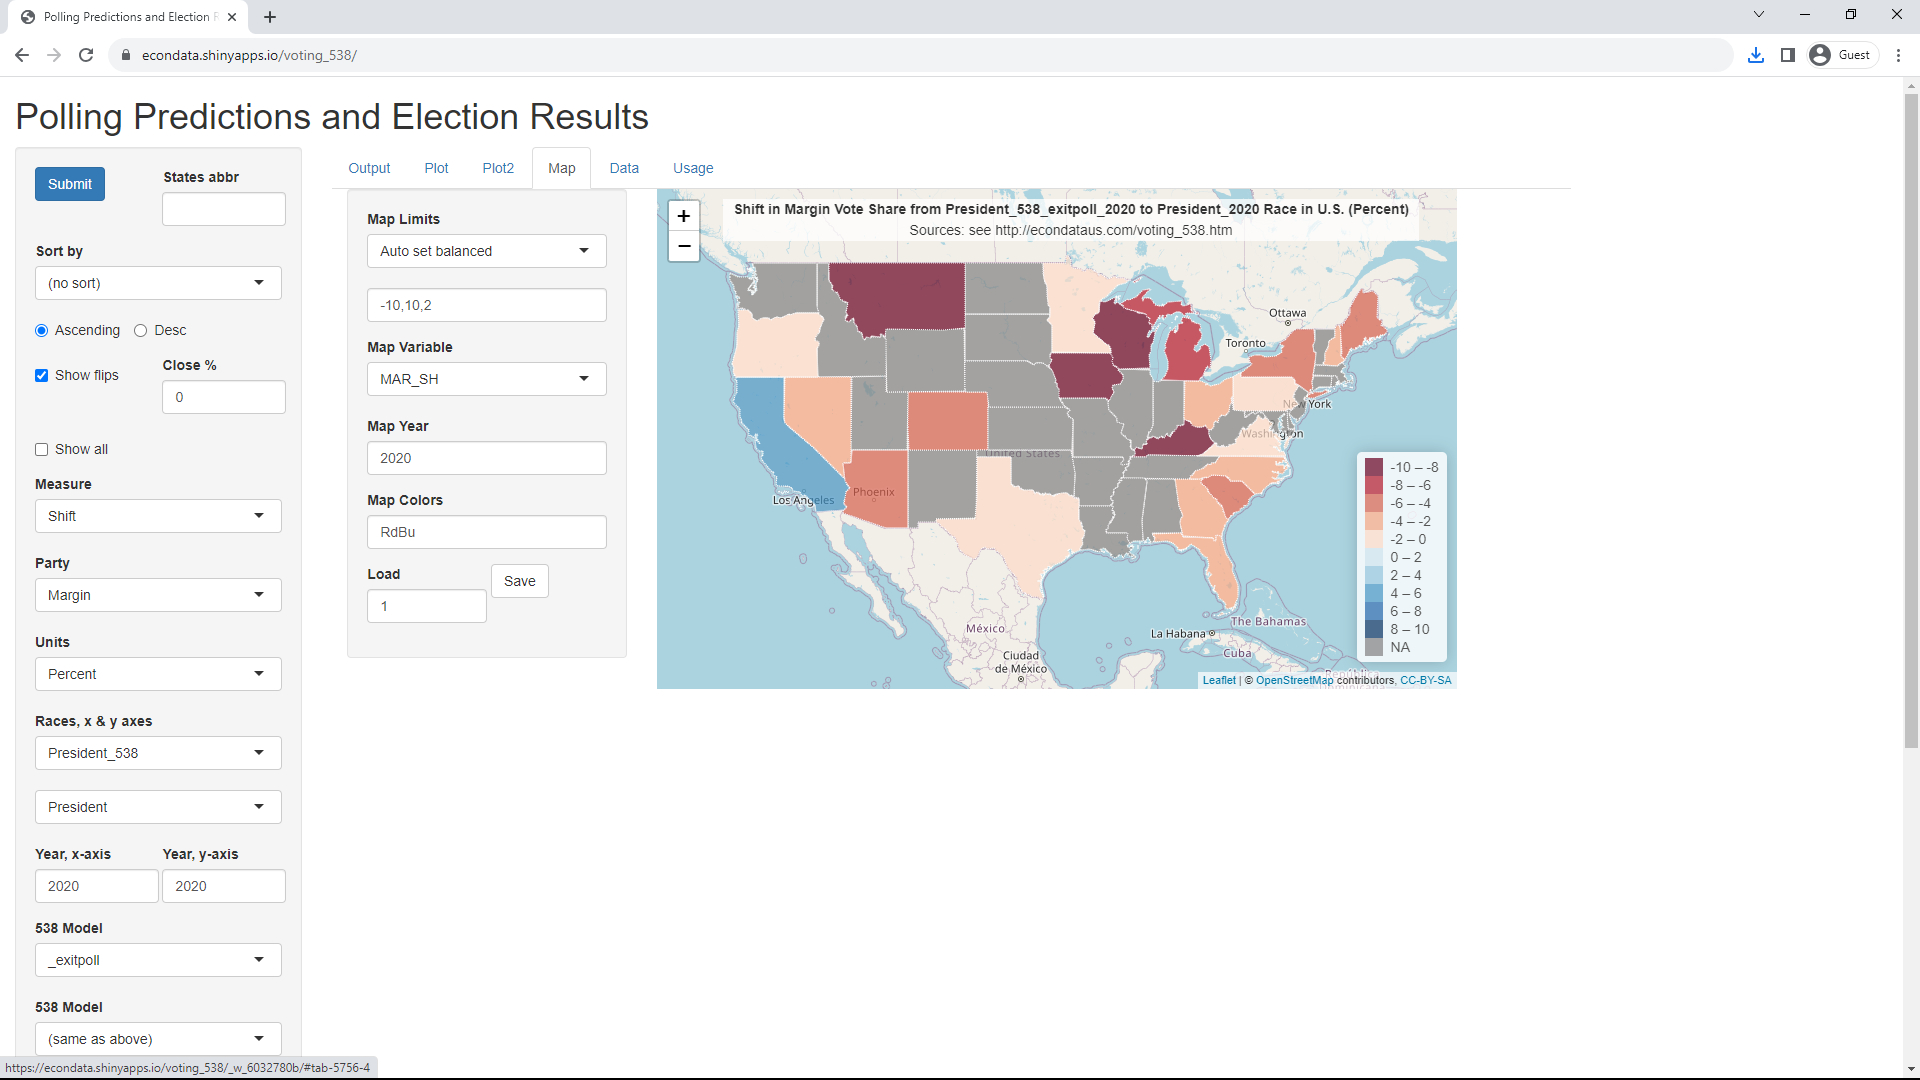
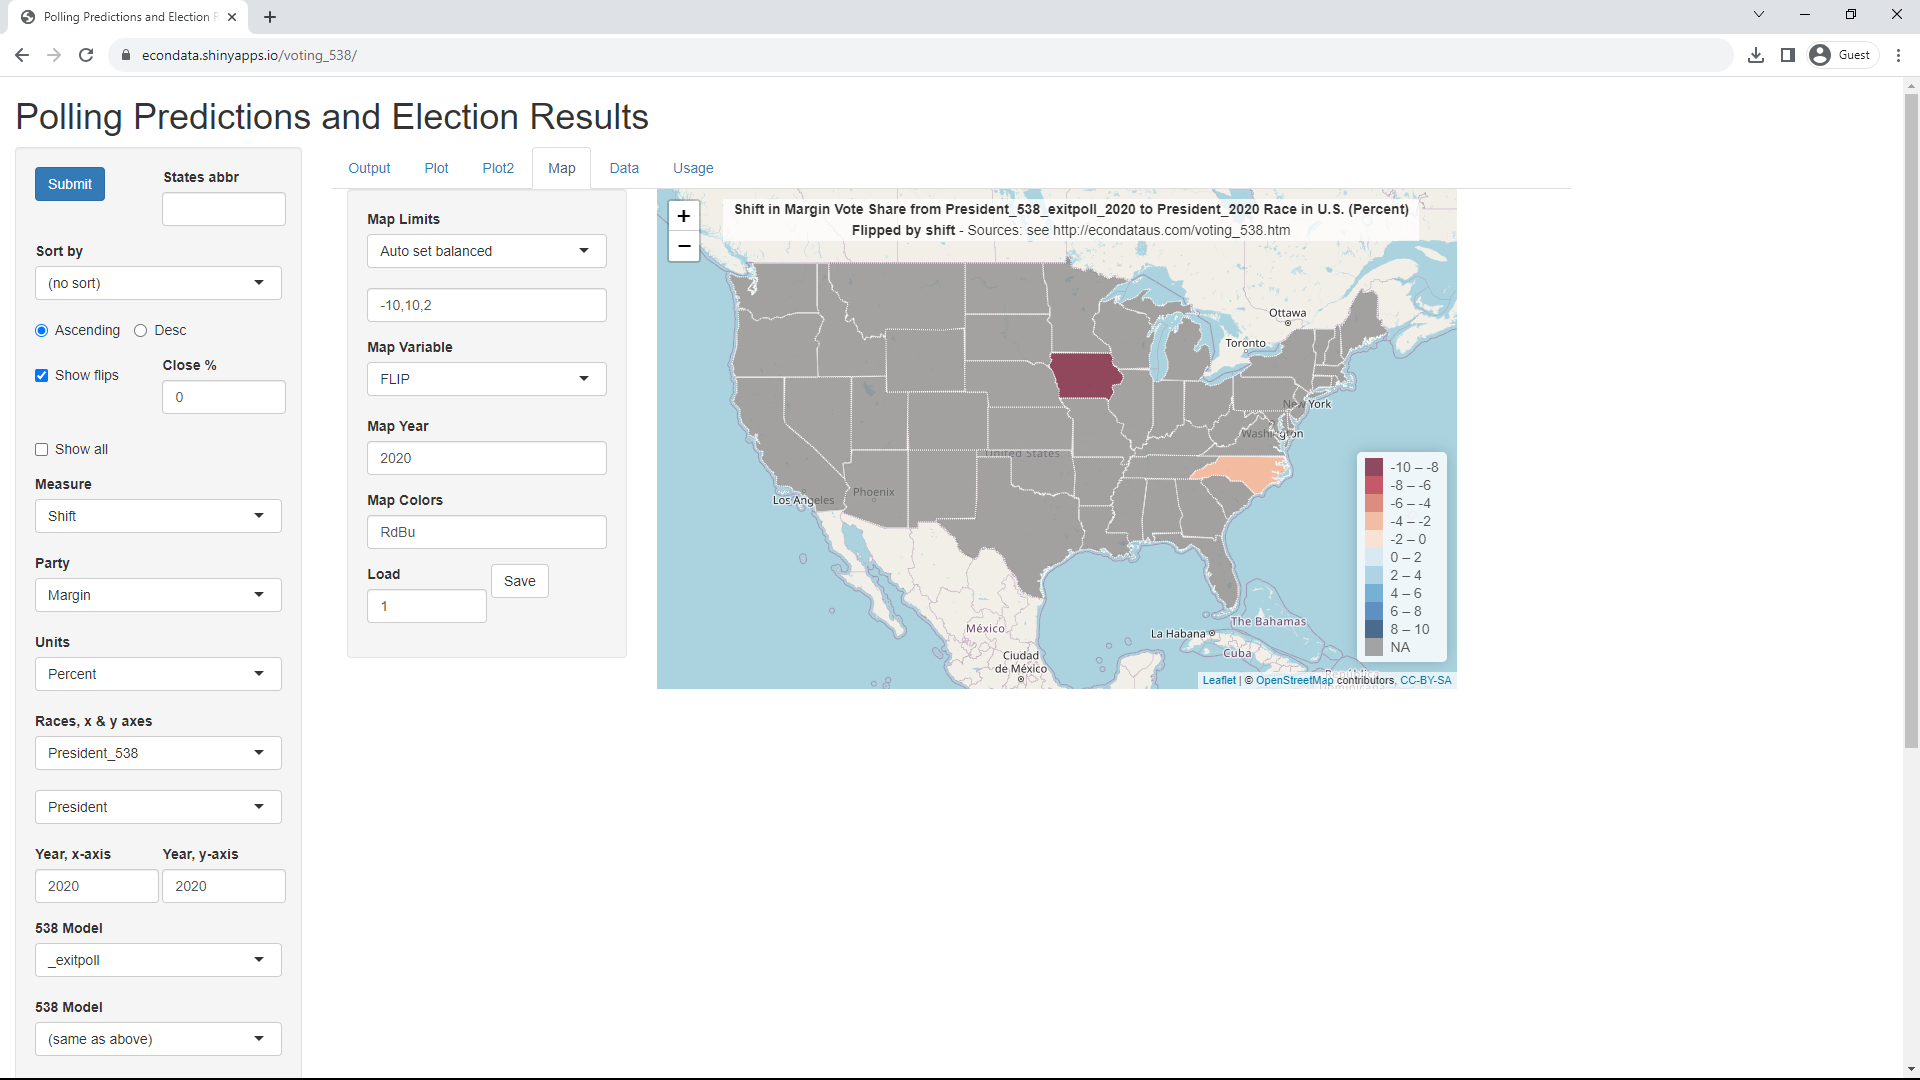
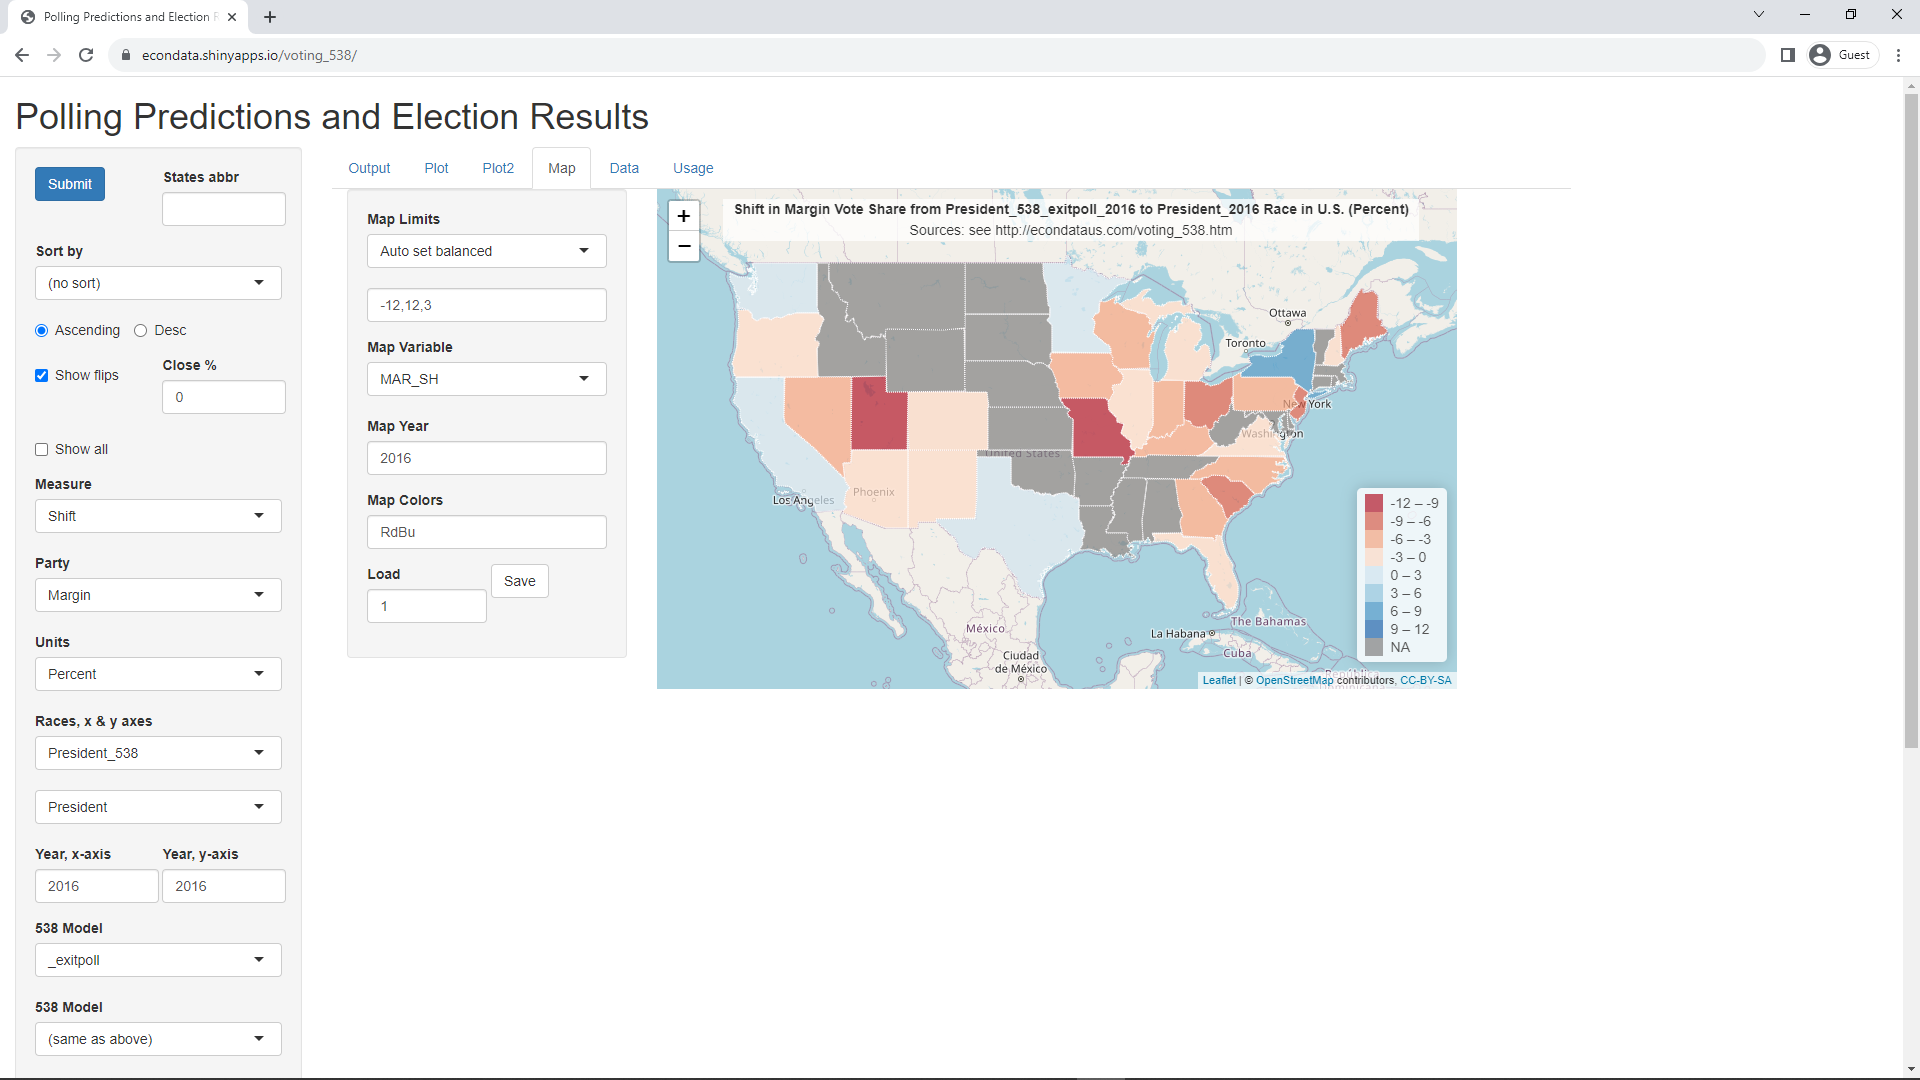
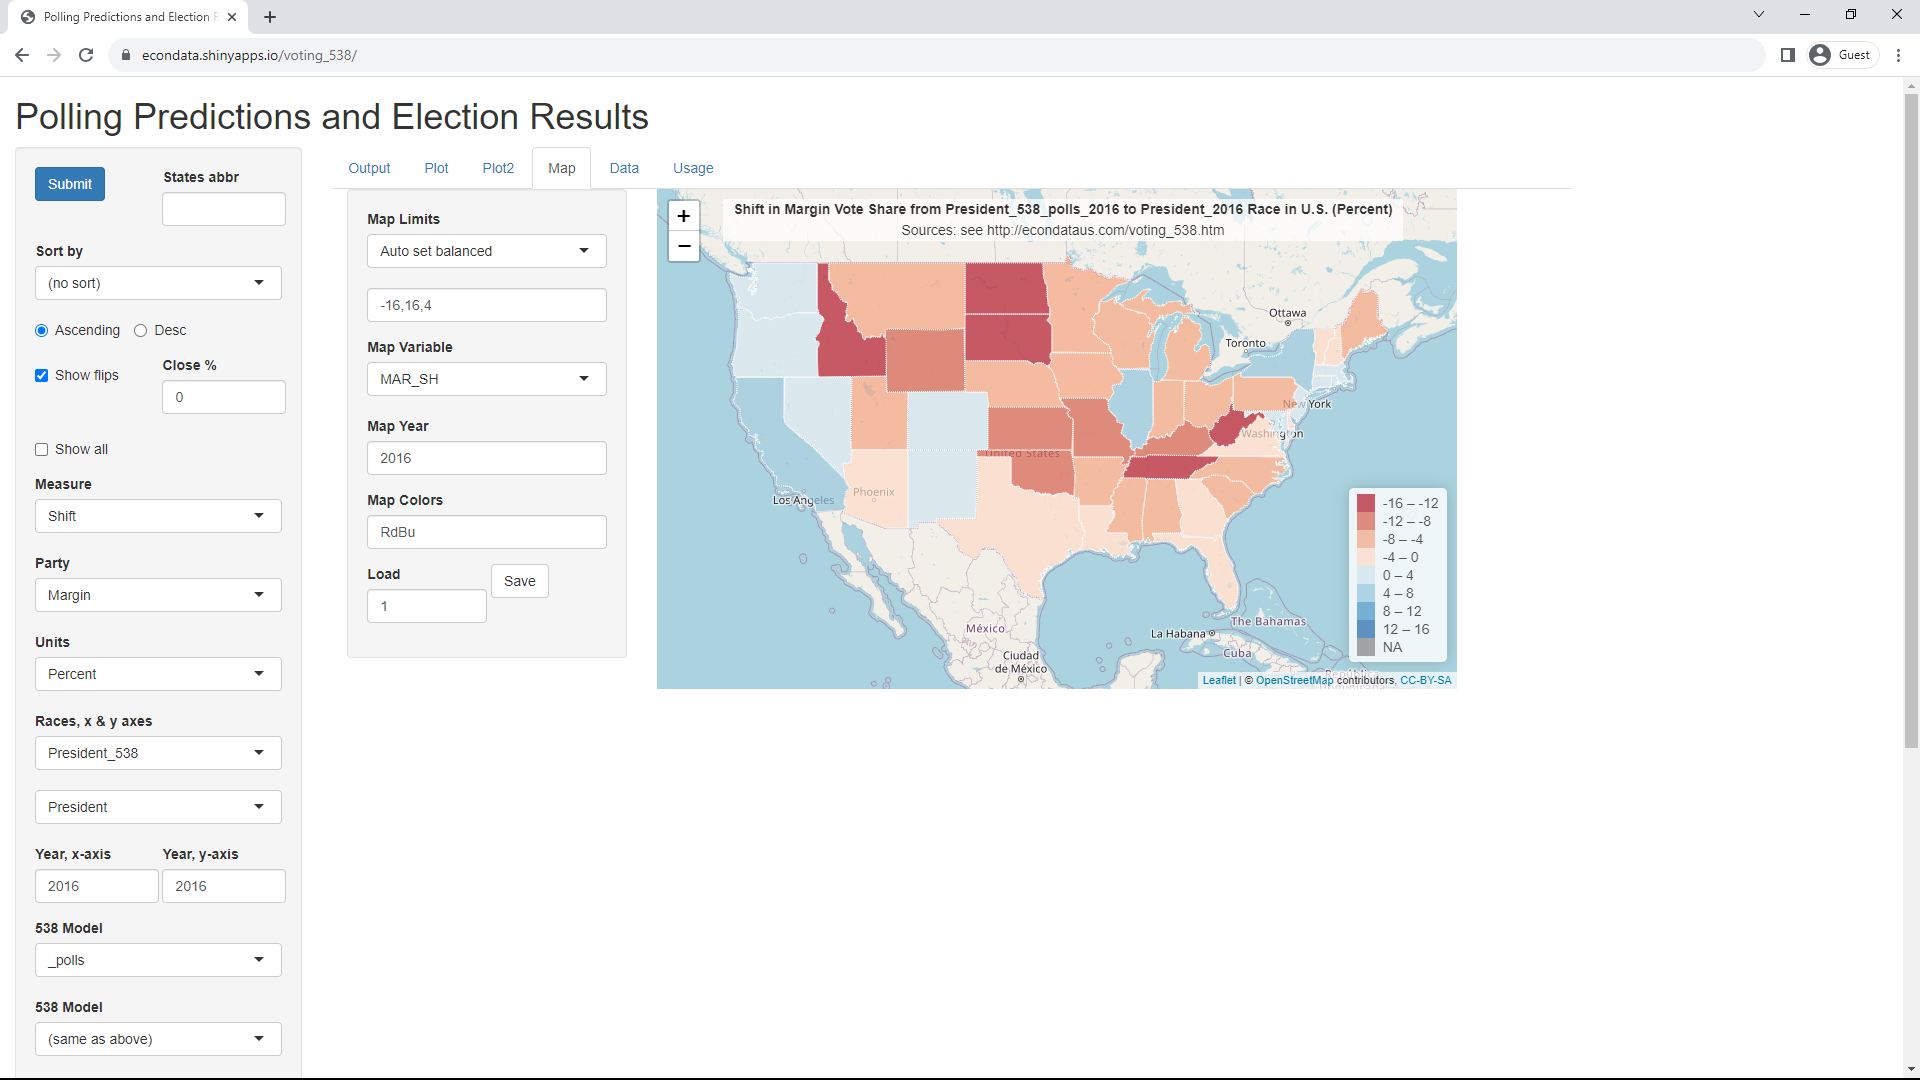
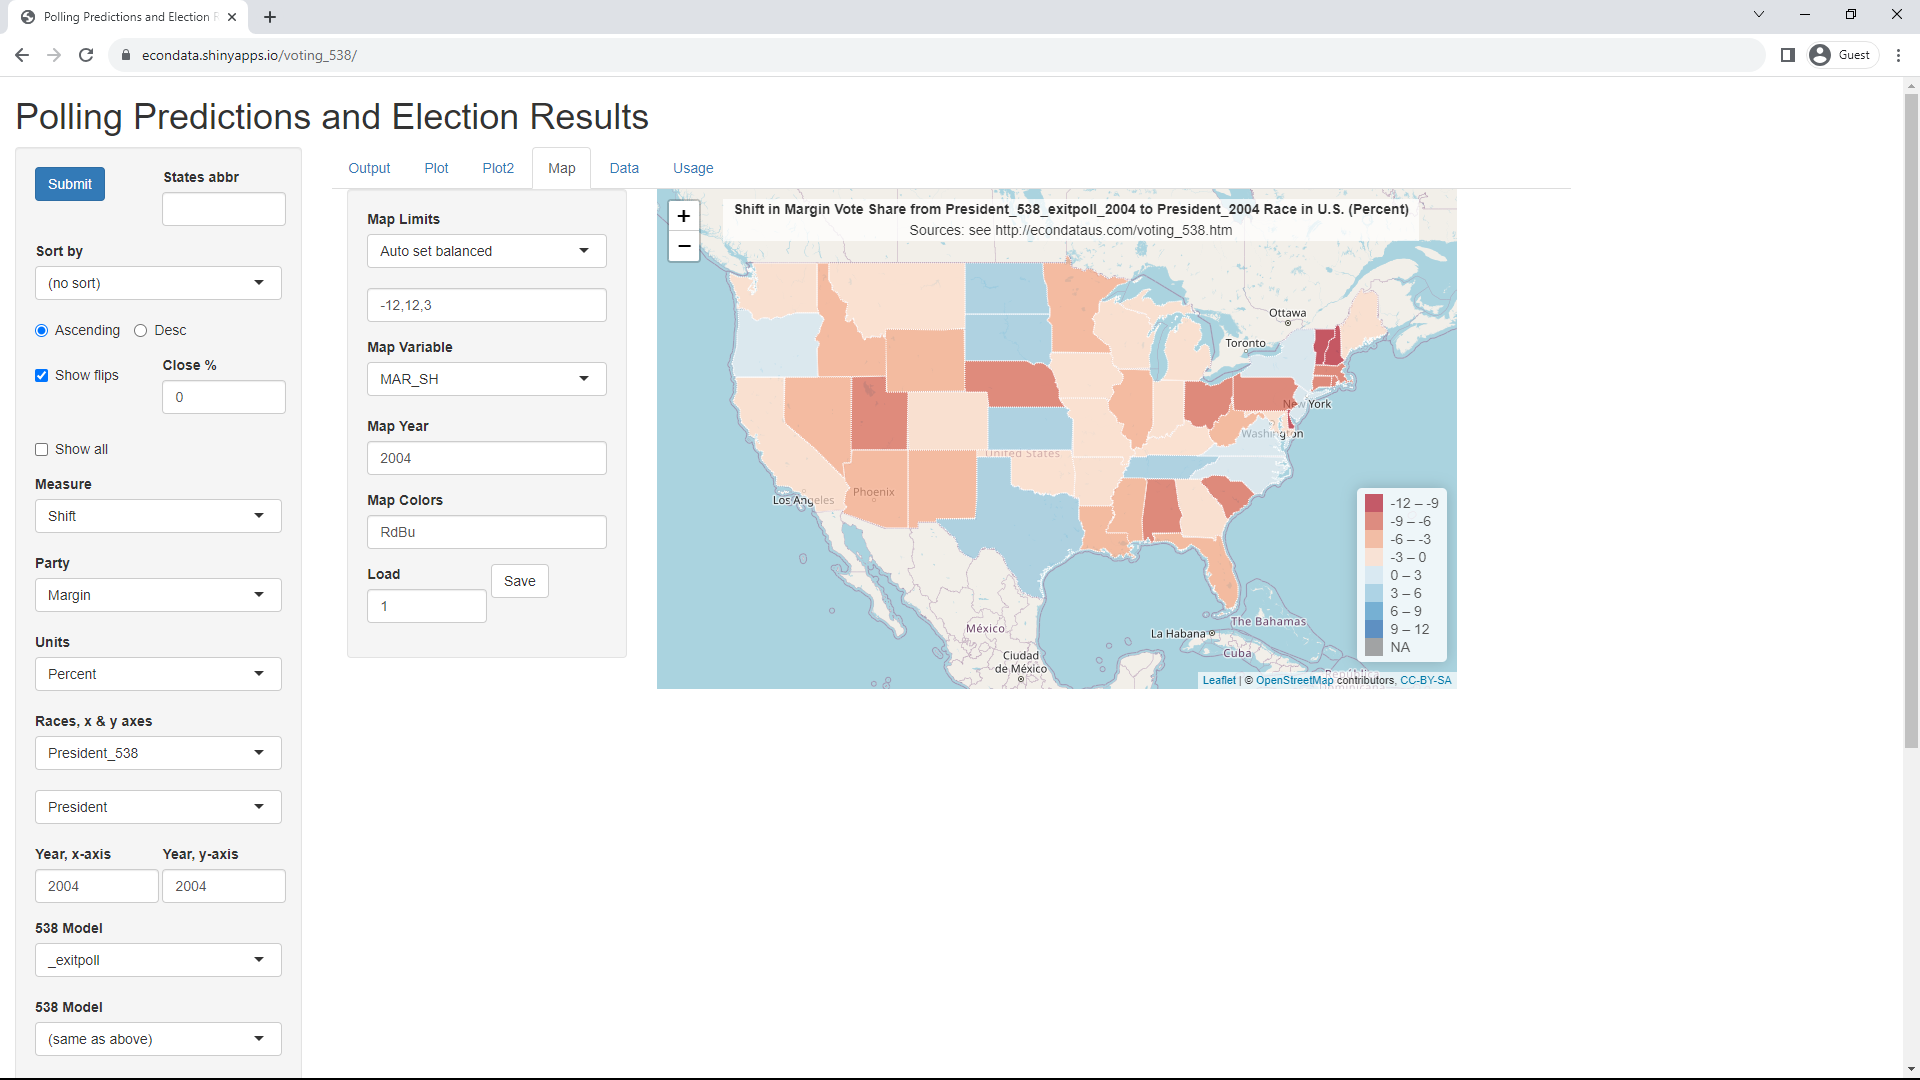
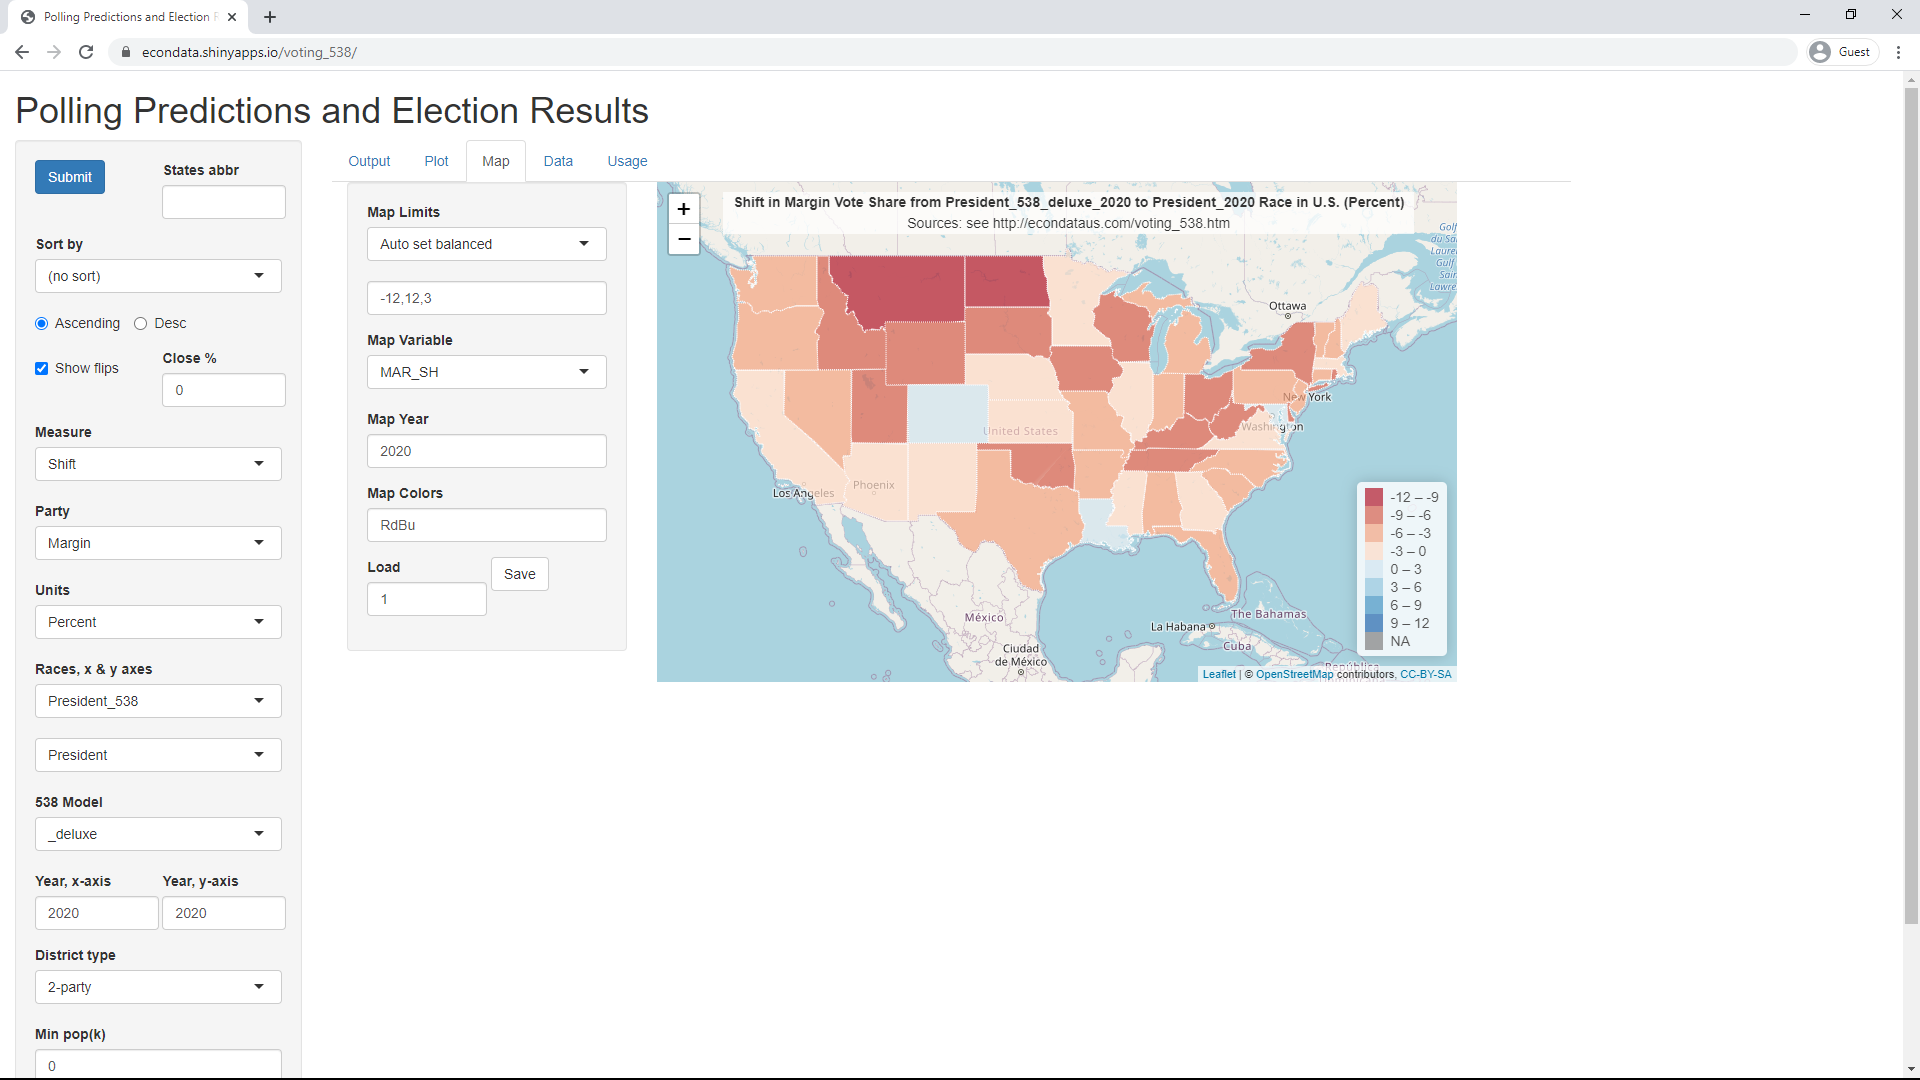
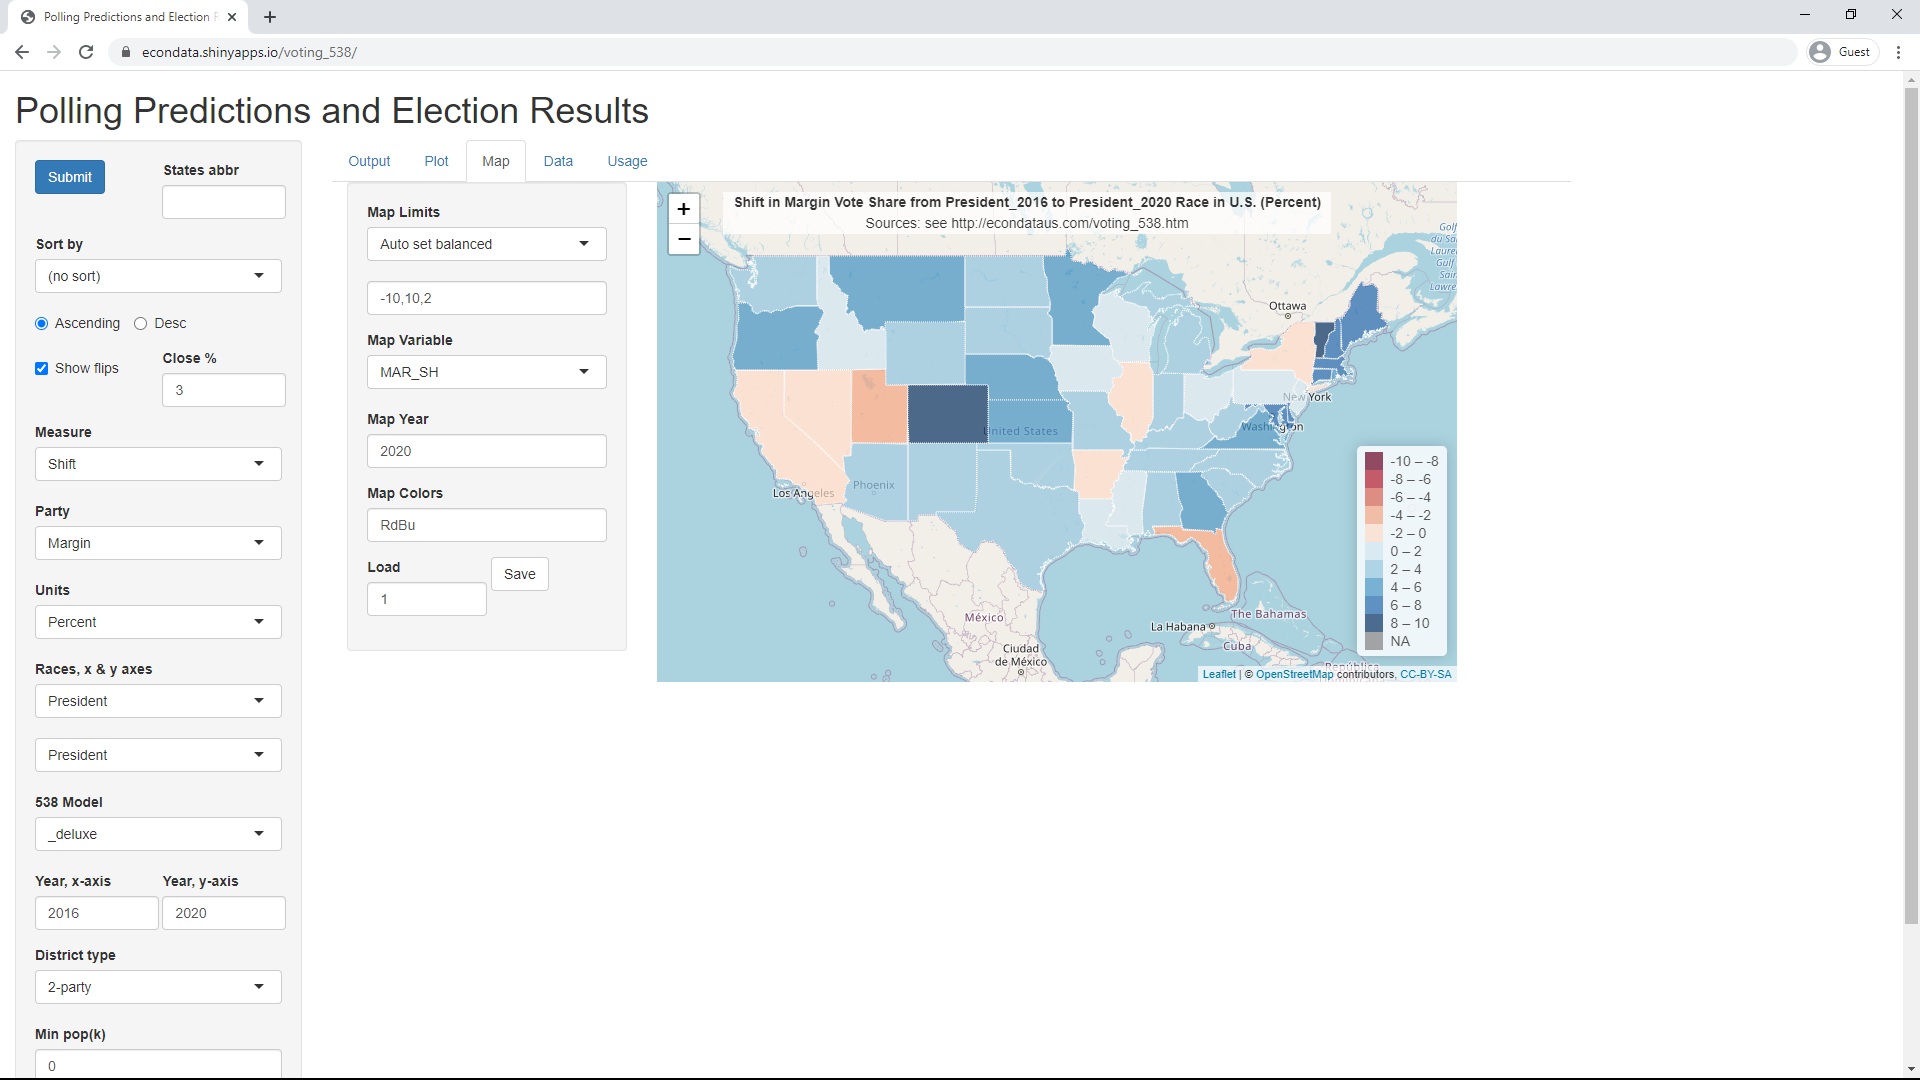
Clicking on the Map tab will display the following page:
As can be seen, all of the visible states are some shade of red and only Colorado, Louisiana, and Maryland are a shade of blue. Alaska and Hawaii are not visible on this map but they can be seen to be red by pressing down on a mouse button and dragging the map in the proper direction. Also, the color of Washington D.C. is not discernible but panning over to its location and hitting the + key in the upper left of the map to zoom in reveals that it is likewise red. It's always possible to get back to the original map by changing the "Map Variable" to another variable and then setting it back to MAR_SH.
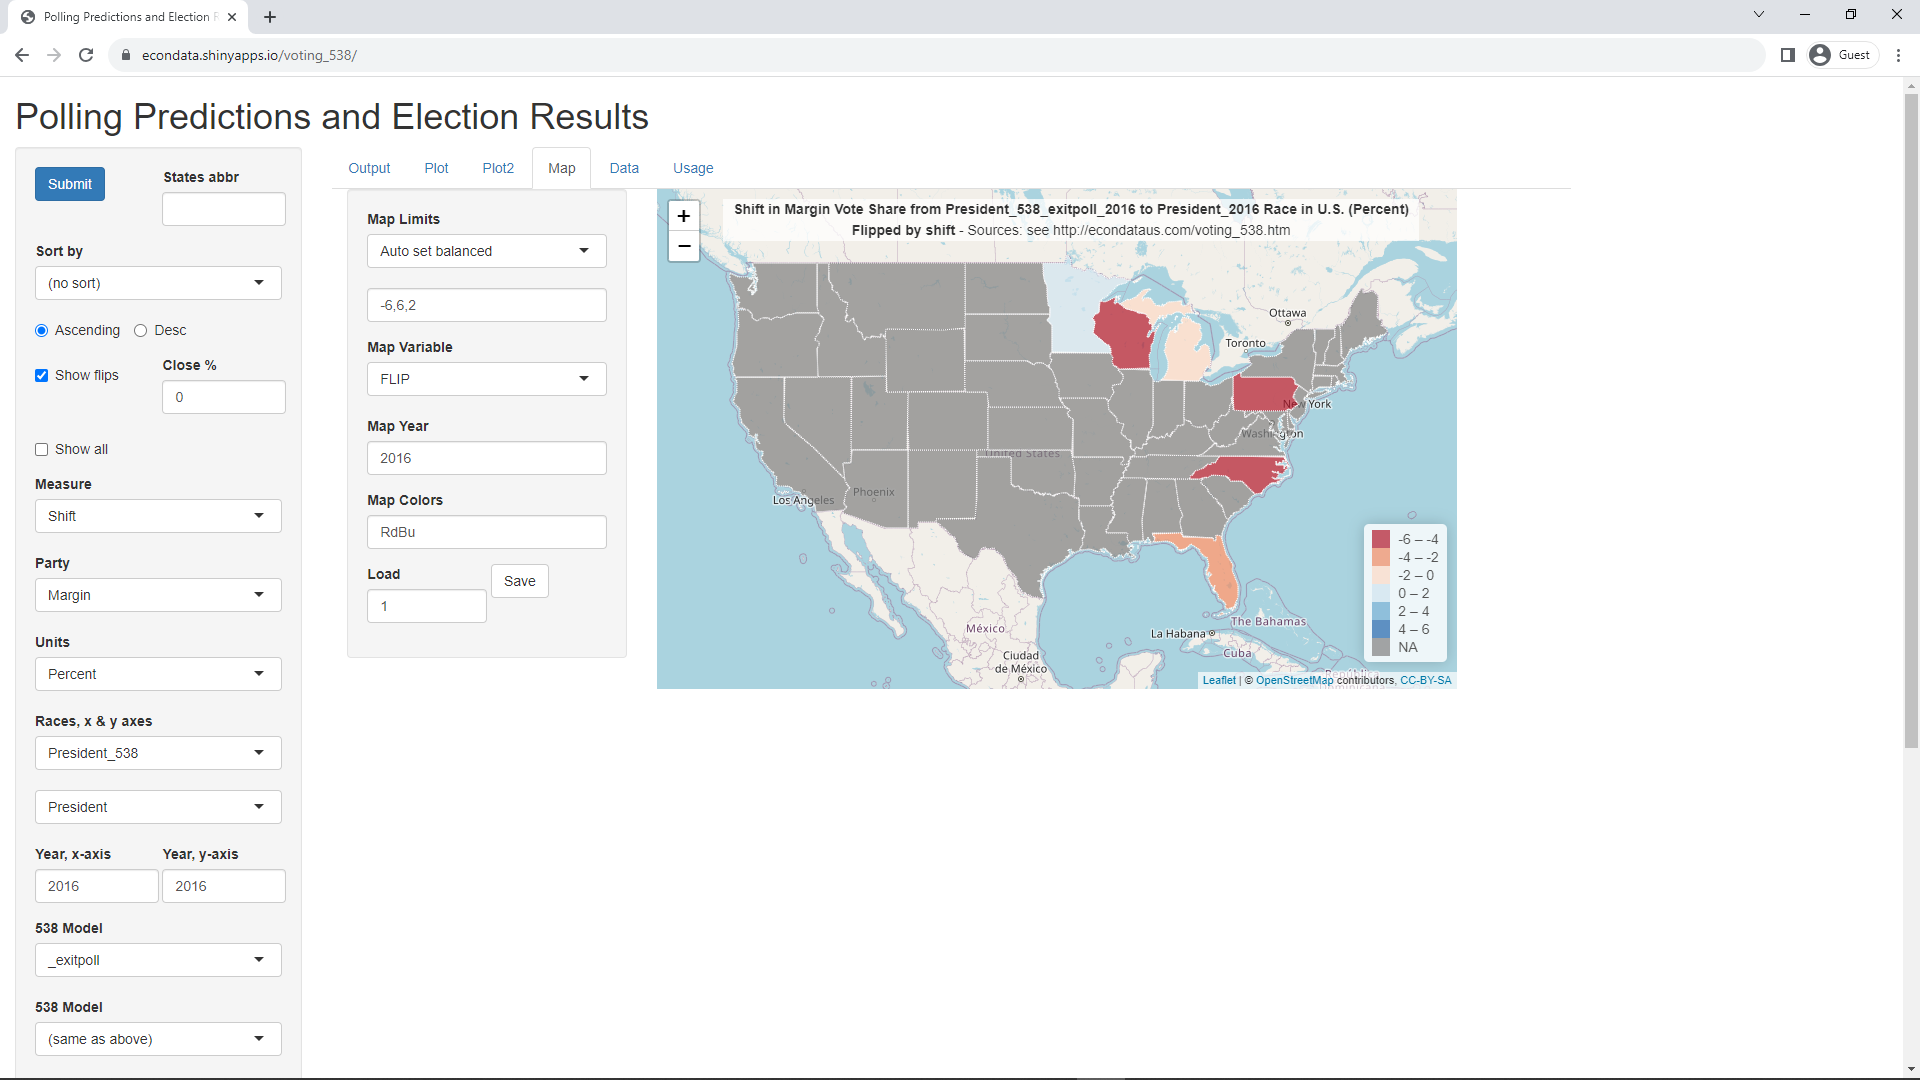
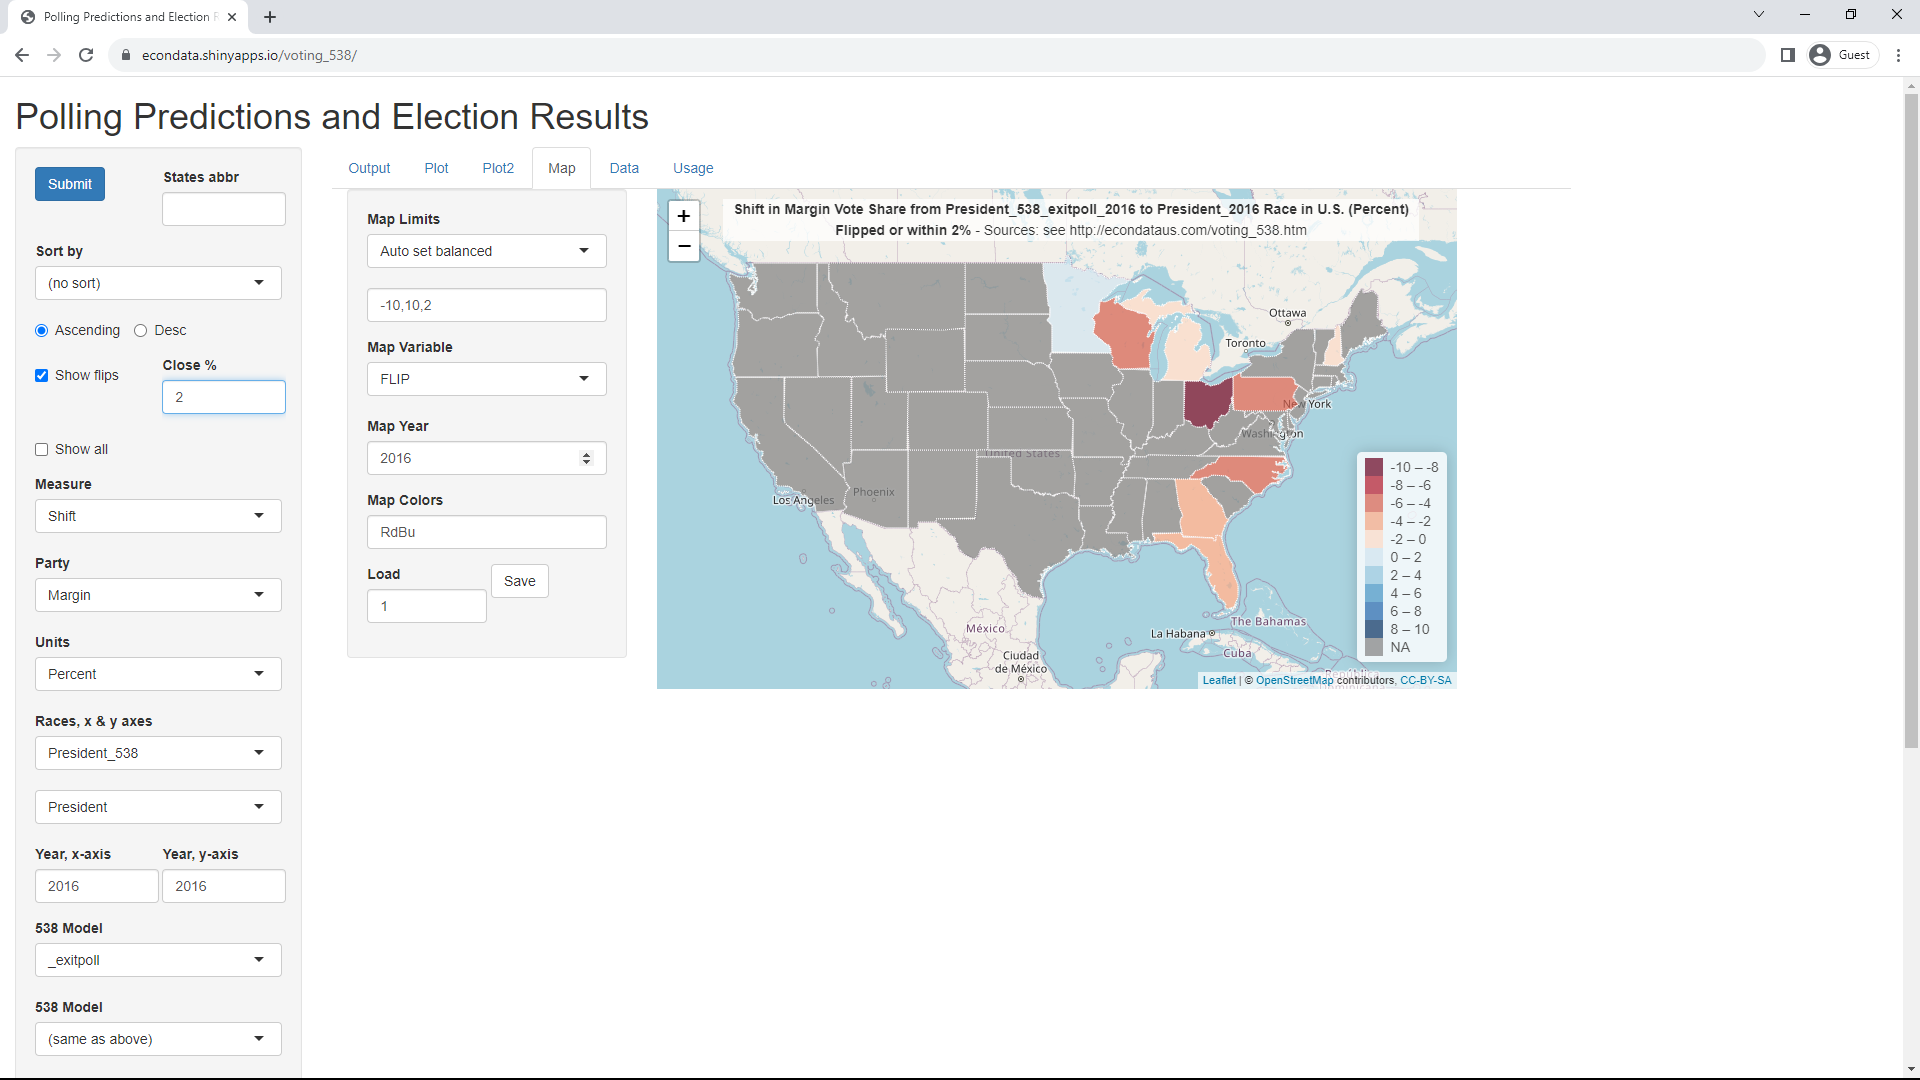
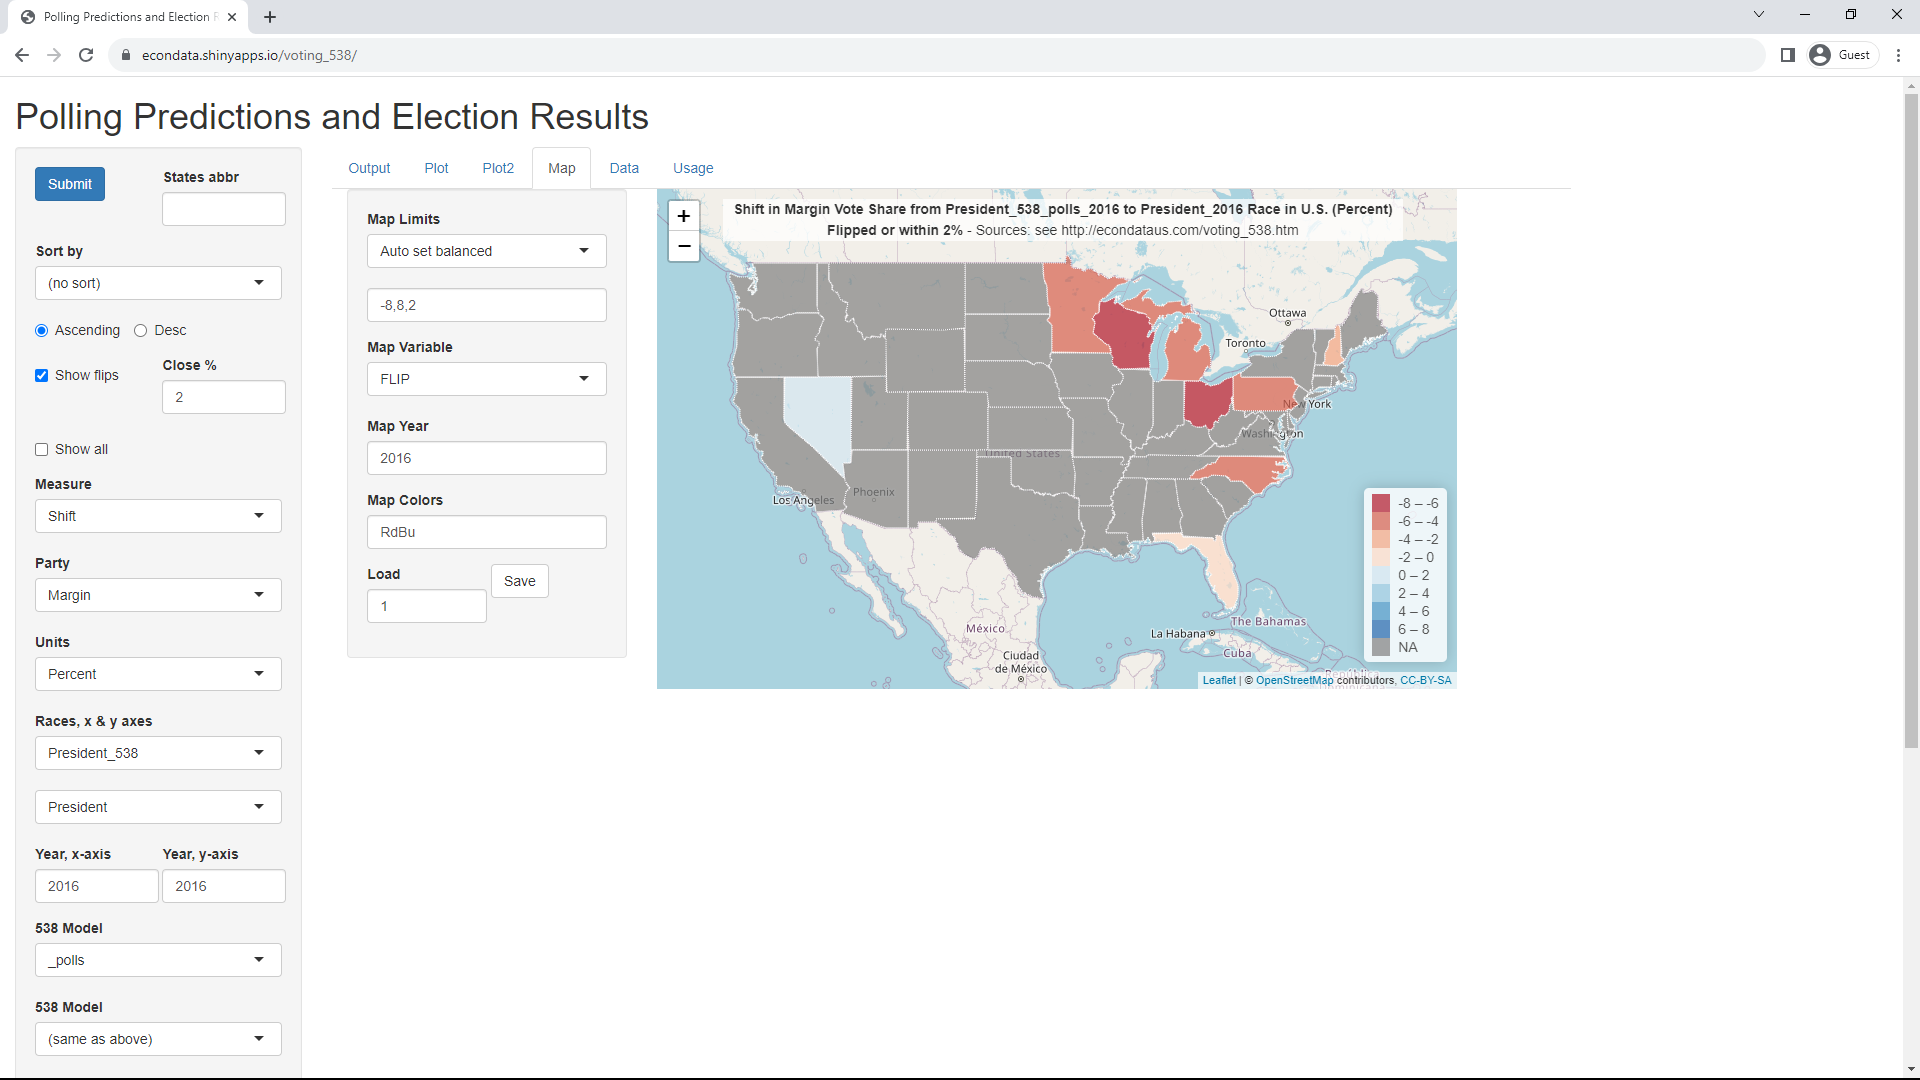
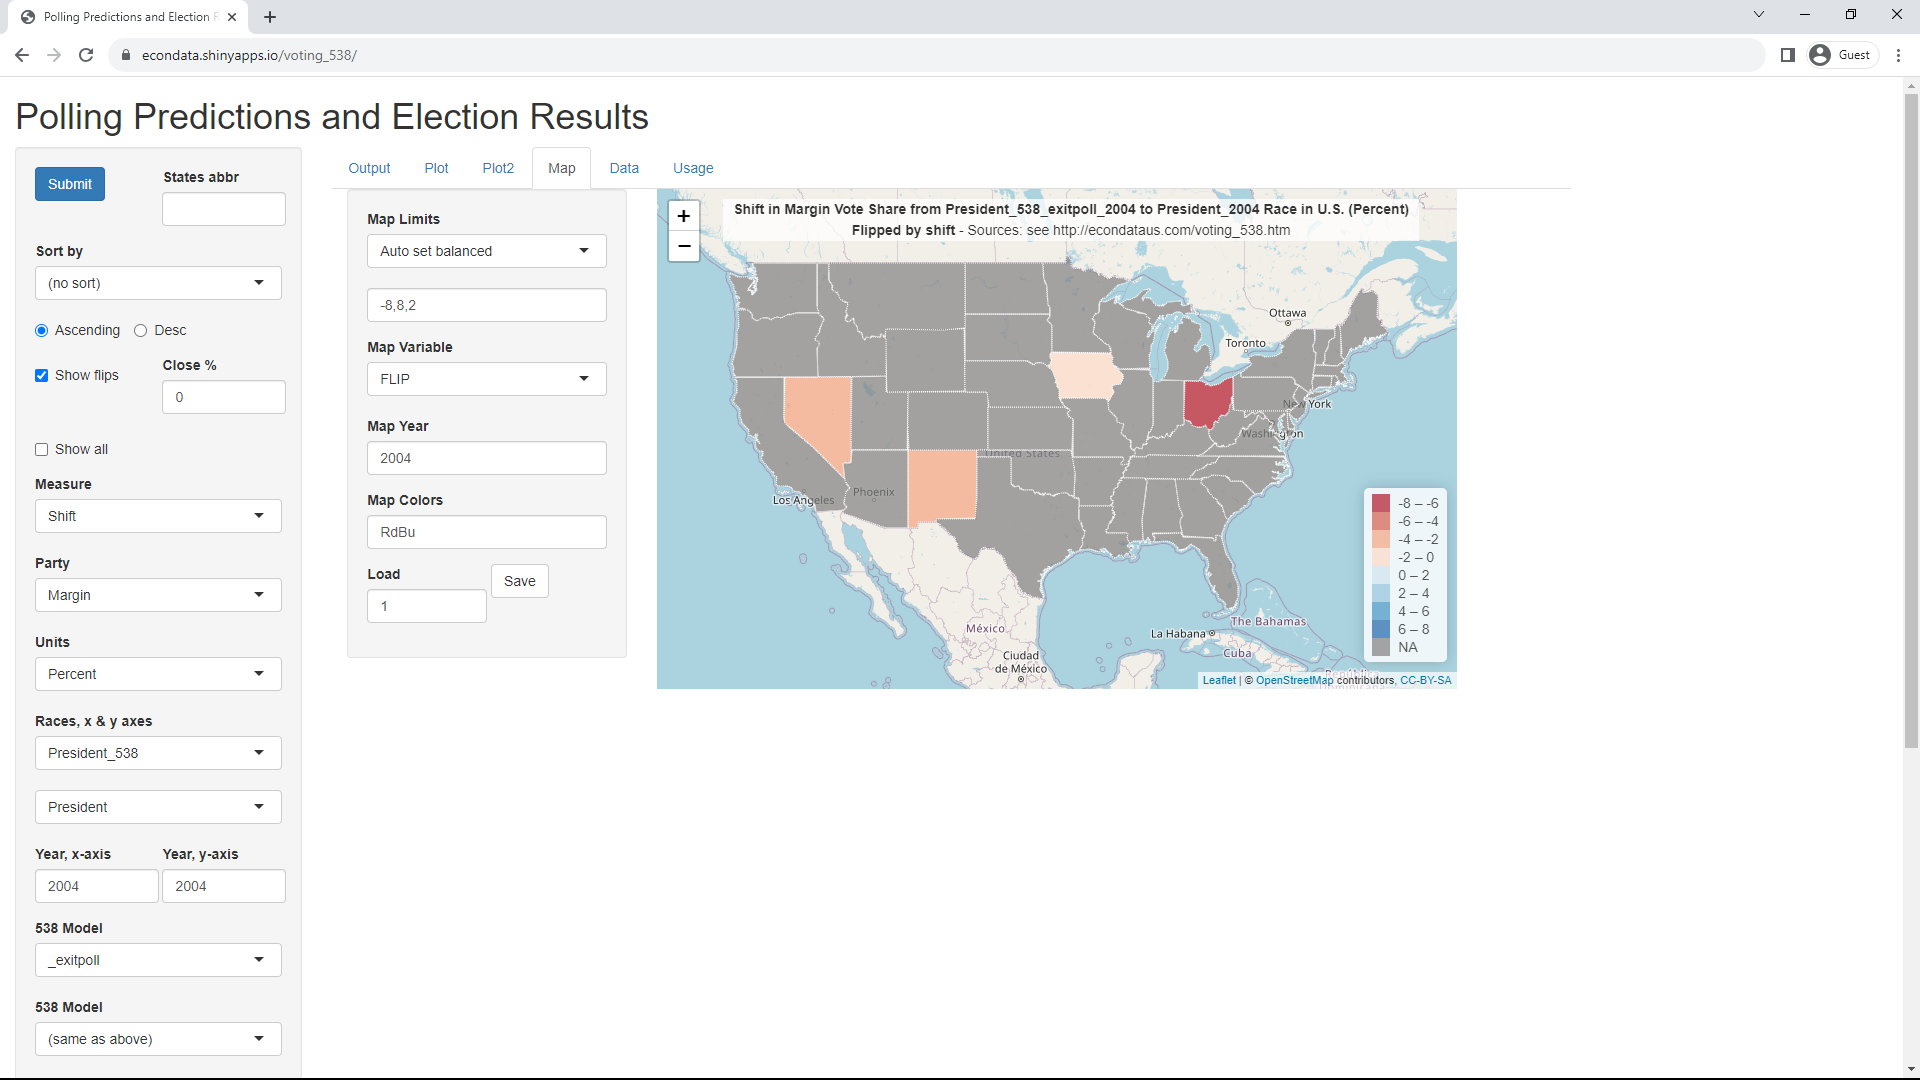
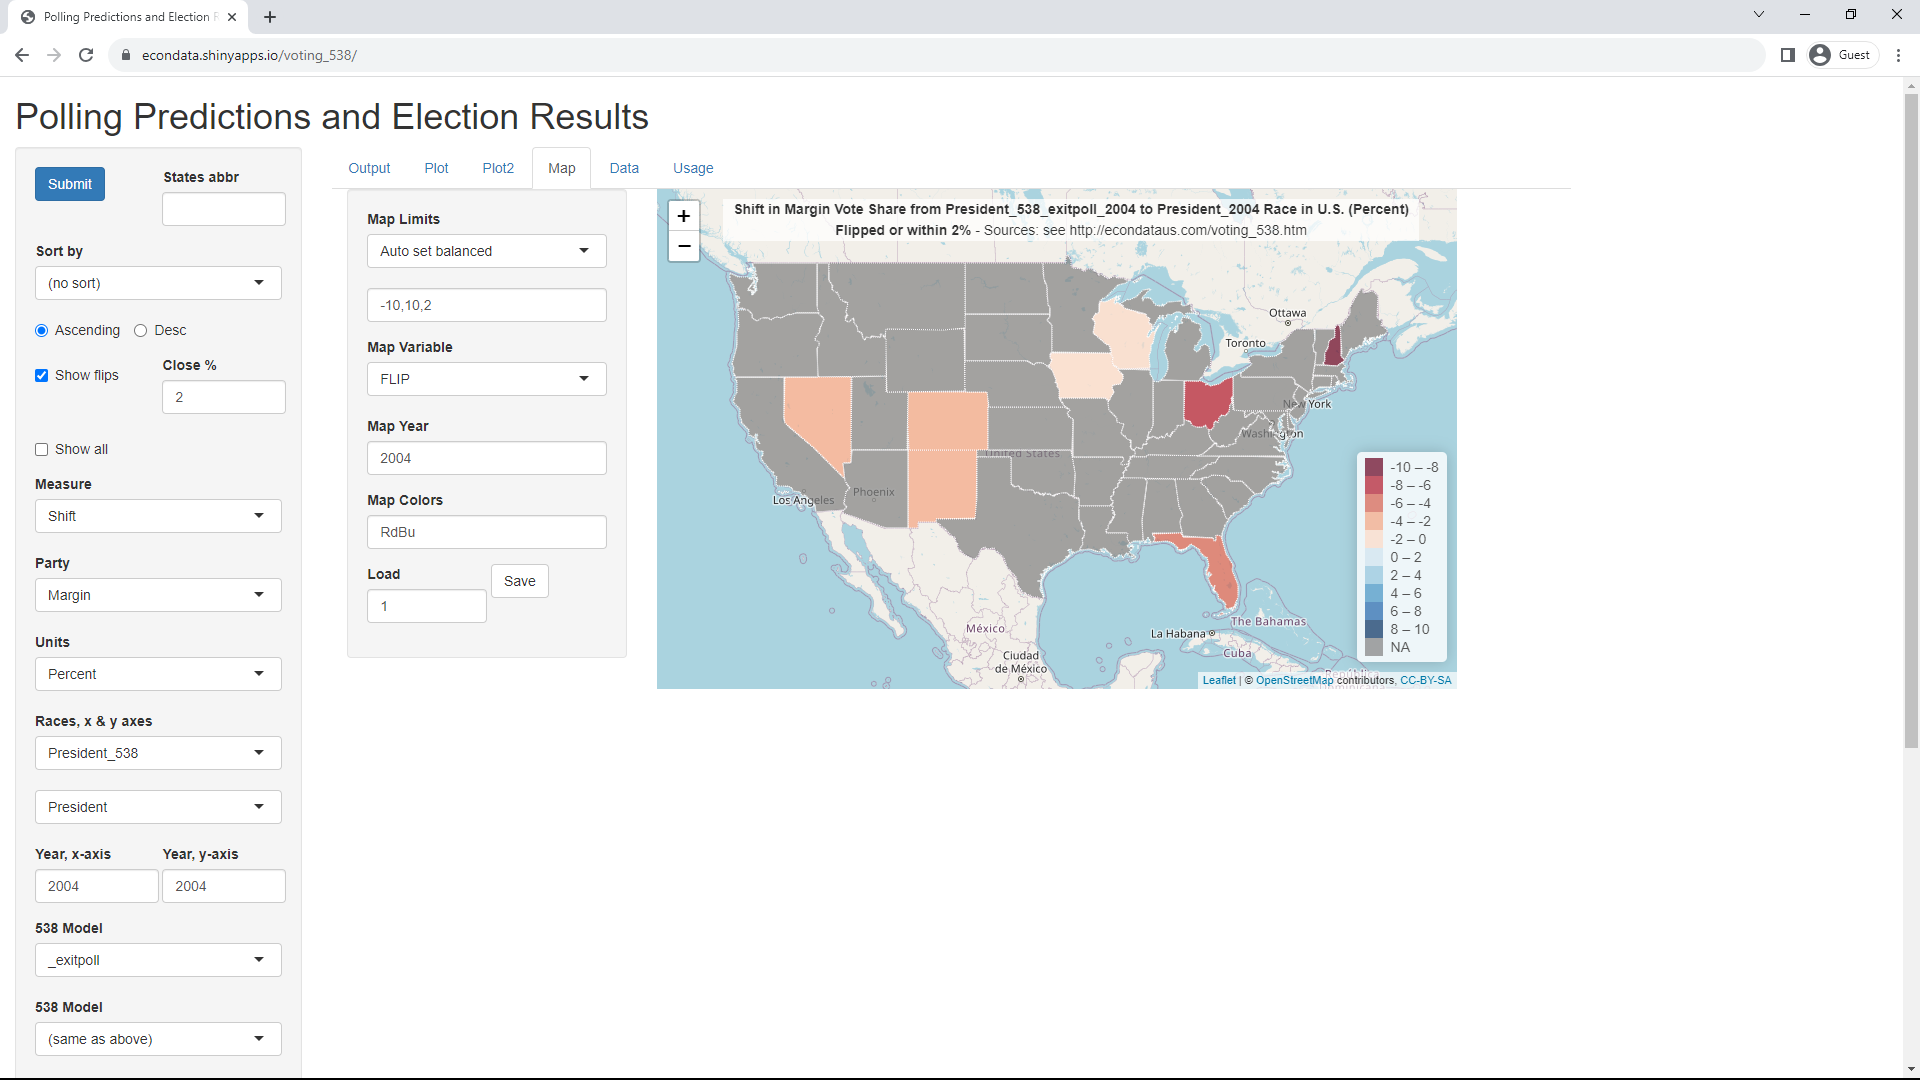
Changing the "Map Variable" to FLIP causes all of the states to become gray except for North Carolina and Florida. This is because both of these two states were flipped by the red shift from a predicted win for Democrats to an actual win for Republicans. Changing the field "Close %" on the leftmost panel from 0 to 0,3 causes the states Nevada, Arizona, Georgia, Pennsylvania, Michigan, and Wisconsin to also be colored red. This is because the actual vote margins for these 6 states were all within 3 percent. They were all losses for Trump so it was likely no coincidence that the six states that Trump lost by less than 3 percent were the six states that he contested. North Carolina also had a margin of less than 3 percent but it was in Trump's favor. Florida had a margin of 3.36%in Trump's favor. Finally, changing the field "Close %" to 3,3 (or just 3) causes Iowa, Ohio, and Texas to also be colored red. This is because these 3 states were predicted to have a margin of less than 3 percent. The red shift in all 3 caused their final margins to be greater than 3 percent in Trump's favor. Following is the screen at this point:
As can be seen, all 11 non-gray states are some shade of red, indicating that there were red shifts from their predicted results to their actual results. North Carolina and Florida were predicted to favor Biden but ended up in Trump's favor. Nevada, Arizona, Georgia, Pennsylvania, Michigan, and Wisconsin were predicted to be in Biden's favor by less than 3 percent and were won by Biden despite red shifts. Those 6 states were all contested by Trump. Finally, Iowa, Ohio, and Texas were all predicted to favor Trump by less than 3 percent but ended up favoring him by more due to the red shift.
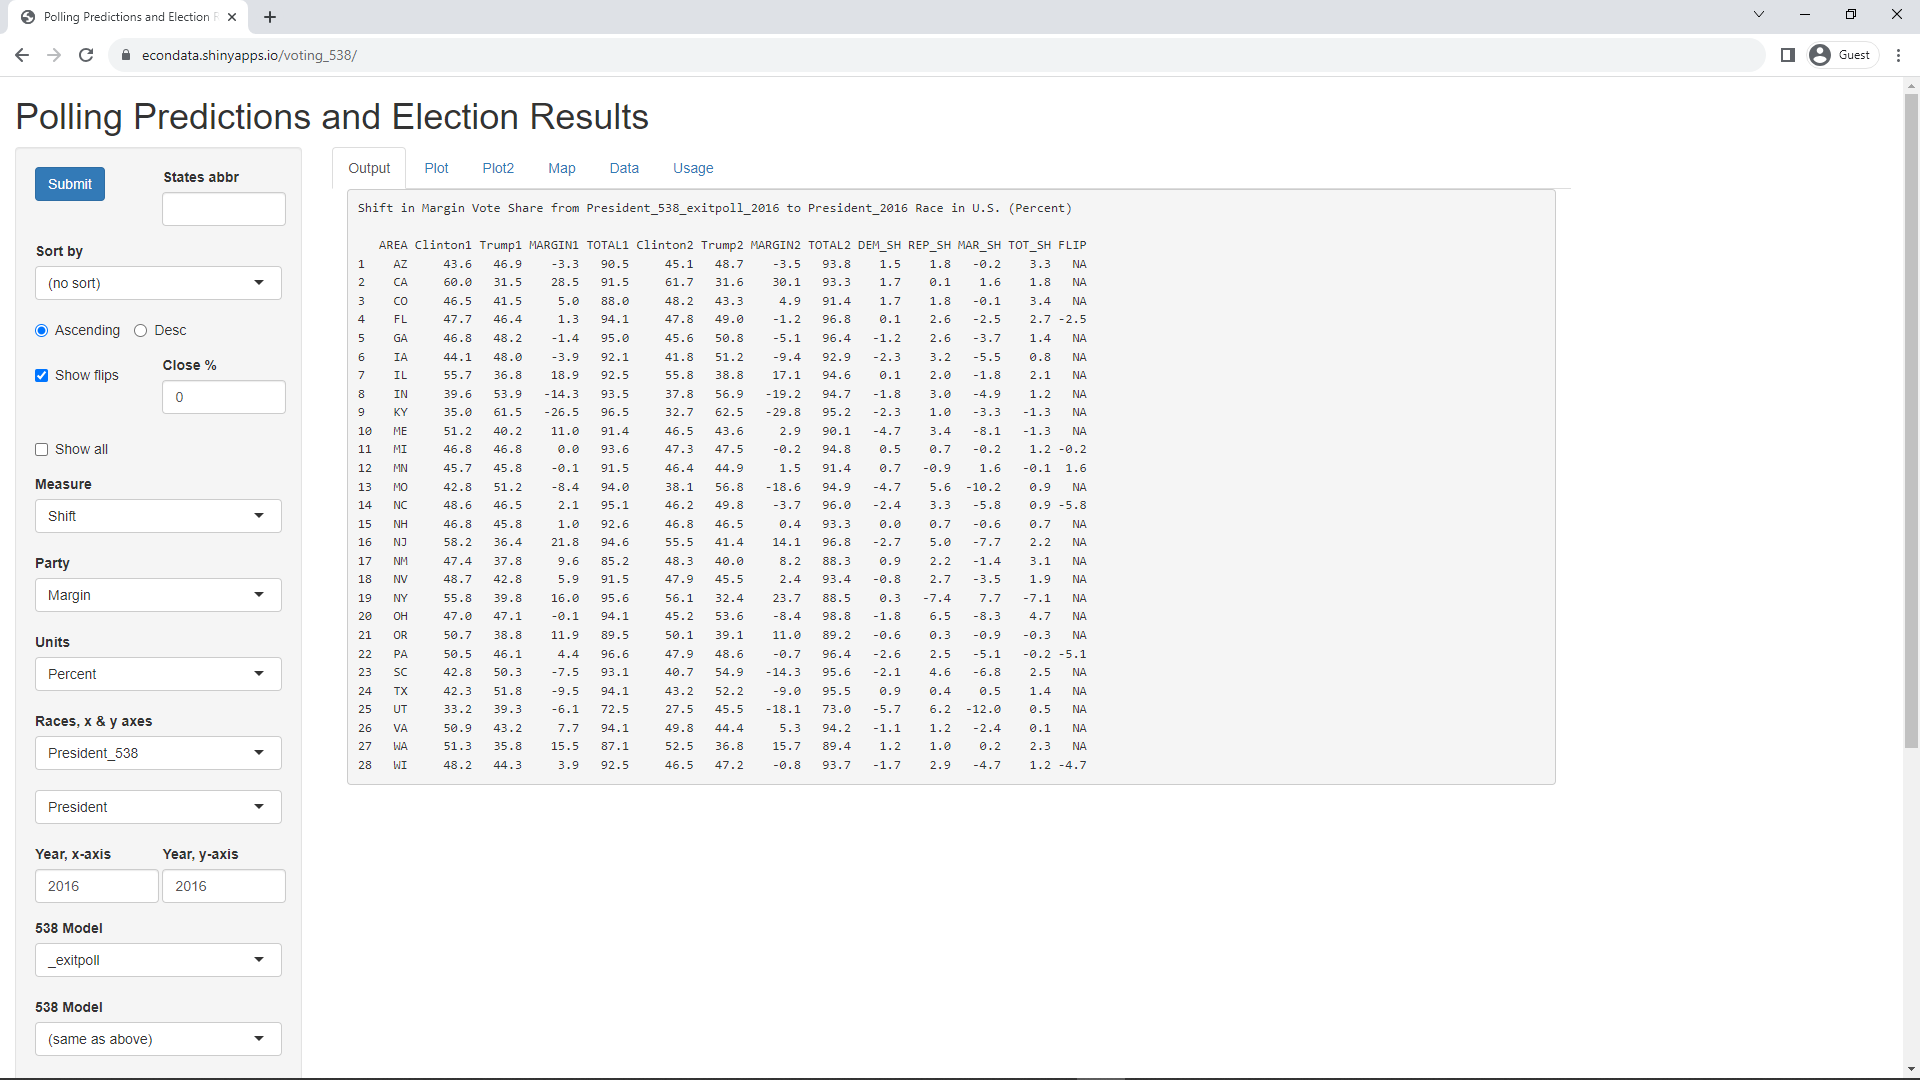
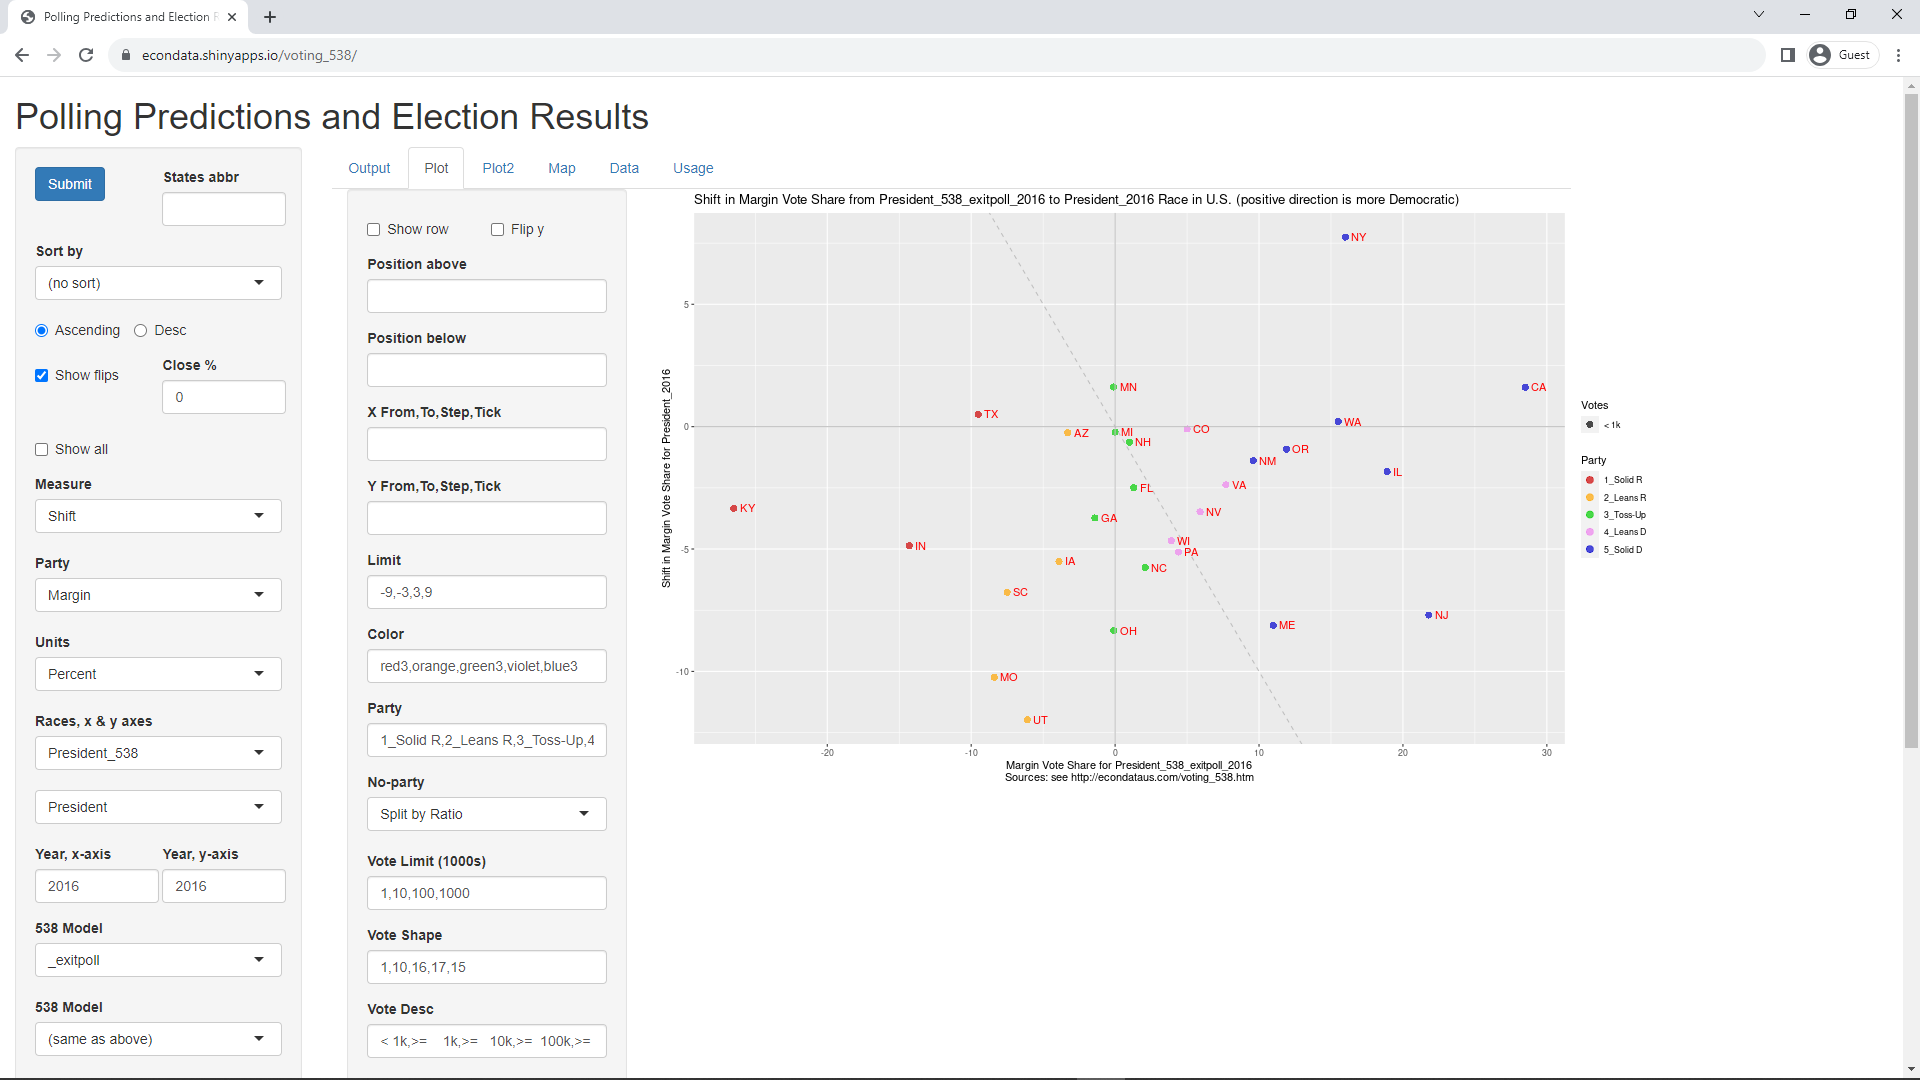
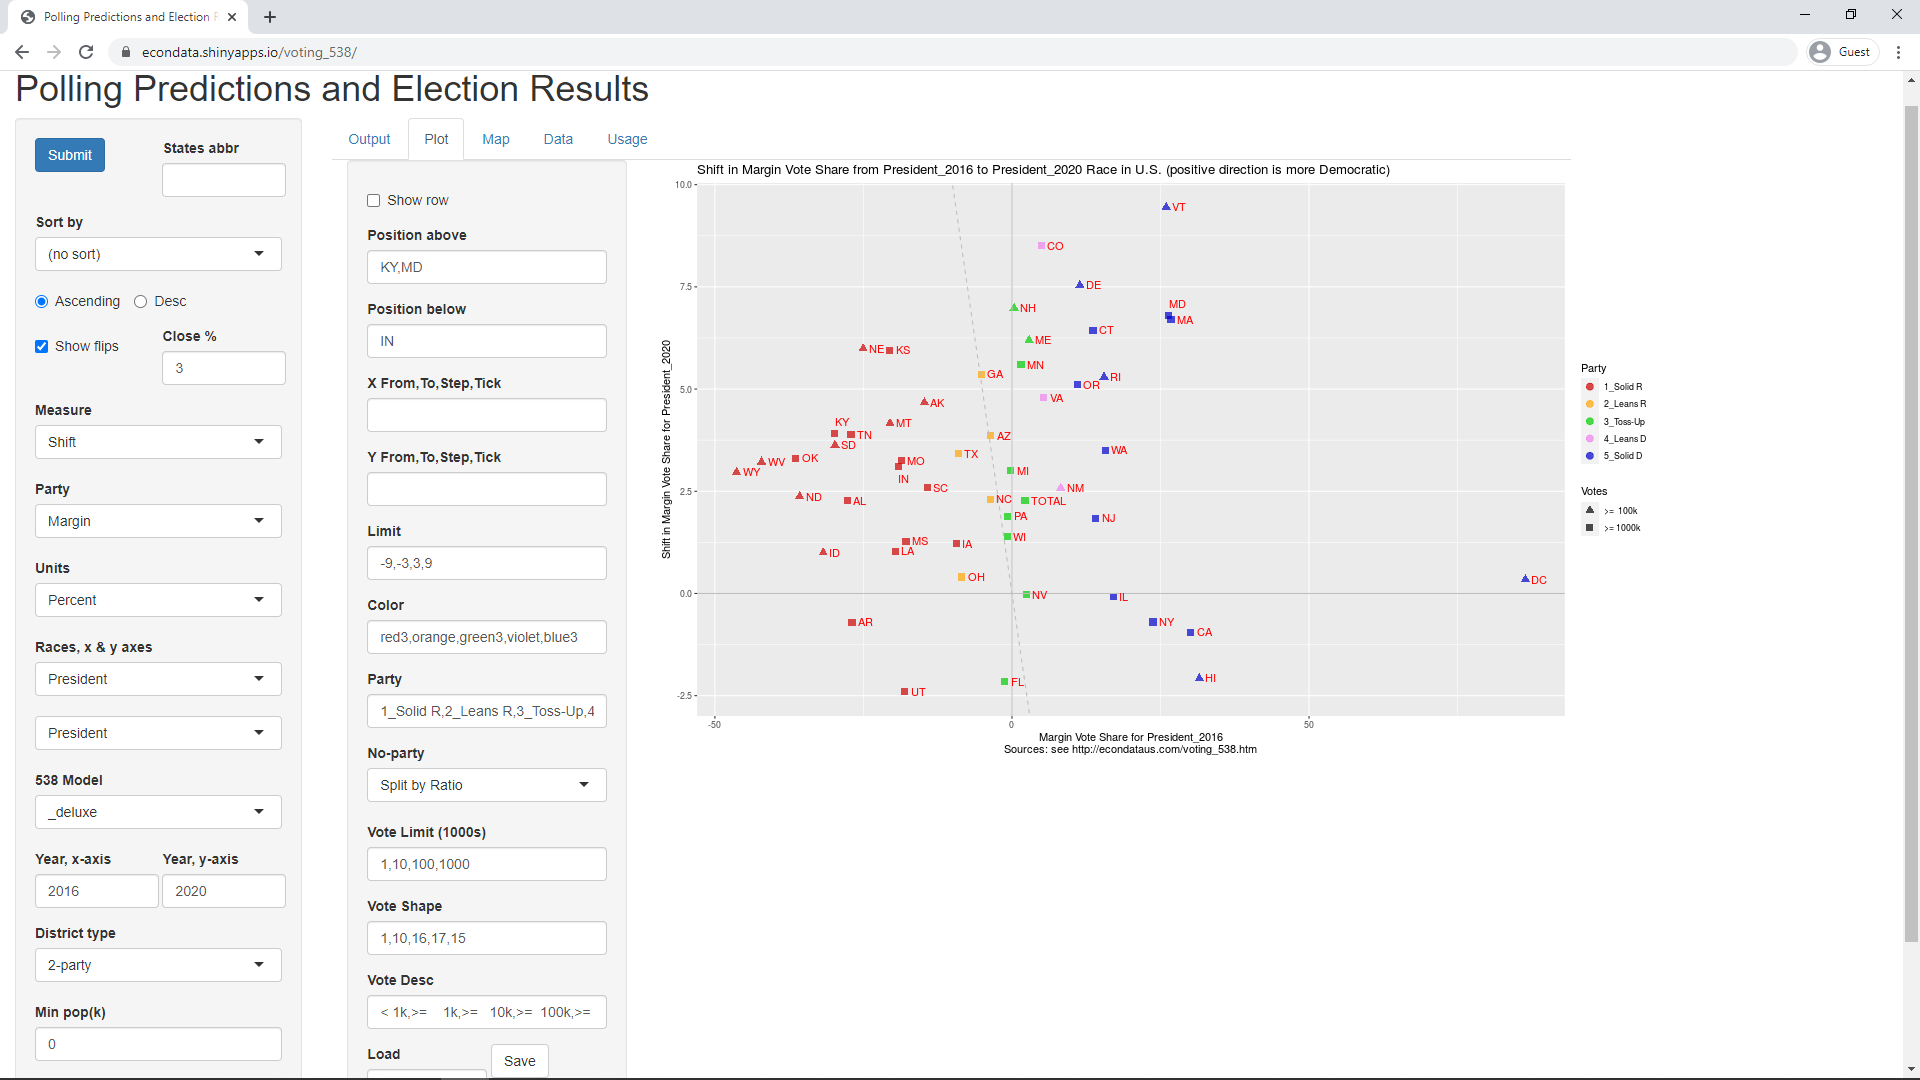
It's possible to compare the actual results from any two races that share the same areas (states or districts). Setting the "Races, x & y axes both to President, setting "Year, x-axis" to 2016 and "Year, y-axis" to 2020 compares the presidential races of 2016 and 2020. Clicking on the Plot tab will display the following page:
As can be seen, Arizona, Georgia, Michigan, Pennsylvania, and Wisconsin are between the solid and dashed y-axes and are the 5 states that were lost by Clinton in 2016 but won by Biden in 2020. Also noteworthy is that all but 8 states are above the x axis, indicating that their vote became more Democratic in 2020. Those 8 states are Arkansas (AR), California (CA), Florida (FL), Hawaii (HI), Illinois (IL), Nevada (NV), New York (NY), and Utah (UT). This suggests that most of the states, for whatever reason, moved away from Trump. It does not seem to support the idea that their was some unique fraud going on in the 6 states that Trump contested.
Clicking on the Map tab will display the following page:
This again shows that all but the 8 states mentioned above experienced a "blue shift" from 2016 to 2020. That is, their vote shifted toward the Democrats between the 2016 and 2020 Presidential races.
This application is under continuing development. To see what races and years it currently has data for, select the Data tab. Currently, it will display the following tables:
The second table just contains the saved parameters that exist. Each file of parameters correspond to a specific race (the first race) and year and can include more than one full set of parameters. The parameter totals of 12, 24, and 36 for the Plot parameters correspond to 1, 2, and 3 full sets of saved parameters. The parameter totals of 5 and 10 for Map parameters correspond to 1 and 2 full sets of saved parameters.
Change the two races following the "Races, x & y axes" to Senate_538 and Senate and make sure that "538 Model", "Year, x-axis", and "Year, y-axis" are set to _deluxe, 2020, and 2020, respectively. If you then click the Output tab, you will get the following table:
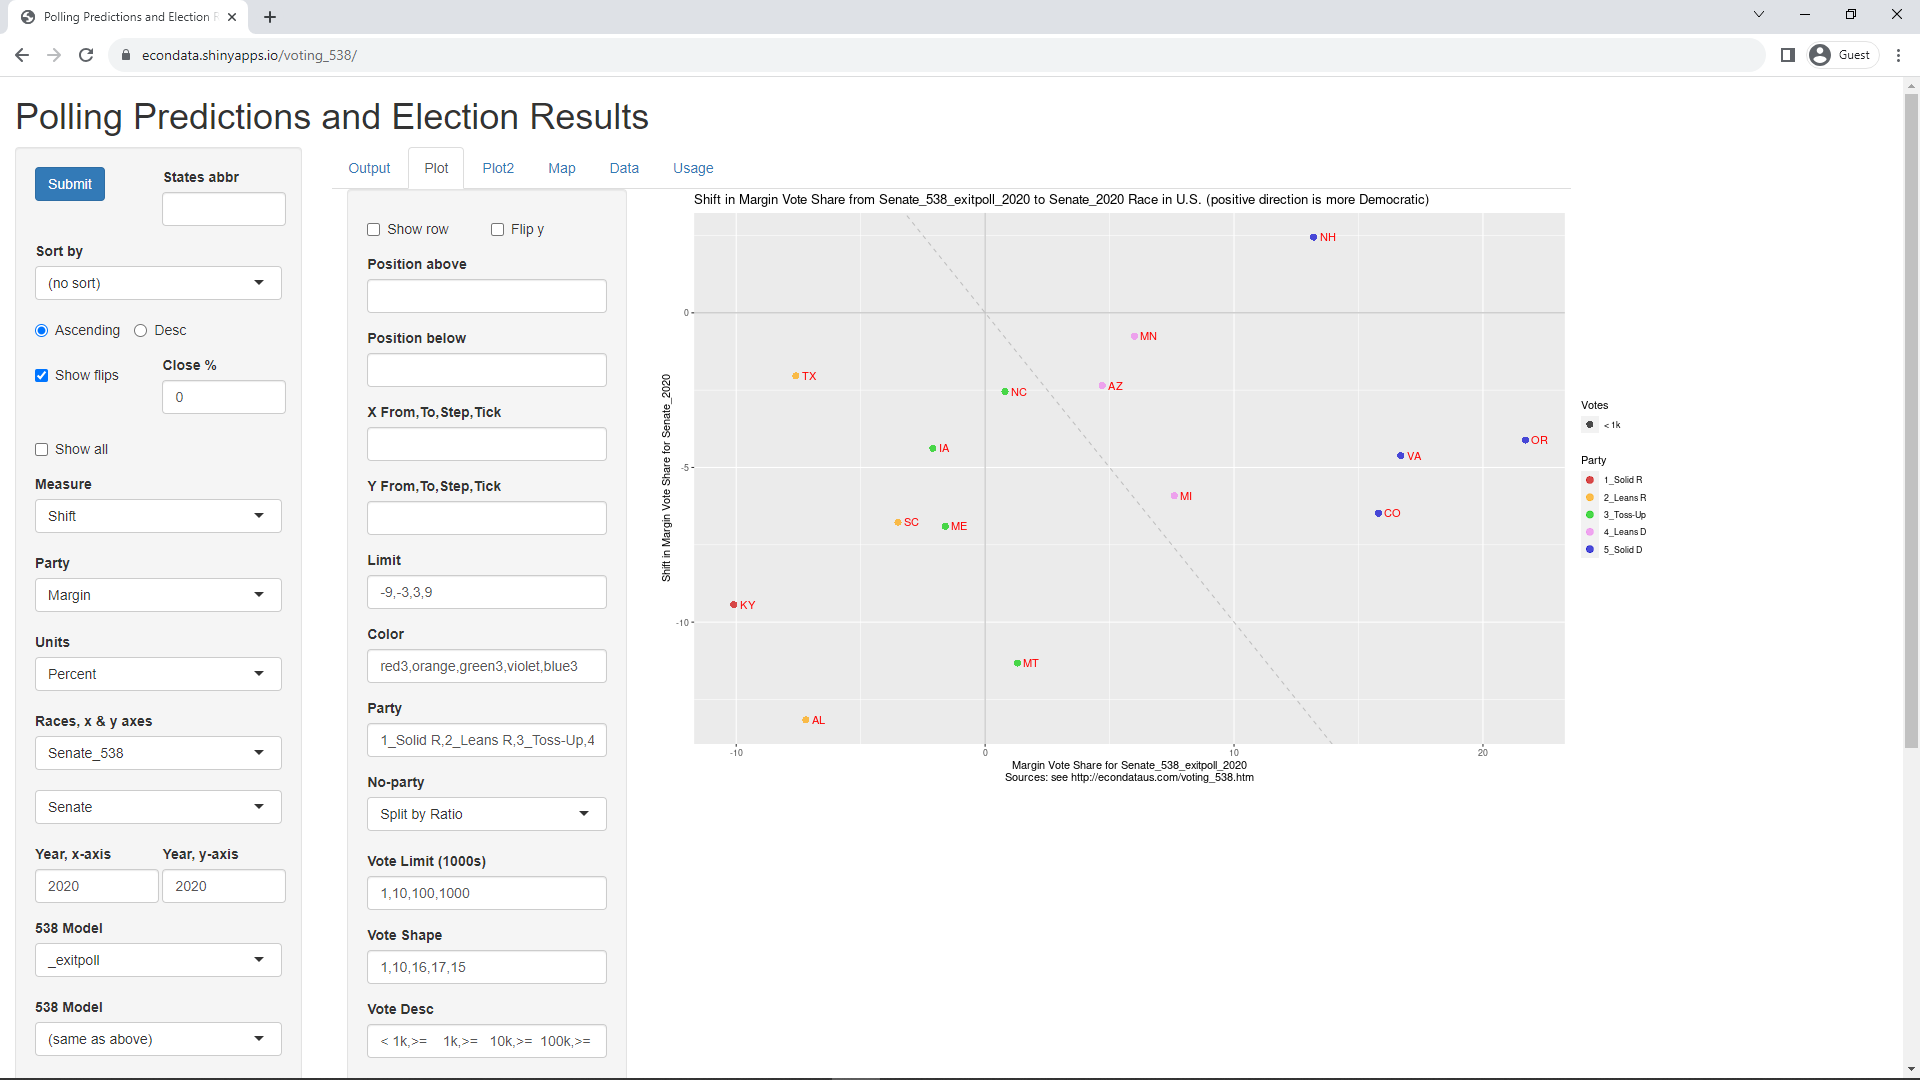
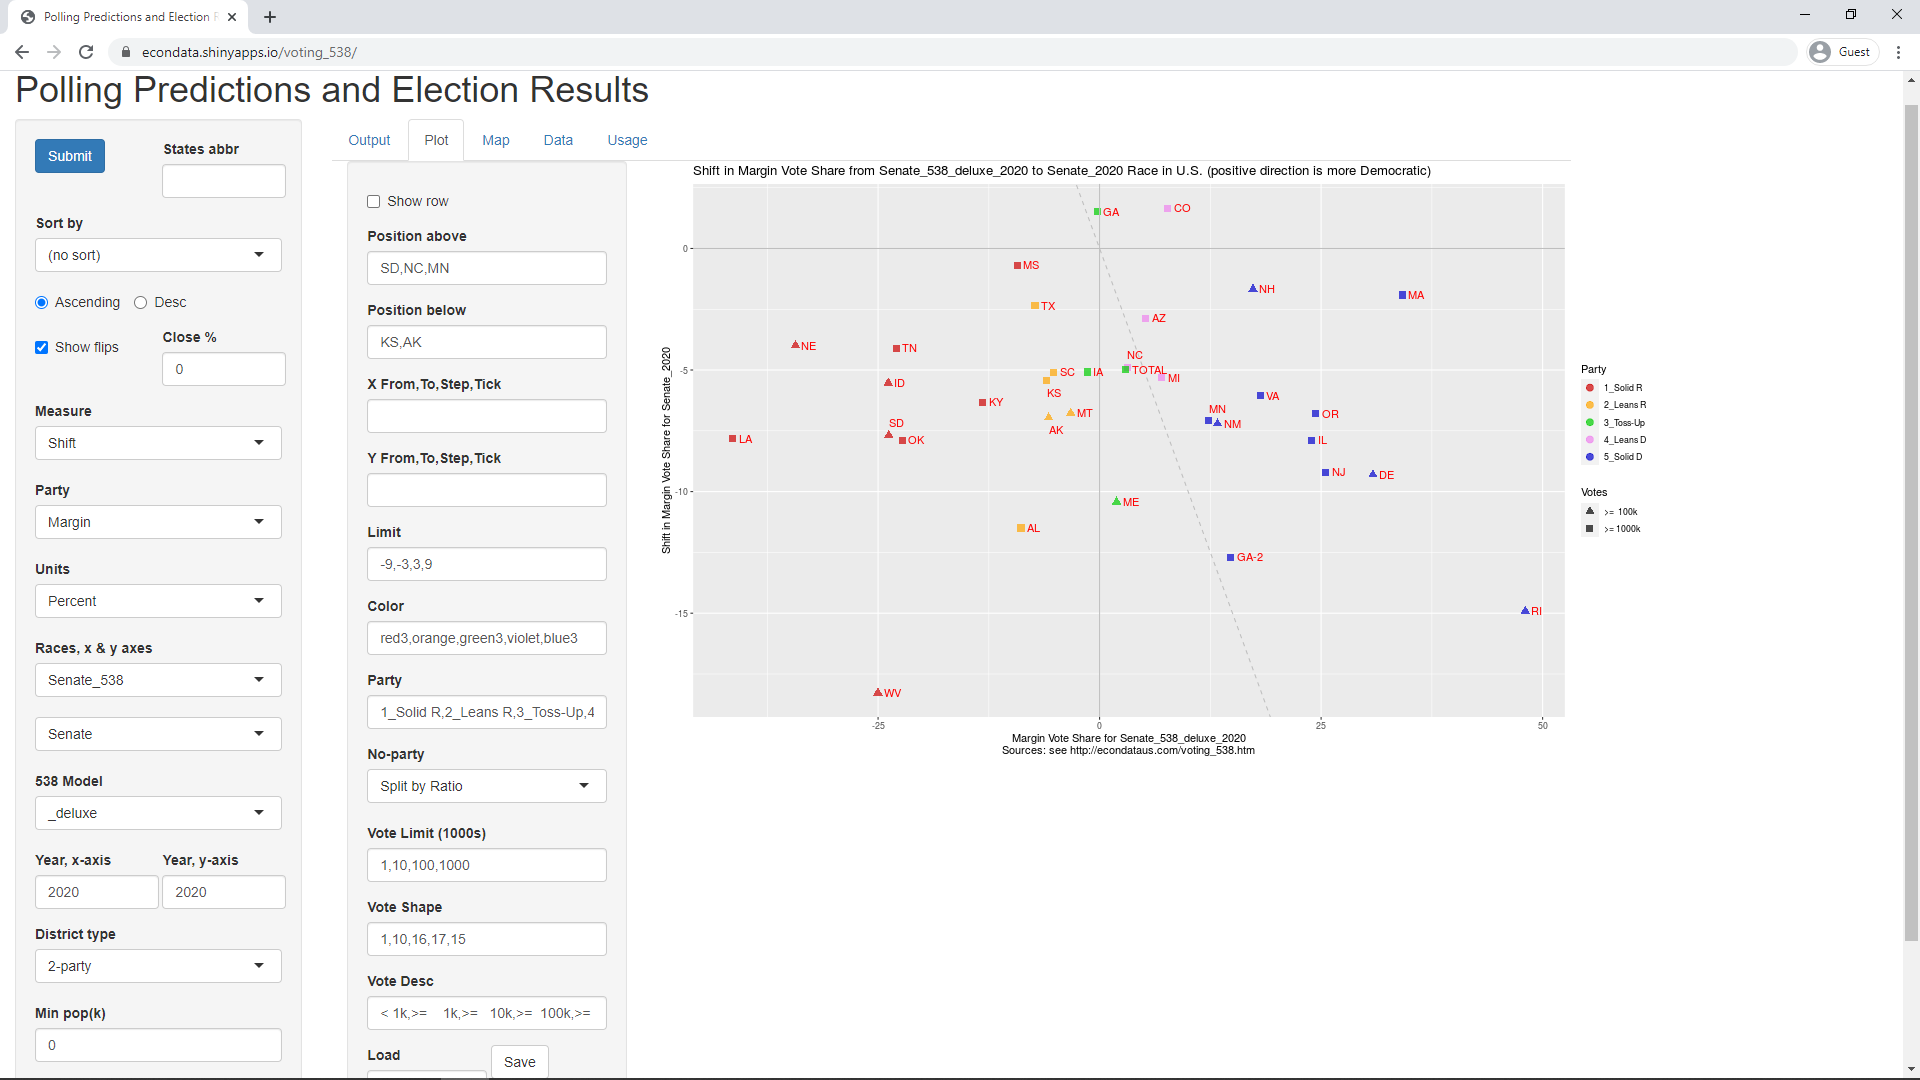
Clicking on the Plot tab will display the following plot:
As can be seen, Georgia (GA) is between the solid and dashed y-axes above the x-axis, indicating a flip from a prediction of a Republican win to an actual Democrat win. Maine (ME) and North Carolina (NC) are between the y-axes below the x-axis , indicating a flip from a prediction of a Democrat win to an actual Republican win. Also noteworthy is that all of the states except Colorado (CO) and Georgia (GA) are below the x-axis. This indicates that all of those states had red shifts whereby the actual results were more Republican than the predictions.
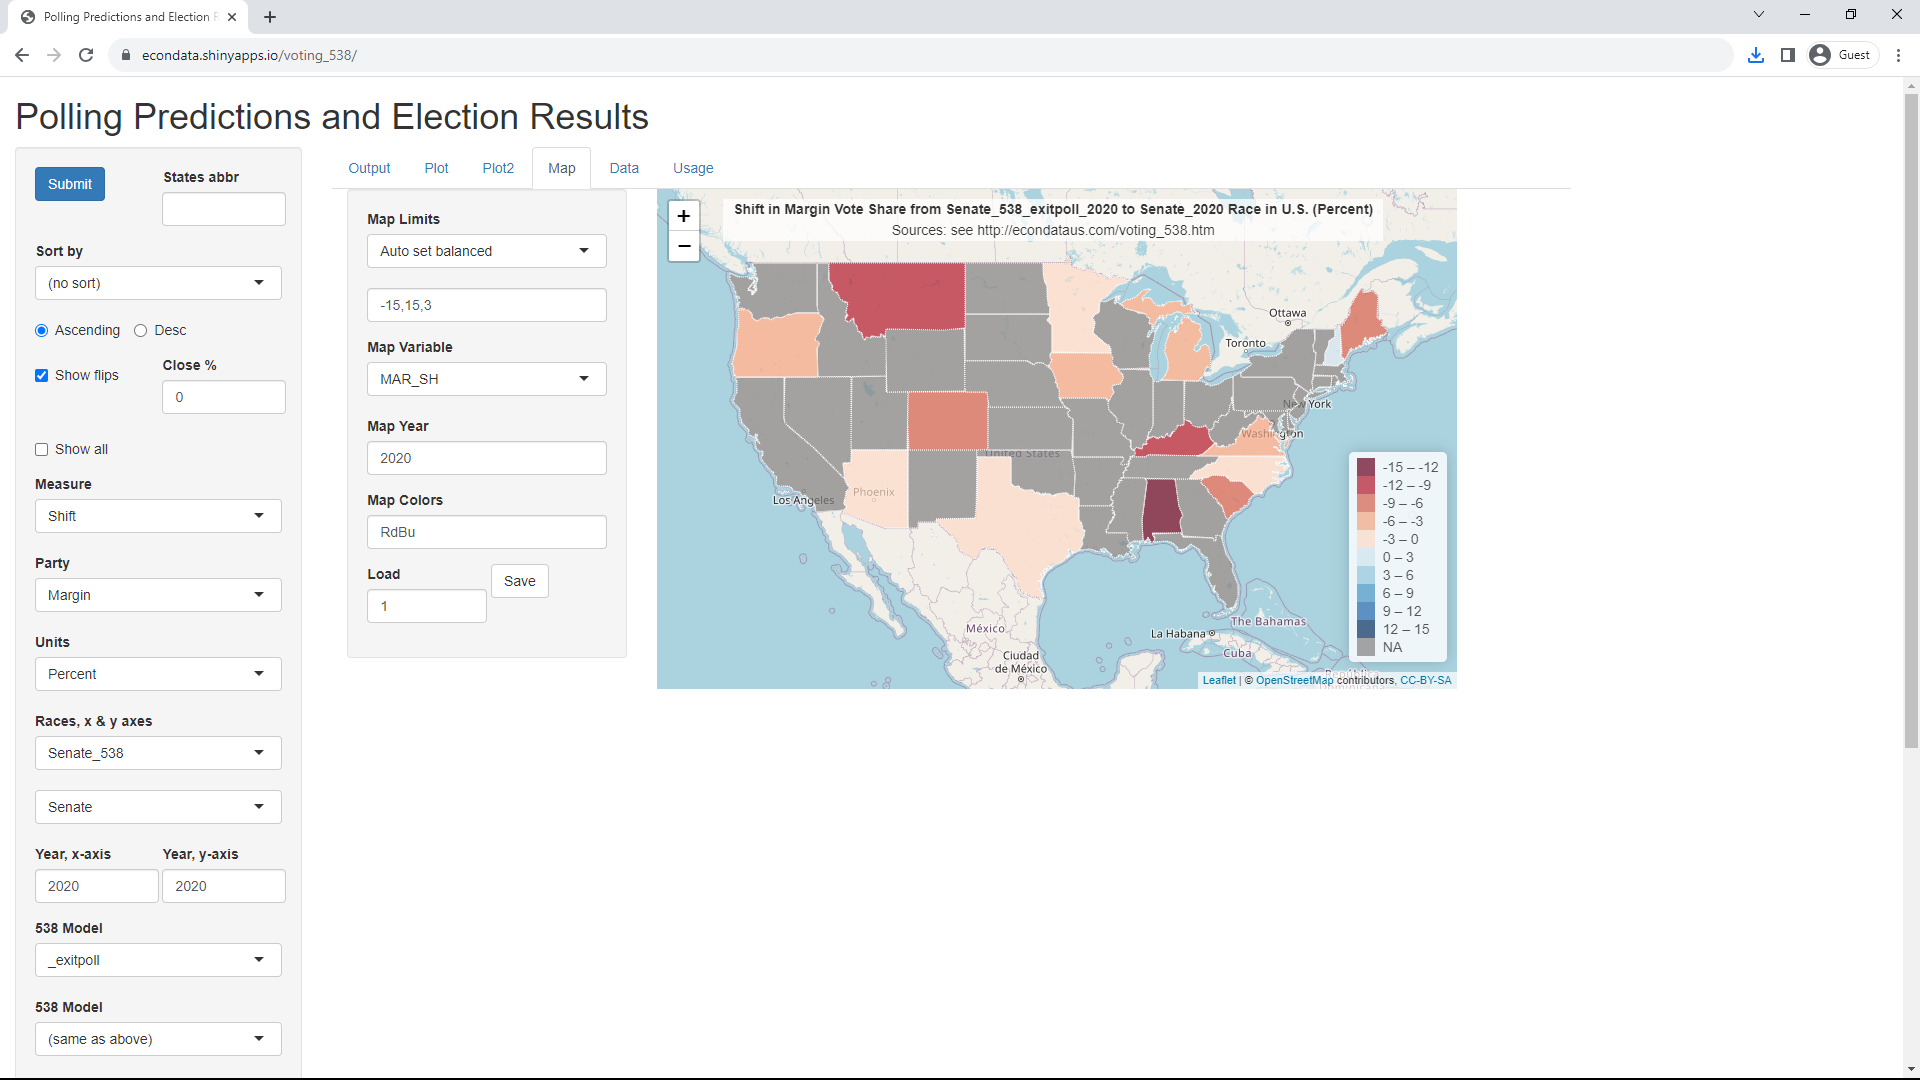
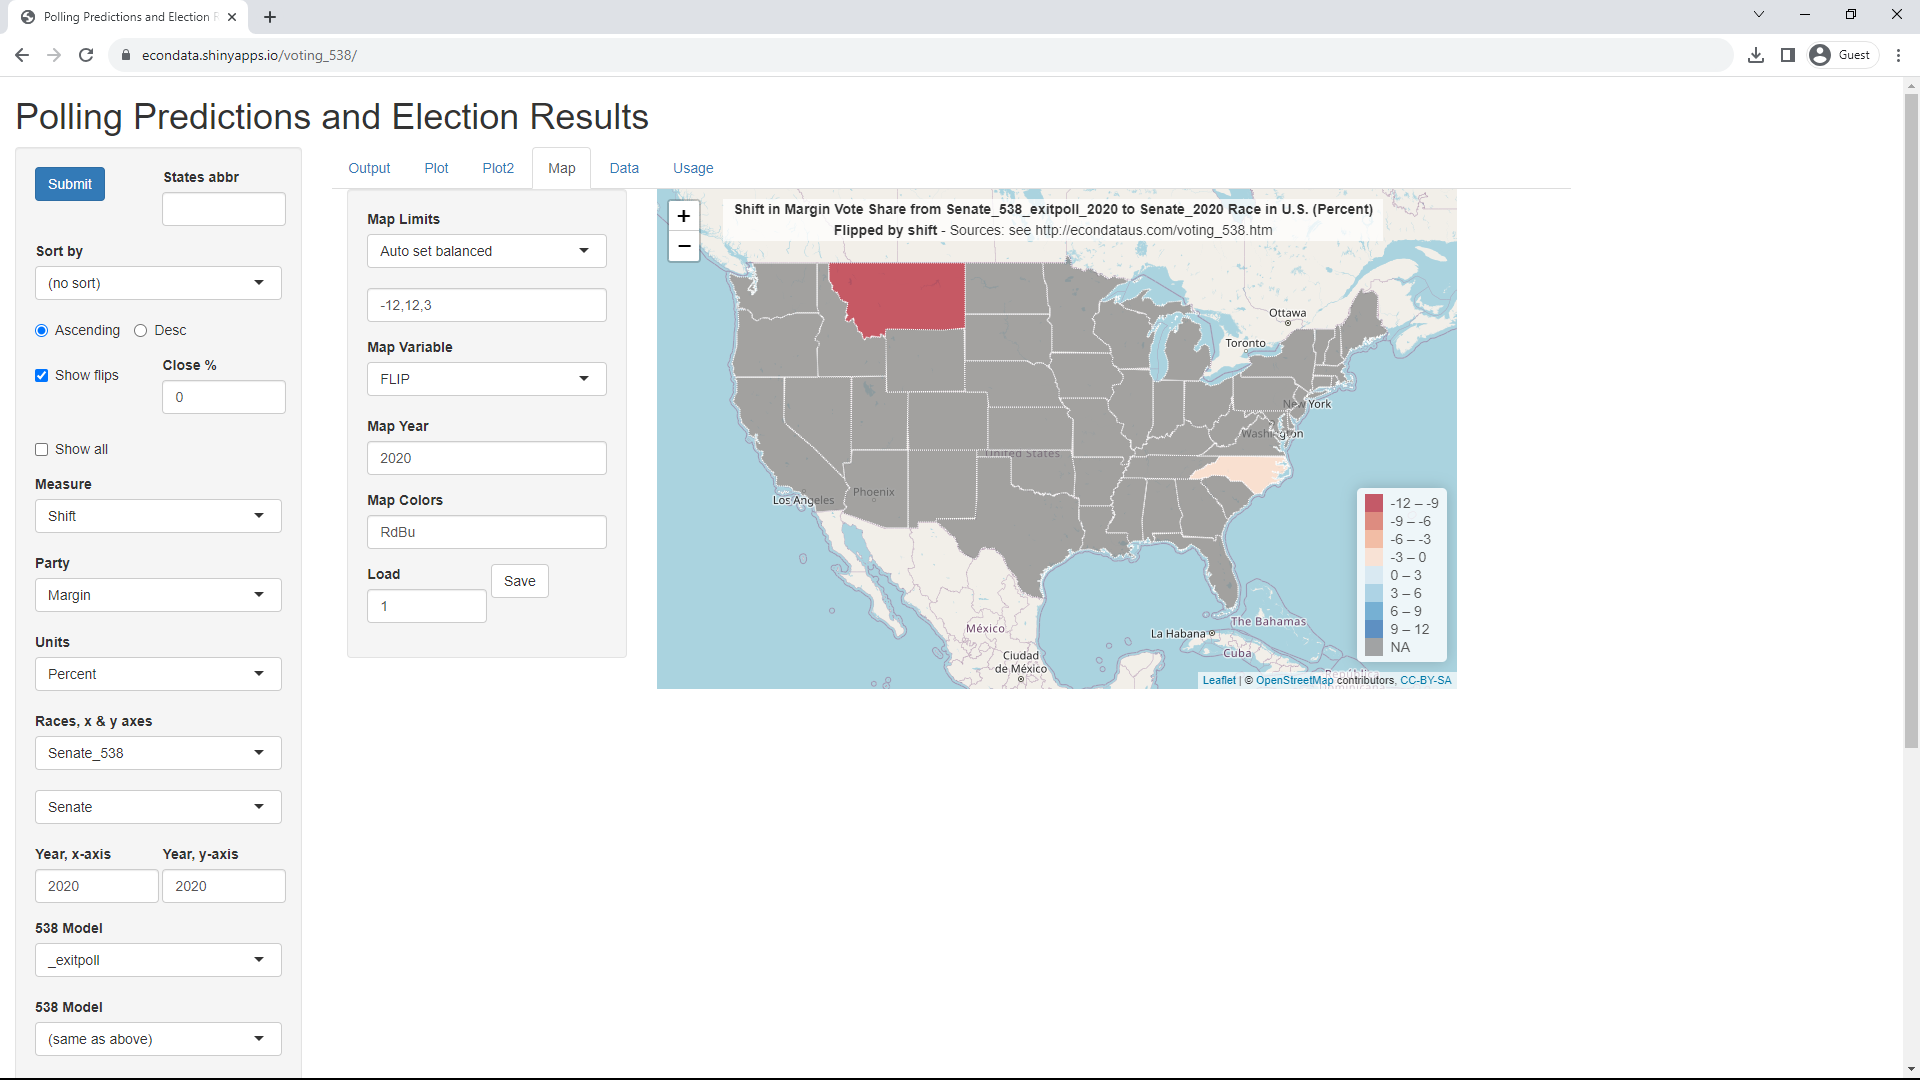
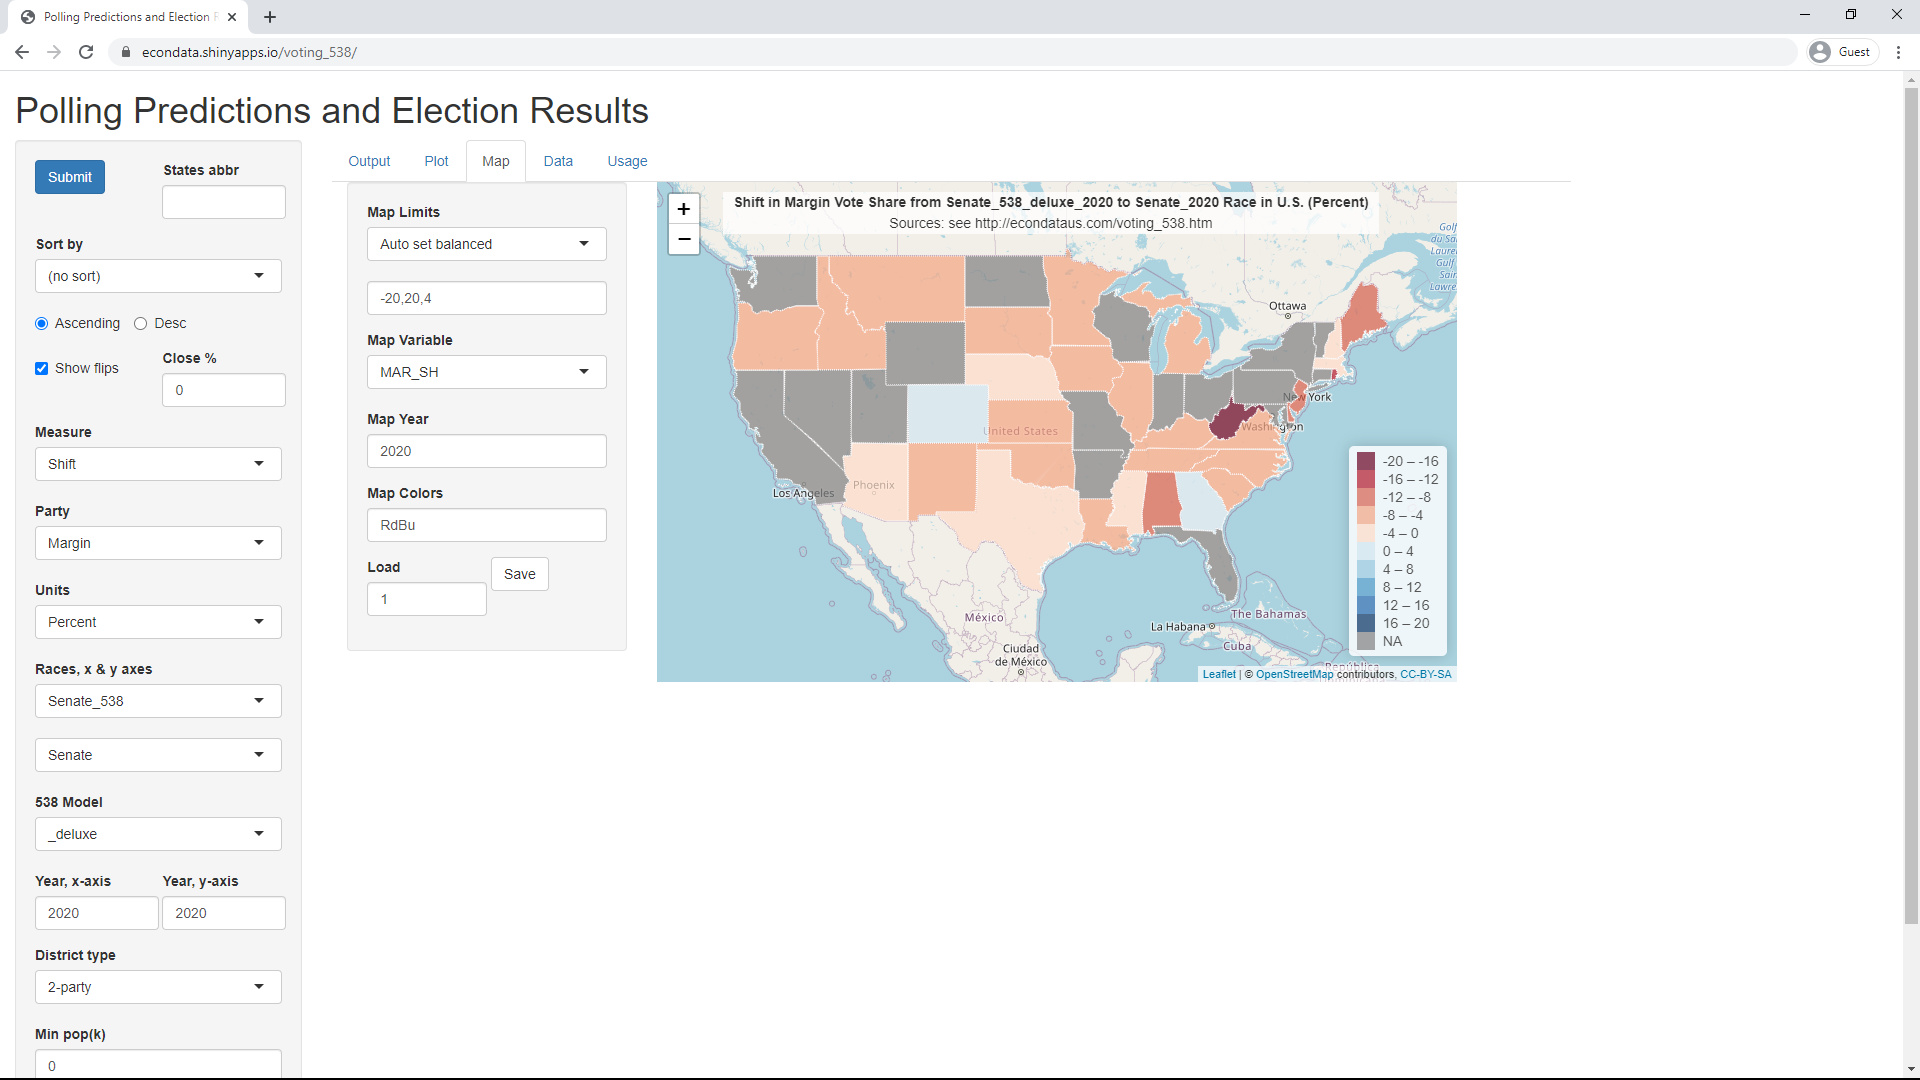
Clicking on the Map tab will display the following plot:
The gray states are those in which there was no Senate race in 2020. As can be seen, all of the states with Senate races had a red shift except for Colorado and Georgia. West Virginia and Rhode Island had especially strong red shifts -18.27 and -14.91 percent, respectively.
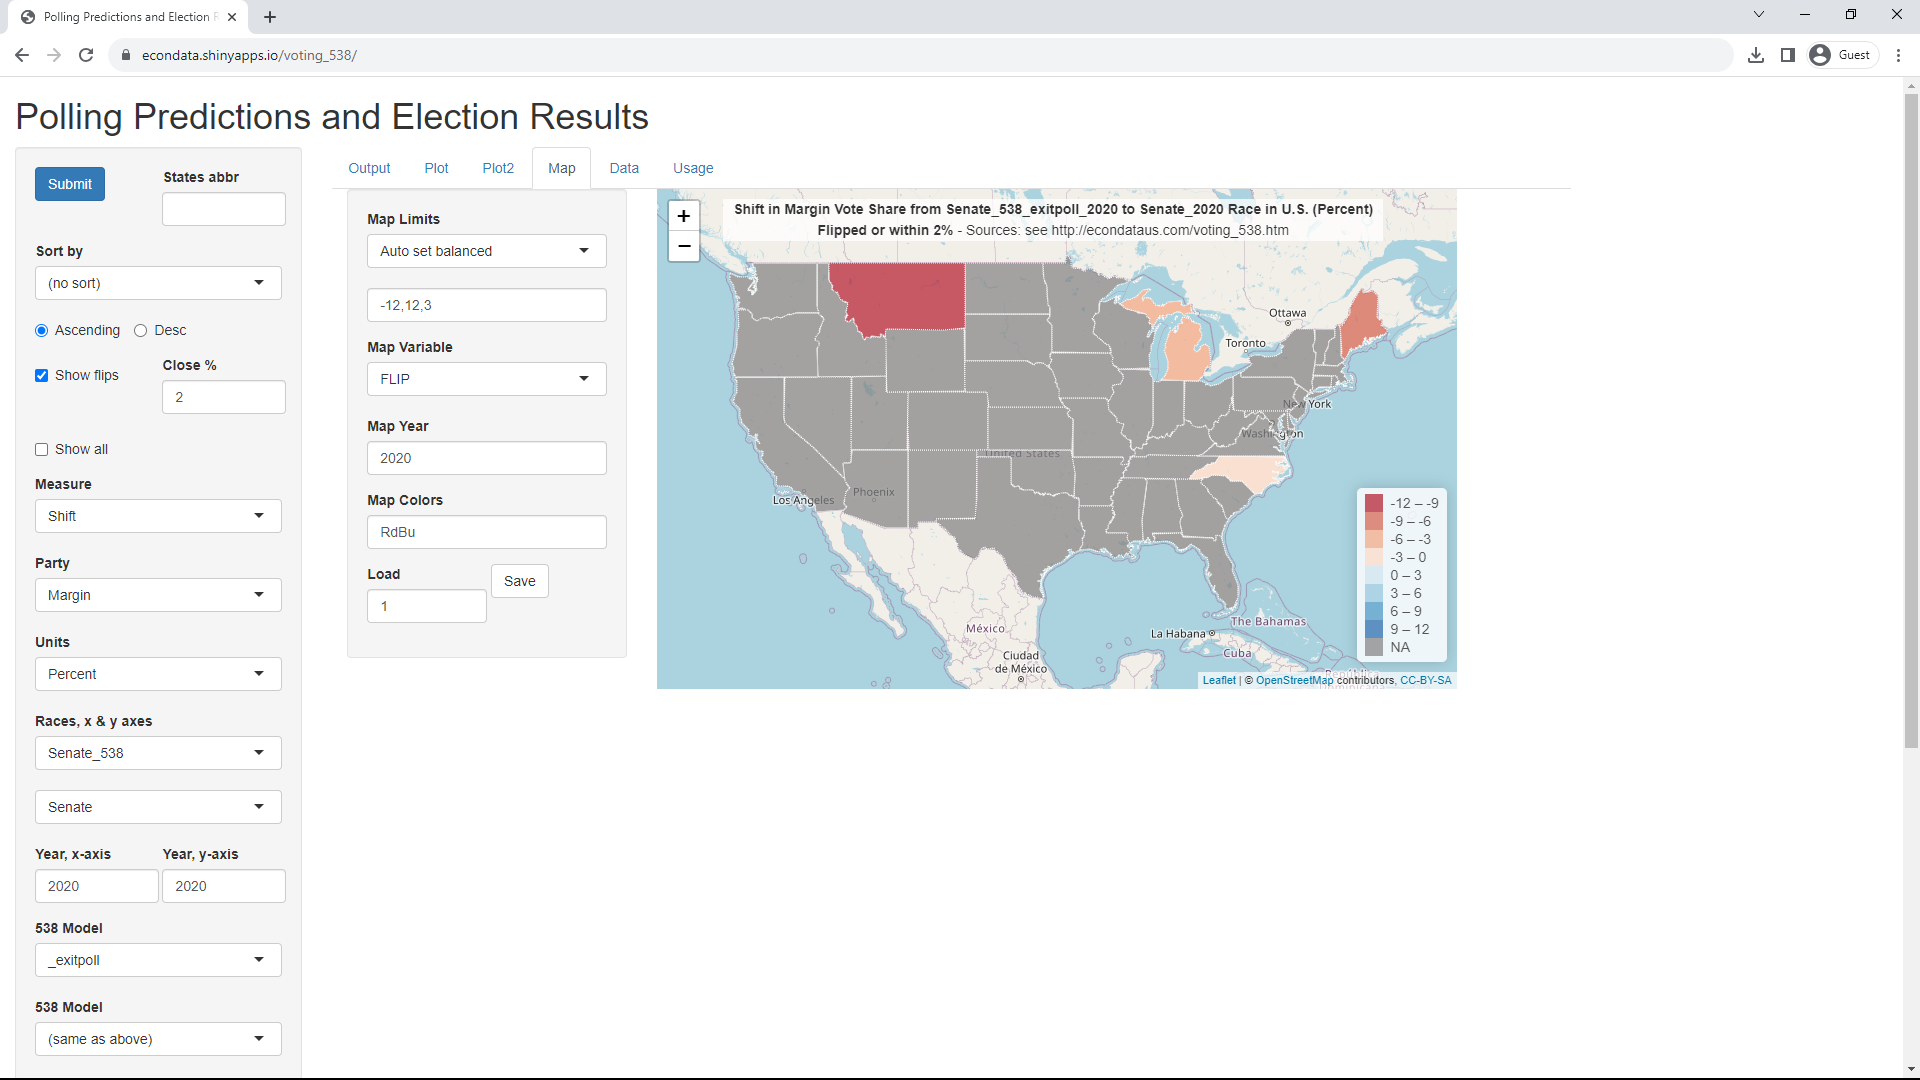
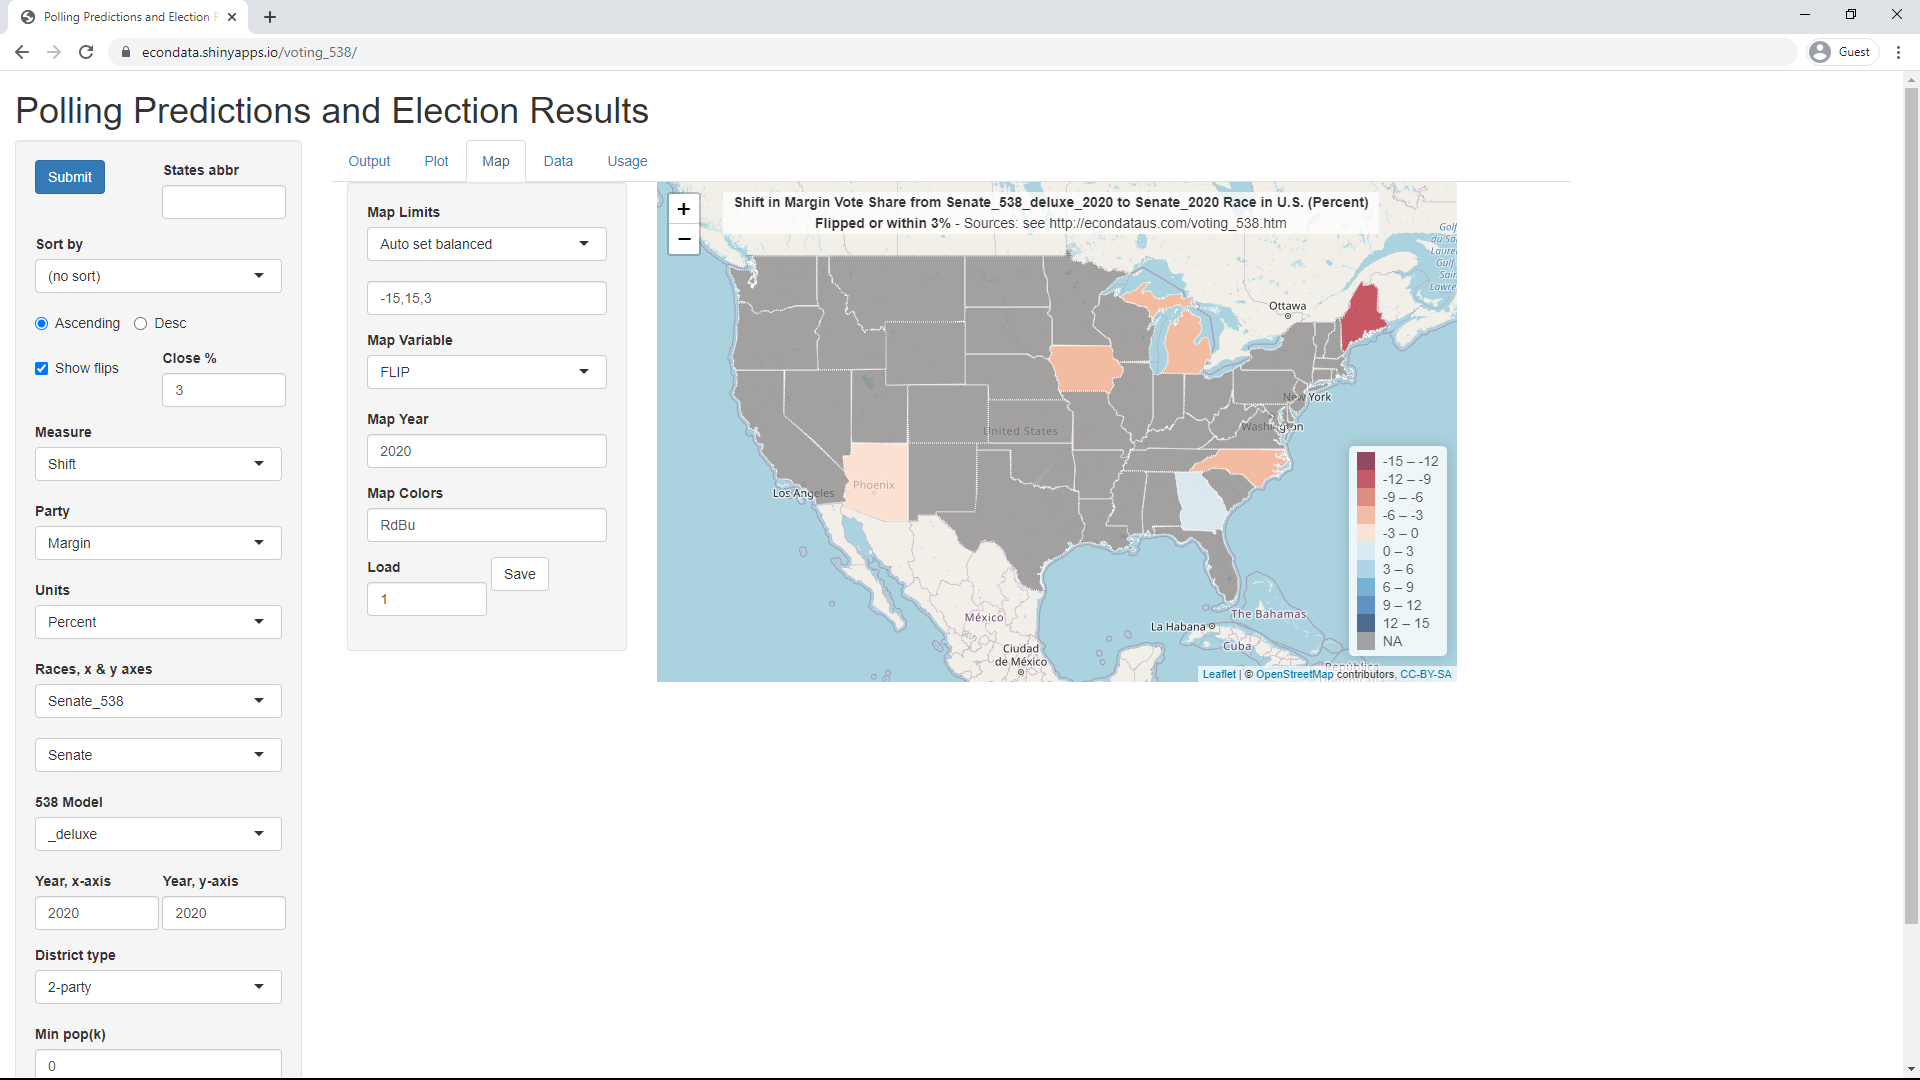
Changing the "Map Variable" to FLIP causes all of the states to become gray except for Georgia, Maine, and North Carolina. This is because Georgia was flipped by a blue shift and Maine and North Carolins were both flipped by the red shift from a predicted win for Democrats to an actual win for Republicans. Changing the field "Close %" on the leftmost panel from 0 to 0,3 causes Arizona and Michigan to also be colored red. This is because the actual vote margins for these 2 states were all within 3 percent. Finally, changing the field "Close %" to 3,3 (or just 3) causes Iowa to also be colored red. This is because it was predicted to have a margin of less than 3 percent. The red shift caused its final margins to be greater than 3 percent in the Republican's favor. Following is the screen at this point:
As can be seen, all 6 non-gray states except Georgia are some shade of red, indicating that there were red shifts from their predicted results to their actual results.
Change the two races following the "Races, x & y axes" to House_538 and House and make sure that "538 Model", "Year, x-axis", and "Year, y-axis" are set to _deluxe, 2020, and 2020, respectively. If you then click the Output tab, you will get the following table:
Clicking on the Plot tab will display the following plot:
As can be seen, the plot forms something of a barbell visual with the left end of it being a collection of solid Republican districts vertically centered close to the x-axis. The right end of the barbell is a collection of solid Democrat districts but it is vertically centered well below the x-axis. This suggests that the solid Republican districts are not shifted on average but that the solid Democrat districts are markedly red shifted on average. It's unclear what the cause of this is. One possible explanation is that the solid Democrat districts tend to be urban and those districts may experience more voter suppression. There may be more urban, Democrat voters who intended to vote but were dissuaded from doing so by long lines or other voting problems, purposeful or not. There may also have been more of such voters who thought that they had voted but whose votes were rejected due to non-matching signatures on mail-in ballots or problems with provisional ballots. Of course, some systematic flaw in the polling or some other election irregularities are also possible factors.
In order to take a closer look at those districts which flipped, it's possible to set the ranges of the x and y axes to focus in on them. These changes were in fact saved and can be recalled by changing the number in the "Load" input at the bottom of the second left-most panel to 3. This results in the following plot:
As can be seen, the Georgia district GA-7 is between the solid and dashed y-axes above the x-axis, indicating a flip from a prediction of a Republican win to an actual Democrat win. The other 18 flipped districts are all between the y-axes below the x-axis , indicating a flip from a prediction of a Democrat win to an actual Republican win. The three districts with the largest red shifts include two districts near Miami, Florida (one which was held by Donna Shalala, the former Secretary of Health and Human Services under Bill Clinton from 1993 to 2001). The other one of the 3 was the one of the 4 Iowas districts.
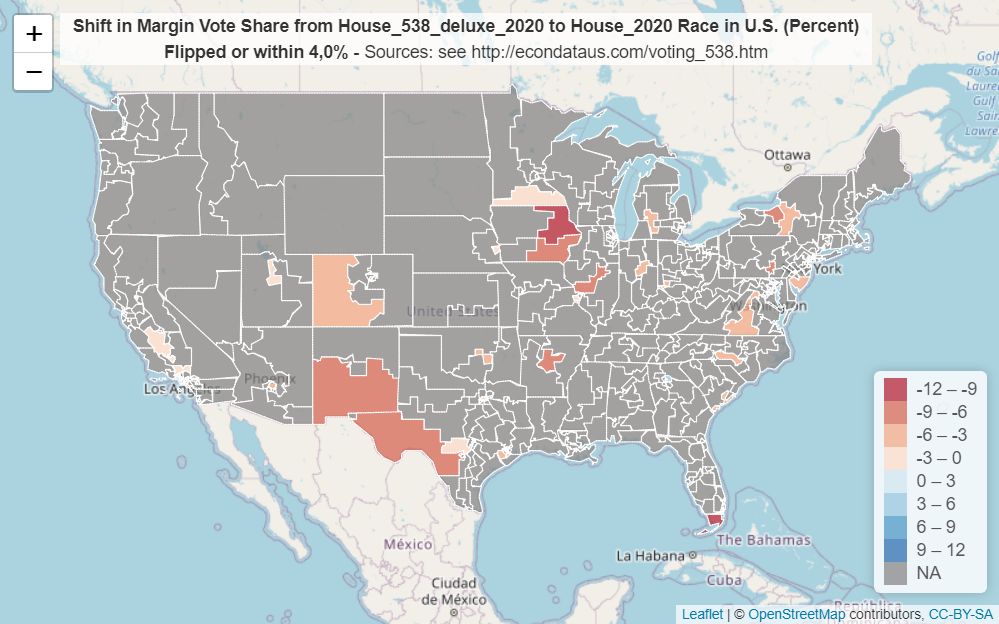
Clicking on the Map tab will display the following plot:
The gray areas are districts in which there were not both Democrat and Republican candidates. These can be seen in the prior long table as those where either the DEM1 or REP1 columns contain 0.00. As can be seen, all 6 non-gray states except Georgia are some shade of red, indicating that there were red shifts from their predicted results to their actual results. As can be seen, some of the strongest red shifts occurred in south Texas, west Mississippi, the Miami Florida area, Iowas, and other locations. The most noticeable blue shifts occurred in Georgia and Louisiana.
Changing the "Map Variable" to FLIP causes all of the districts to become gray except for the 19 which "flipped". Nearly all of these show red shifts, most notably in south Texas and New Mexico, east Iowa, and the Miami, Florida area. Changing the field "Close %" on the leftmost panel from 0 to 0,3 causes another of Iowa's 4 districts to turn red, along with some other districts. This is because the actual vote margins for these districts were all within 3 percent. Finally, changing the field "Close %" to 3,3 (or just 3) causes other districts to turn red, most noticeably in west Colorado, south Minnesota, and central Virginia. This is because they were predicted to have a margin of less than 3 percent. The red shift caused its final margins to be greater than 3 percent in the Republican's favor. Following is the screen at this point:
To get a better idea of what districts were close, it may be useful to refer to the prior long table since some of the smaller districts may not be easily visible. Once those districts have been identified, you can pan to their location and zoom in on them with the + button in the upper left of the map.
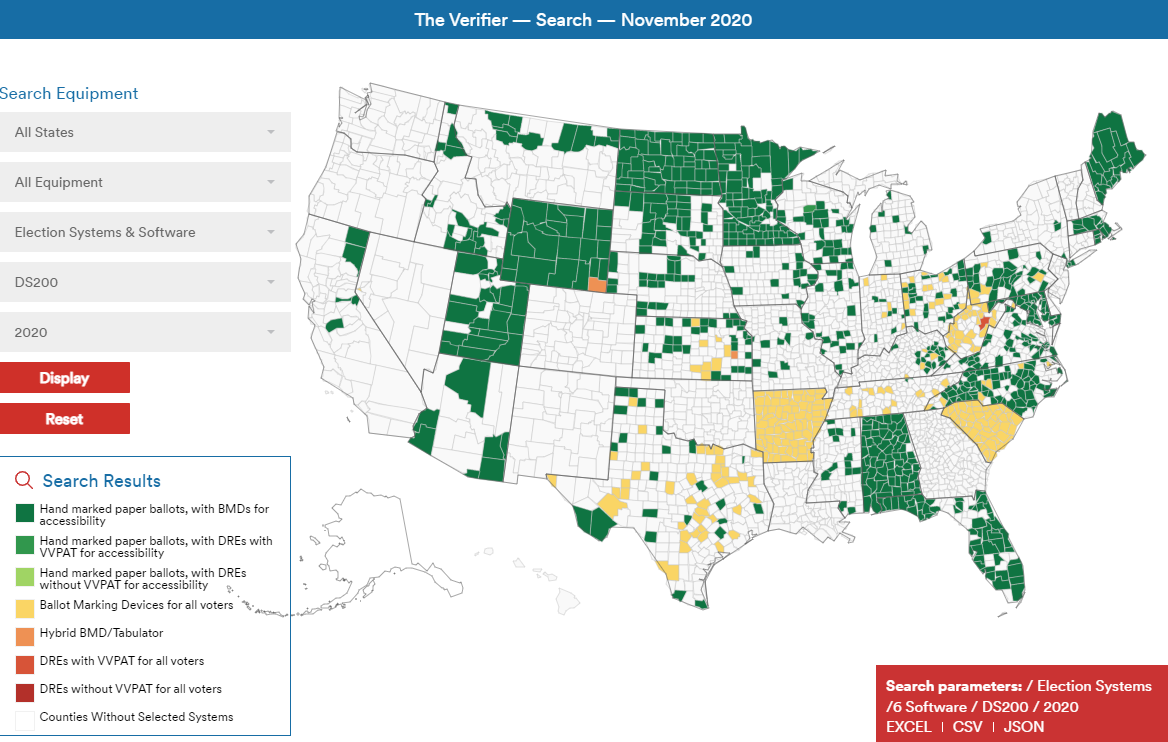
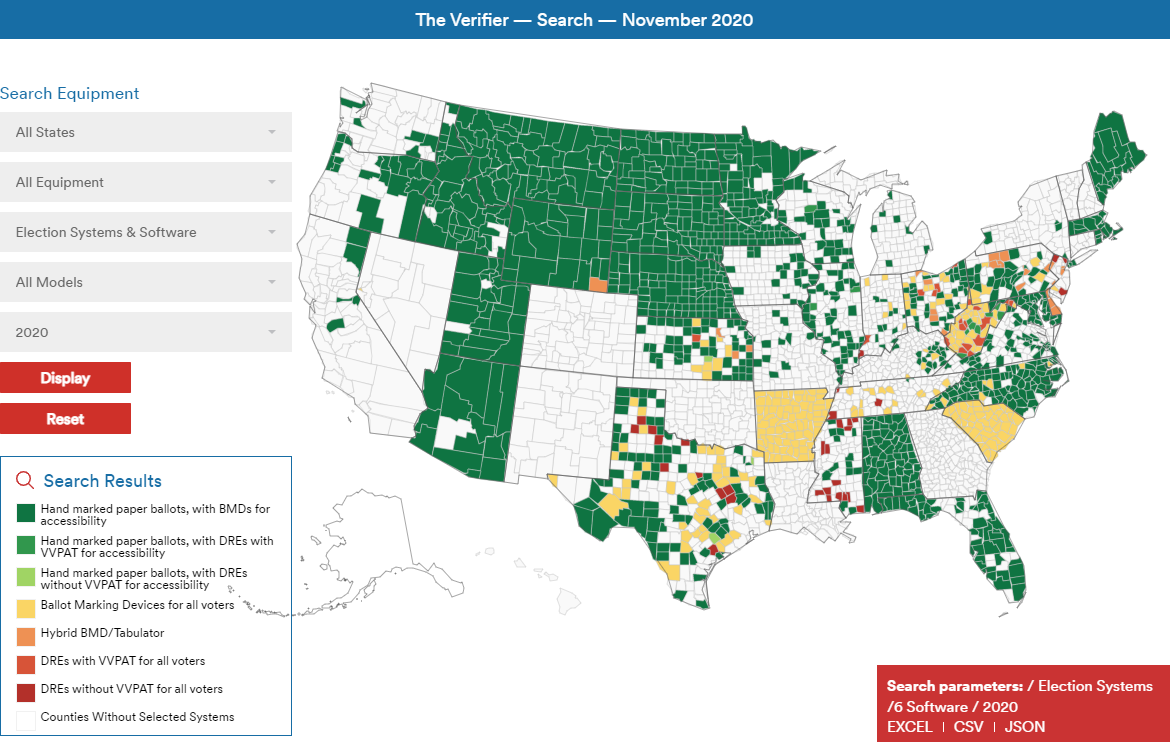
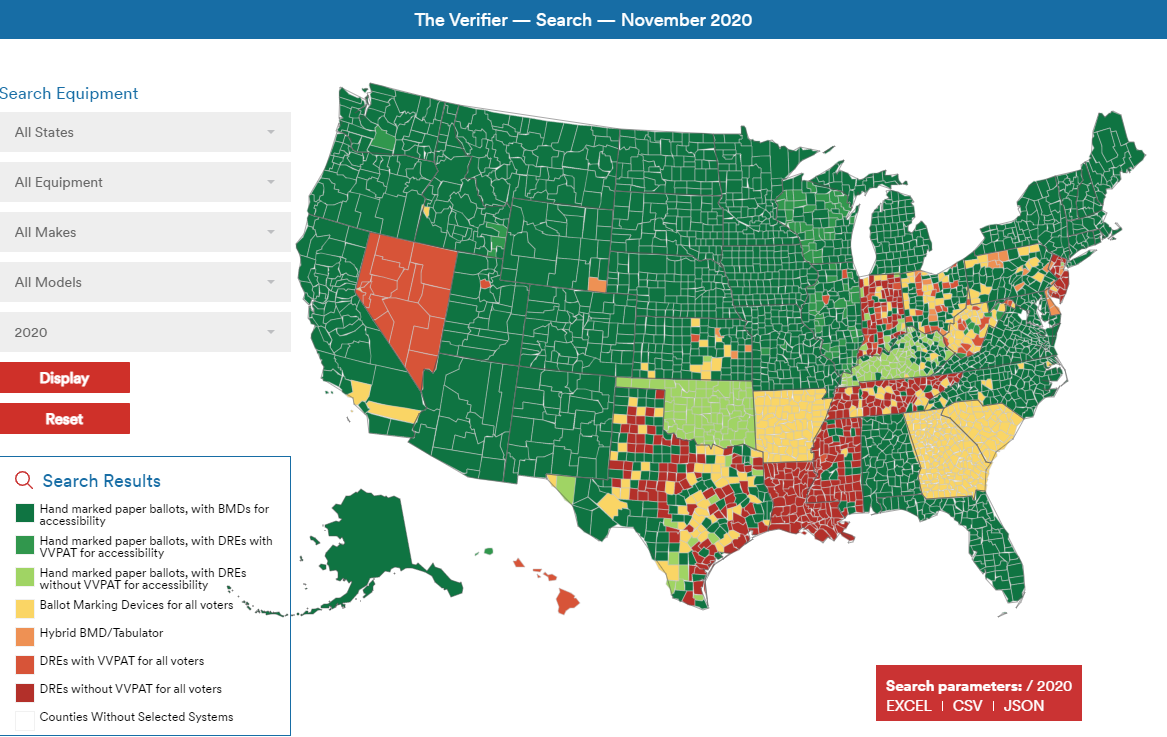
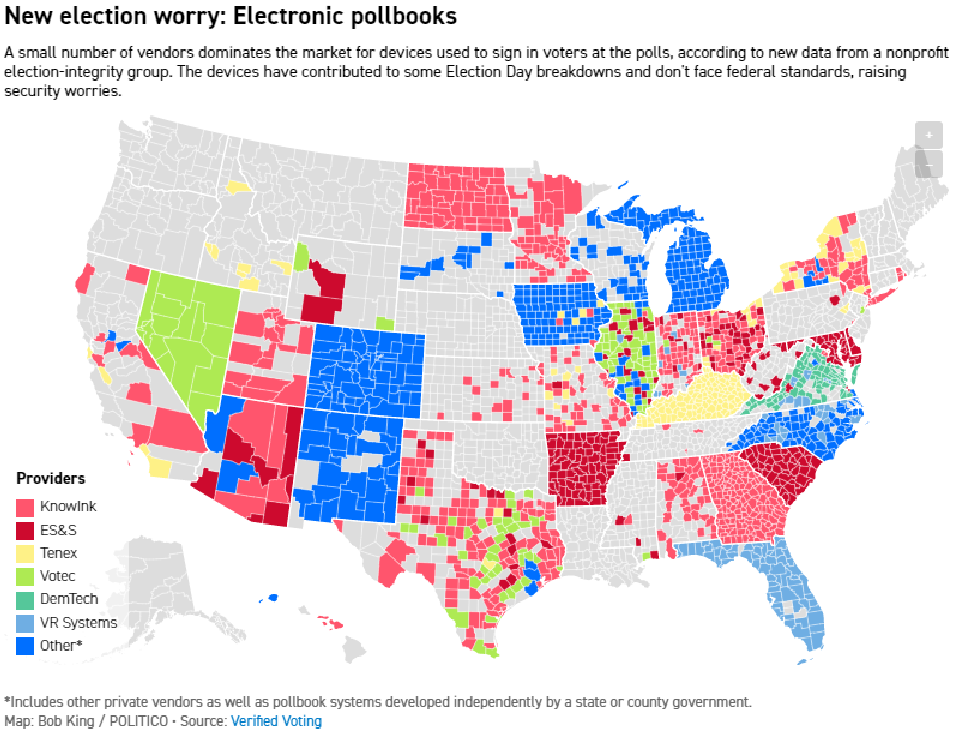
The following table shows the main polling place equipment used in the key counties (those with the most votes) in house races that flipped between the 538 predictions and the actual results:
Getting a Map of the Shift via the Map Tab

Comparing the Actual Election Results of Two Races
Getting the Races and Years Available via the Data Tab
               Race 2020 2016 2012
1         President   52   52   52
2     President_538   57    0    0
3            Senate   36    0    0
4 Senate_538_deluxe   36    0    0
5             House  436    0    0
6  House_538_deluxe  436    0    0

              Saved Params 2020 2016 2012
1          Plot__President    0   24   12
2      Plot__President_538   24    0    0
3  Plot__Senate_538_deluxe   12    0    0
4   Plot__House_538_deluxe   36    0    0
5 Plot_CA_House_538_deluxe   12    0    0
6       Map__President_538   10    0    0
7   Map__Senate_538_deluxe    5    0    0
8    Map__House_538_deluxe    5    0    0
As can be seen, the app currently has data for the 2020, 2016, and 2012 Presidential race. It also has data for the predictions from FiveThirtyEight for the 2020 Presidential Election. For the Senate, it currently has the final results of the 2020 Senate races and of the _deluxe model for the 2020 Senate races from FiveThirtyEight. The Senate and House predictions from FiveThirtyEight have a _lite, _classic, and _deluxe model. For the House, the app currently has the final results of the 2020 House races and of the _deluxe model for the 2020 House races from FiveThirtyEight. The table shows the number of data records in each data set. As can be seen, the numbers are the same between the predictions and actual results for the Senate and House but differ for the President. That's because the FiveThirtyEight data includes vote counts for ME-1 and ME-2 in Maine and for NE-1, NE-2, and NE-3. The data for the final results does not contain these areas so they are ignored when comparing the predictions and that race.
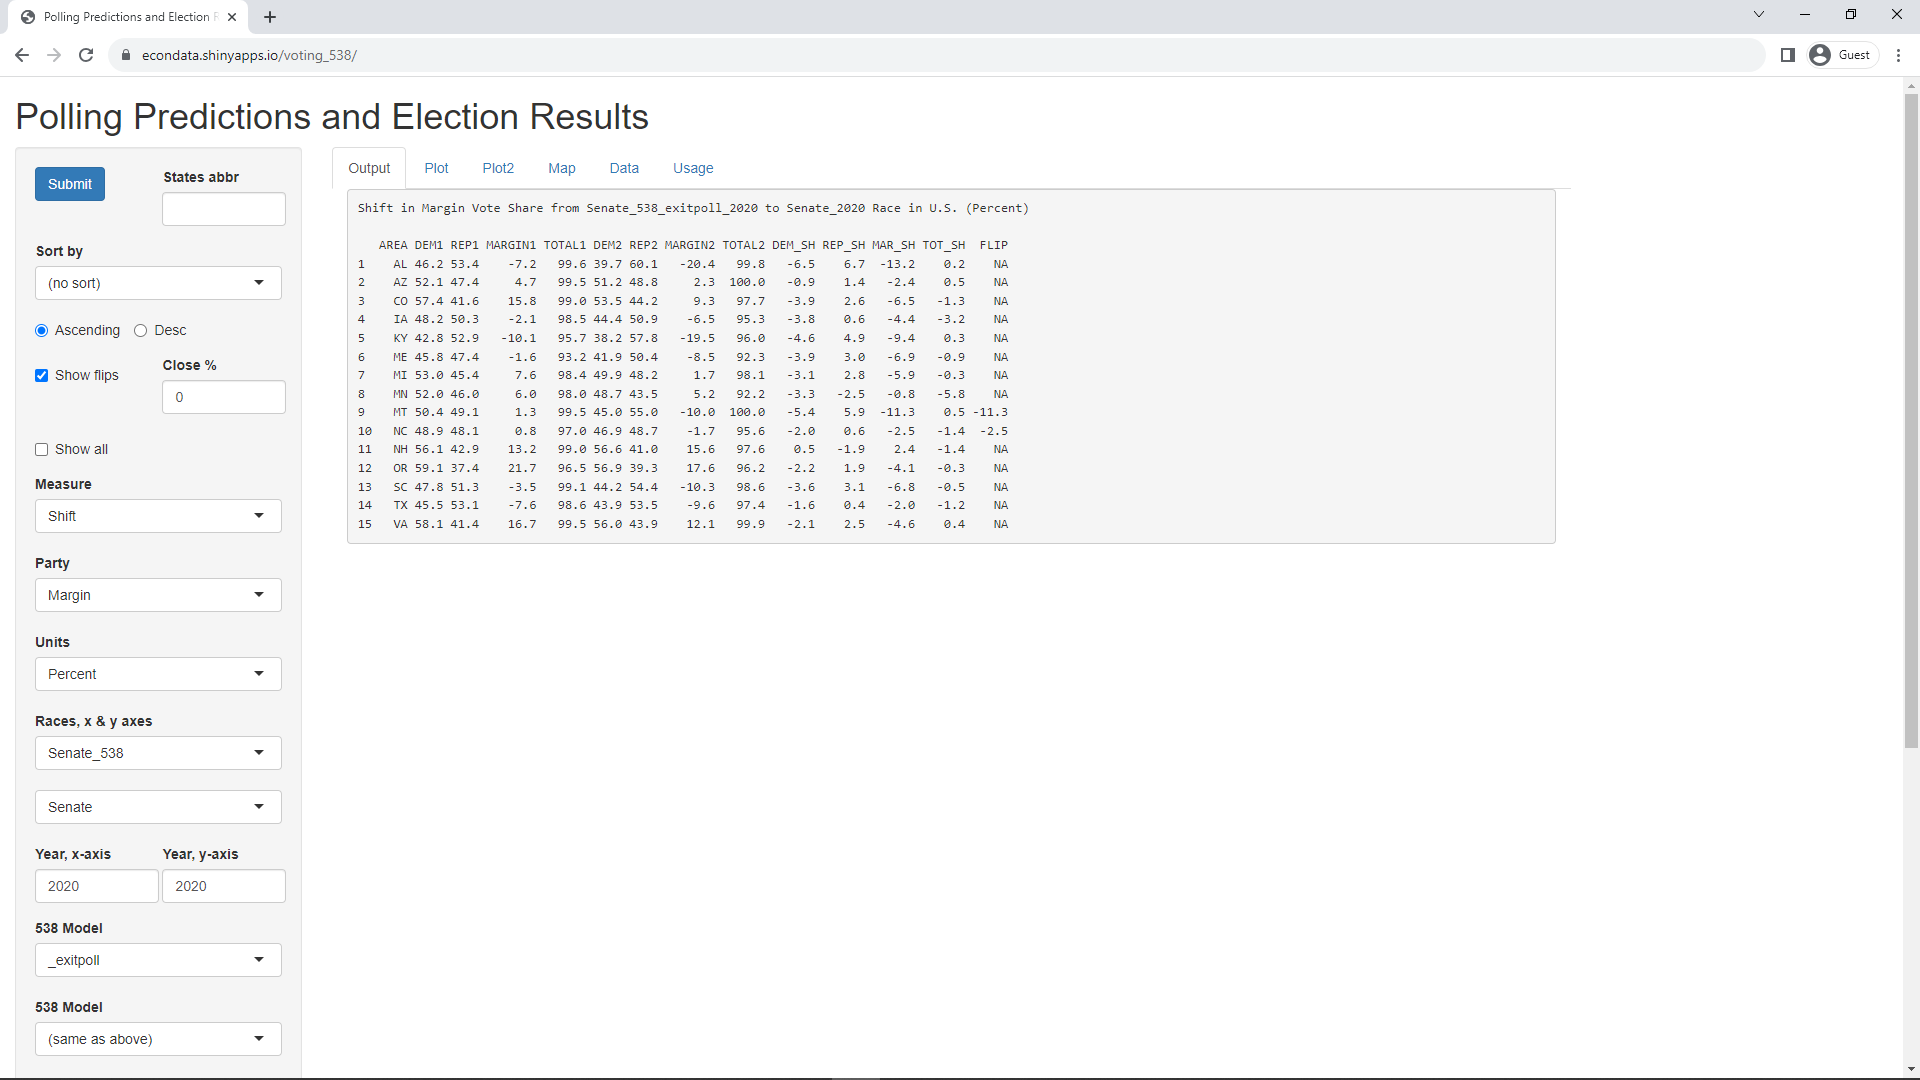
Comparing the Senate Predictions and Results via the Output Tab
Shift in Margin Vote Share from Senate_538_deluxe_2020 to Senate_2020 Race in U.S. (Percent)

    AREA  DEM1   REP1 MARGIN1 TOTAL1  DEM2  REP2 MARGIN2 TOTAL2 DEM_SH REP_SH MAR_SH  TOT_SH   FLIP
1     AK 44.61  50.36   -5.75  94.97 41.19 53.90  -12.70  95.09  -3.42   3.54  -6.96    0.12     NA
2     AL 45.57  54.43   -8.86 100.00 39.74 60.10  -20.36  99.83  -5.83   5.66 -11.49   -0.17     NA
3     AR  0.00 100.00 -100.00 100.00  0.00 66.53  -66.53  66.53   0.00 -33.47  33.47  -33.47     NA
4     AZ 52.61  47.39    5.22 100.00 51.16 48.81    2.35  99.98  -1.45   1.43  -2.87   -0.02     NA
5     CO 51.66  43.99    7.67  95.65 53.50 44.18    9.32  97.68   1.84   0.19   1.66    2.03     NA
6     DE 63.95  33.10   30.85  97.05 59.44 37.90   21.54  97.34  -4.51   4.79  -9.30    0.28     NA
7     GA 49.86  50.14   -0.28 100.00 50.62 49.38    1.23 100.00   0.76  -0.76   1.51    0.00   1.51
8   GA-2 44.81  30.03   14.78  74.85 51.04 48.96    2.09 100.00   6.23  18.92 -12.69   25.15     NA
9     IA 48.16  49.56   -1.40  97.72 44.40 50.88   -6.48  95.28  -3.76   1.32  -5.08   -2.44     NA
10    ID 34.85  58.69  -23.85  93.54 33.25 62.62  -29.38  95.87  -1.60   3.93  -5.53    2.33     NA
11    IL 59.45  35.49   23.96  94.95 54.93 38.87   16.07  93.80  -4.52   3.37  -7.89   -1.15     NA
12    KS 47.00  53.00   -5.99 100.00 41.79 53.22  -11.44  95.01  -5.22   0.23  -5.45   -4.99     NA
13    KY 43.39  56.61  -13.21 100.00 38.23 57.76  -19.53  96.00  -5.16   1.16  -6.32   -4.00     NA
14    LA 24.11  65.51  -41.40  89.63 23.23 72.45  -49.22  95.68  -0.88   6.94  -7.82    6.05     NA
15    MA 65.68  31.51   34.17  97.19 64.46 32.20   32.26  96.65  -1.22   0.69  -1.91   -0.53     NA
16    ME 50.96  49.04    1.91 100.00 41.92 50.42   -8.50  92.34  -9.04   1.38 -10.42   -7.66 -10.42
17    MI 52.30  45.30    7.01  97.60 49.90 48.22    1.69  98.12  -2.40   2.92  -5.32    0.52     NA
18    MN 54.79  42.47   12.32  97.26 48.74 43.50    5.24  92.23  -6.05   1.03  -7.08   -5.02     NA
19    MS 45.36  54.64   -9.28 100.00 44.13 54.11   -9.98  98.23  -1.23  -0.54  -0.69   -1.77     NA
20    MT 48.37  51.63   -3.26 100.00 44.99 55.01  -10.02 100.00  -3.38   3.38  -6.76    0.00     NA
21    NC 50.49  47.35    3.14  97.83 46.94 48.69   -1.75  95.63  -3.55   1.34  -4.89   -2.21  -4.89
22    NE 32.84  67.16  -34.32 100.00 24.43 62.74  -38.31  87.17  -8.41  -4.42  -3.99  -12.83     NA
23    NH 58.66  41.34   17.32 100.00 56.64 40.99   15.65  97.62  -2.02  -0.35  -1.67   -2.38     NA
24    NJ 61.54  36.03   25.51  97.57 57.23 40.92   16.31  98.15  -4.31   4.89  -9.21    0.58     NA
25    NM 56.65  43.35   13.31 100.00 51.73 45.62    6.11  97.35  -4.93   2.28  -7.20   -2.65     NA
26    OK 37.45  59.72  -22.27  97.17 32.75 62.91  -30.16  95.67  -4.70   3.19  -7.89   -1.51     NA
27    OR 60.27  35.89   24.38  96.16 56.91 39.32   17.59  96.24  -3.35   3.43  -6.79    0.08     NA
28    RI 74.02  25.98   48.04 100.00 66.48 33.35   33.12  99.83  -7.54   7.37 -14.91   -0.17     NA
29    SC 47.42  52.58   -5.17 100.00 44.17 54.44  -10.27  98.60  -3.25   1.85  -5.10   -1.40     NA
30    SD 38.10  61.90  -23.79 100.00 34.26 65.74  -31.47 100.00  -3.84   3.84  -7.68    0.00     NA
31    TN 36.62  59.55  -22.93  96.17 35.16 62.20  -27.04  97.36  -1.46   2.65  -4.10    1.19     NA
32    TX 45.26  52.55   -7.29  97.82 43.87 53.51   -9.64  97.38  -1.39   0.95  -2.35   -0.44     NA
33    VA 58.16  40.03   18.14  98.19 55.99 43.91   12.08  99.90  -2.17   3.88  -6.05    1.71     NA
34    WV 37.49  62.51  -25.01 100.00 27.00 70.28  -43.28  97.28 -10.49   7.78 -18.27   -2.72     NA
35    WY 32.30  67.70  -35.40 100.00  0.00  0.00    0.00   0.00 -32.30 -67.70  35.40 -100.00  35.40
36 TOTAL 49.90  46.98    2.92  96.88 47.19 49.26   -2.07  96.45  -2.71   2.28  -4.99   -0.44  -4.99

Source: 538 data: Model outputs - Click "Model outputs" (after "Download the data") to download
        election-forecasts-2020.zip, unzip, use file senate_state_toplines_2020.csv
        Actual data: U.S. Senate 1976-2020 - download 1976-2020-senate.tab
If you change "Units" from Percent to Count, you will get the following actual vote counts:
Shift in Margin Votes from Senate_538_deluxe_2020 to Senate_2020 Race in U.S. (Count)

    AREA         DEM1         REP1      MARGIN1       TOTAL1       DEM2       REP2    MARGIN2     TOTAL2      DEM_SH       REP_SH        MAR_SH       TOT_SH          FLIP
1     AK    158,166.6    178,539.9   -20,373.36    354,533.9    146,068    191,112    -45,044    354,587  -12,098.58    12,572.06    -24,670.64        53.08            NA
2     AL  1,067,827.1  1,275,542.9  -207,715.85  2,343,370.0    920,478  1,392,076   -471,598  2,316,445 -147,349.08   116,533.08   -263,882.15   -26,925.00            NA
3     AR          0.0    843,818.1  -843,818.06    843,818.1          0    793,871   -793,871  1,193,261        0.00   -49,947.06     49,947.06   349,442.94            NA
4     AZ  1,541,114.5  1,388,130.5   152,983.92  2,929,245.0  1,716,467  1,637,661     78,806  3,354,893  175,352.54   249,530.46    -74,177.92   425,648.00            NA
5     CO  1,528,486.4  1,301,662.4   226,823.97  2,958,935.3  1,731,114  1,429,492    301,622  3,235,790  202,627.60   127,829.57     74,798.03   276,854.73            NA
6     DE    301,106.0    155,871.1   145,234.88    470,846.4    291,804    186,054    105,750    490,935   -9,301.99    30,182.89    -39,484.88    20,088.57            NA
7     GA  2,271,245.9  2,283,983.3   -12,737.38  4,555,229.2  2,269,262  2,213,979     55,283  4,483,241   -1,983.89   -70,004.27     68,020.38   -71,988.17     68,020.38
8   GA-2  1,480,646.4    992,294.7   488,351.71  3,304,026.1  2,288,446  2,194,848     93,598  4,483,294  807,799.63 1,202,553.35   -394,753.71 1,179,267.86            NA
9     IA    826,118.5    850,075.6   -23,957.14  1,715,377.9    754,859    864,997   -110,138  1,700,130  -71,259.50    14,921.36    -86,180.86   -15,247.95            NA
10    ID    263,253.6    443,426.6  -180,172.96    755,497.3    285,864    538,446   -252,582    859,827   22,610.36    95,019.40    -72,409.04   104,329.68            NA
11    IL  3,492,302.1  2,084,869.4 1,407,432.77  5,874,086.3  3,278,930  2,319,870    959,060  5,968,901 -213,372.14   235,000.63   -448,372.77    94,814.71            NA
12    KS    599,713.5    676,146.7   -76,433.19  1,275,860.1    571,530    727,962   -156,432  1,367,755  -28,183.46    51,815.35    -79,998.81    91,894.88            NA
13    KY    912,722.2  1,190,640.8  -277,918.64  2,103,362.9    816,257  1,233,315   -417,058  2,135,057  -96,465.15    42,674.21   -139,139.36    31,694.06            NA
14    LA    331,169.4    899,703.2  -568,533.80  1,373,317.1    394,049  1,228,908   -834,859  1,696,220   62,879.64   329,204.84   -266,325.20   322,902.92            NA
15    MA  2,245,247.6  1,077,097.3 1,168,150.34  3,418,485.1  2,357,809  1,177,765  1,180,044  3,658,005  112,561.38   100,667.72     11,893.66   239,519.86            NA
16    ME    419,466.9    403,705.7    15,761.29    823,172.6    347,223    417,645    -70,422    828,305  -72,243.94    13,939.34    -86,183.29     5,132.40    -86,183.29
17    MI  2,732,154.9  2,366,148.7   366,006.17  5,223,614.8  2,734,568  2,642,233     92,335  5,479,720    2,413.11   276,084.28   -273,671.17   256,105.21            NA
18    MN  1,704,158.0  1,321,000.4   383,157.61  3,110,404.1  1,566,522  1,398,145    168,377  3,214,256 -137,636.00    77,144.60   -214,780.61   103,851.94            NA
19    MS    621,578.3    748,778.7  -127,200.40  1,370,357.1    578,691    709,511   -130,820  1,311,354  -42,887.33   -39,267.73     -3,619.60   -59,003.06            NA
20    MT    281,848.5    300,841.2   -18,992.77    582,689.7    272,463    333,174    -60,711    605,637   -9,385.46    32,332.76    -41,718.23    22,947.30            NA
21    NC  2,639,255.8  2,474,963.5   164,292.25  5,227,426.1  2,569,965  2,665,598    -95,633  5,474,952  -69,290.77   190,634.48   -259,925.25   247,525.90   -259,925.25
22    NE    271,048.4    554,333.0  -283,284.65    825,381.4    227,191    583,507   -356,316    930,012  -43,857.39    29,173.96    -73,031.35   104,630.58            NA
23    NH    454,995.0    320,664.0   134,331.01    775,659.0    450,778    326,229    124,549    795,914   -4,217.03     5,564.98     -9,782.01    20,254.96            NA
24    NJ  2,503,607.8  1,465,680.9 1,037,926.92  4,068,183.0  2,541,178  1,817,052    724,126  4,440,440   37,570.18   351,371.10   -313,800.92   372,257.04            NA
25    NM    488,443.7    373,698.8   114,744.91    862,142.6    474,483    418,483     56,000    917,237  -13,960.73    44,784.18    -58,744.91    55,094.44            NA
26    OK    603,423.1    962,175.8  -358,752.72  1,611,114.0    509,763    979,140   -469,377  1,556,361  -93,660.09    16,964.19   -110,624.28   -54,753.03            NA
27    OR  1,258,416.8    749,430.6   508,986.21  2,088,104.0  1,321,047    912,814    408,233  2,321,249   62,630.24   163,383.45   -100,753.21   233,145.00            NA
28    RI    355,969.5    124,953.3   231,016.27    480,922.8    328,574    164,855    163,719    494,262  -27,395.53    39,901.73    -67,297.27    13,339.20            NA
29    SC  1,134,240.5  1,257,892.3  -123,651.77  2,392,132.9  1,110,828  1,369,137   -258,309  2,515,104  -23,412.54   111,244.69   -134,657.23   122,971.15            NA
30    SD    154,222.8    250,521.8   -96,298.94    404,744.6    143,987    276,232   -132,245    420,219  -10,235.83    25,710.23    -35,946.06    15,474.40            NA
31    TN  1,017,641.1  1,654,993.8  -637,352.69  2,779,094.0  1,040,691  1,840,926   -800,235  2,959,761   23,049.86   185,932.17   -162,882.31   180,666.97            NA
32    TX  4,662,049.9  5,413,081.6  -751,031.71 10,300,000.3  4,888,764  5,962,983 -1,074,219 11,144,040  226,714.14   549,901.43   -323,187.29   844,039.69            NA
33    VA  2,456,092.8  1,690,254.0   765,838.81  4,222,812.9  2,466,500  1,934,199    532,301  4,405,087   10,407.23   243,945.04   -233,537.81   182,274.08            NA
34    WV    293,936.3    490,026.2  -196,089.91    783,962.6    210,309    547,454   -337,145    778,918  -83,627.33    57,427.76   -141,055.09    -5,044.57            NA
35    WY     86,384.7    181,049.5   -94,664.81    267,434.2          0          0          0    278,503  -86,384.70  -181,049.50     94,664.81    11,068.80     94,664.81
36 TOTAL 41,158,054.5 38,745,996.3 2,412,058.28 82,475,343.4 41,606,462 43,429,673 -1,823,211 88,169,672  448,407.46 4,683,676.74 -4,235,269.28 5,694,328.58 -4,235,269.28

Source: 538 data: Model outputs - Click "Model outputs" (after "Download the data") to download
        election-forecasts-2020.zip, unzip, use file senate_state_toplines_2020.csv
        Actual data: U.S. Senate 1976-2020 - download 1976-2020-senate.tab
The prior tables show Georgia (GA), Maine (ME), and North Carolina (NC) are shown to have "flipped". Being positive, the Georgia number indicates a flip from a prediction of a Republican win to an actual Democrat win. The negative numbers for Maine and North Carolina indicates a flip from a prediction of a Democrat win to an actual Republican win. Wyoming is marked as a flip due to a mislabeling of parties in the input file from the MIT data site. I should be able to fix it in a day or two.
Comparing the Senate Predictions and Results via the Plot Tab
Comparing the Senate Predictions and Results via the Map Tab
Comparing the House Predictions and Results via the Output Tab
Shift in Margin Vote Share from House_538_deluxe_2020 to House_2020 Race in U.S. (Percent)
AREA DEM1 REP1 MARGIN1 TOTAL1 DEM2 REP2 MARGIN2 TOTAL2 DEM_SH REP_SH MAR_SH TOT_SH FLIP
1 AK-1 46.85 53.15 -6.30 100.00 45.26 54.40 -9.14 99.67 -1.58 1.25 -2.83 -0.33 NA
2 AL-1 35.99 64.01 -28.02 100.00 35.54 64.37 -28.83 99.91 -0.45 0.36 -0.81 -0.09 NA
3 AL-2 35.31 64.69 -29.38 100.00 34.68 65.22 -30.54 99.91 -0.63 0.53 -1.16 -0.09 NA
4 AL-3 32.24 67.76 -35.51 100.00 32.46 67.46 -35.00 99.92 0.22 -0.29 0.51 -0.08 NA
5 AL-4 18.62 81.38 -62.75 100.00 17.68 82.24 -64.56 99.92 -0.94 0.87 -1.81 -0.08 NA
6 AL-5 0.00 100.00 -100.00 100.00 0.00 95.81 -95.81 95.81 0.00 -4.19 4.19 -4.19 NA
7 AL-6 0.00 100.00 -100.00 100.00 0.00 97.13 -97.13 97.13 0.00 -2.87 2.87 -2.87 NA
8 AL-7 100.00 0.00 100.00 100.00 97.16 0.00 97.16 97.16 -2.84 0.00 -2.84 -2.84 NA
9 AR-1 NaN NaN NaN NaN 0.00 100.00 -100.00 100.00 NaN NaN NaN NaN NA
10 AR-2 48.60 51.40 -2.79 100.00 44.63 55.37 -10.73 100.00 -3.97 3.97 -7.94 0.00 NA
11 AR-3 34.46 65.54 -31.07 100.00 31.81 64.31 -32.50 96.12 -2.66 -1.23 -1.43 -3.88 NA
12 AR-4 31.08 68.92 -37.84 100.00 27.54 69.67 -42.13 97.21 -3.54 0.75 -4.28 -2.79 NA
13 AZ-1 54.76 45.24 9.52 100.00 51.61 48.39 3.22 100.00 -3.15 3.15 -6.30 0.00 NA
14 AZ-2 58.38 41.62 16.77 100.00 55.10 44.87 10.23 99.96 -3.29 3.25 -6.54 -0.04 NA
15 AZ-3 67.09 32.91 34.18 100.00 64.57 35.43 29.15 100.00 -2.52 2.52 -5.03 0.00 NA
16 AZ-4 28.87 71.13 -42.26 100.00 30.23 69.74 -39.51 99.97 1.36 -1.39 2.75 -0.03 NA
17 AZ-5 36.22 63.78 -27.57 100.00 41.10 58.90 -17.80 100.00 4.88 -4.88 9.77 0.00 NA
18 AZ-6 49.39 50.61 -1.22 100.00 47.83 52.17 -4.35 100.00 -1.56 1.56 -3.13 0.00 NA
19 AZ-7 78.42 21.58 56.84 100.00 76.69 23.28 53.41 99.98 -1.72 1.70 -3.43 -0.02 NA
20 AZ-8 38.00 62.00 -24.00 100.00 40.43 59.56 -19.13 100.00 2.43 -2.44 4.87 0.00 NA
21 AZ-9 63.56 36.44 27.12 100.00 61.63 38.37 23.25 100.00 -1.93 1.93 -3.87 0.00 NA
22 CA-1 43.40 56.60 -13.21 100.00 43.01 56.99 -13.99 100.00 -0.39 0.39 -0.78 0.00 NA
23 CA-10 56.30 43.70 12.60 100.00 55.16 44.84 10.33 100.00 -1.14 1.14 -2.27 0.00 NA
24 CA-11 73.41 26.59 46.82 100.00 72.99 27.01 45.99 100.00 -0.42 0.42 -0.84 0.00 NA
25 CA-12 100.00 0.00 100.00 100.00 100.00 0.00 100.00 100.00 0.00 0.00 0.00 0.00 NA
26 CA-13 92.32 7.68 84.64 100.00 90.37 9.63 80.73 100.00 -1.96 1.96 -3.91 0.00 NA
27 CA-14 81.70 18.30 63.40 100.00 79.29 20.71 58.57 100.00 -2.41 2.41 -4.82 0.00 NA
28 CA-15 75.42 24.58 50.84 100.00 70.90 29.10 41.81 100.00 -4.52 4.52 -9.04 0.00 NA
29 CA-16 64.77 35.23 29.54 100.00 59.38 40.62 18.76 100.00 -5.39 5.39 -10.78 0.00 NA
30 CA-17 78.17 21.83 56.34 100.00 71.35 28.65 42.69 100.00 -6.83 6.83 -13.65 0.00 NA
31 CA-18 100.00 0.00 100.00 100.00 100.00 0.00 100.00 100.00 0.00 0.00 0.00 0.00 NA
32 CA-19 76.61 23.39 53.21 100.00 71.68 28.32 43.36 100.00 -4.92 4.92 -9.85 0.00 NA
33 CA-2 77.39 22.61 54.78 100.00 75.74 24.26 51.48 100.00 -1.65 1.65 -3.31 0.00 NA
34 CA-20 78.52 21.48 57.05 100.00 76.78 23.22 53.55 100.00 -1.75 1.75 -3.50 0.00 NA
35 CA-21 50.92 49.08 1.83 100.00 49.55 50.45 -0.89 100.00 -1.36 1.36 -2.72 0.00 -2.72
36 CA-22 42.07 57.93 -15.86 100.00 45.77 54.23 -8.45 100.00 3.70 -3.70 7.40 0.00 NA
37 CA-23 33.93 66.07 -32.15 100.00 37.86 62.14 -24.28 100.00 3.93 -3.93 7.87 0.00 NA
38 CA-24 60.51 39.49 21.02 100.00 58.66 41.34 17.33 100.00 -1.84 1.84 -3.69 0.00 NA
39 CA-25 50.49 49.51 0.99 100.00 49.95 50.05 -0.10 100.00 -0.54 0.54 -1.09 0.00 -1.09
40 CA-26 64.42 35.58 28.84 100.00 60.58 39.42 21.17 100.00 -3.83 3.83 -7.67 0.00 NA
41 CA-27 73.62 26.38 47.24 100.00 69.78 30.22 39.55 100.00 -3.84 3.84 -7.68 0.00 NA
42 CA-28 78.40 21.60 56.79 100.00 72.66 27.34 45.31 100.00 -5.74 5.74 -11.48 0.00 NA
43 CA-29 100.00 0.00 100.00 100.00 100.00 0.00 100.00 100.00 0.00 0.00 0.00 0.00 NA
44 CA-3 59.70 40.30 19.40 100.00 54.67 45.33 9.35 100.00 -5.03 5.03 -10.06 0.00 NA
45 CA-30 75.99 24.01 51.97 100.00 69.48 30.52 38.97 100.00 -6.50 6.50 -13.00 0.00 NA
46 CA-31 63.93 36.07 27.86 100.00 61.29 38.71 22.58 100.00 -2.64 2.64 -5.29 0.00 NA
47 CA-32 71.72 28.28 43.44 100.00 66.58 33.42 33.16 100.00 -5.14 5.14 -10.29 0.00 NA
48 CA-33 73.12 26.88 46.24 100.00 67.58 32.42 35.16 100.00 -5.54 5.54 -11.08 0.00 NA
49 CA-34 100.00 0.00 100.00 100.00 100.00 0.00 100.00 100.00 0.00 0.00 0.00 0.00 NA
50 CA-35 72.09 27.91 44.17 100.00 69.33 30.67 38.66 100.00 -2.76 2.76 -5.51 0.00 NA
51 CA-36 58.44 41.56 16.87 100.00 60.34 39.66 20.68 100.00 1.90 -1.90 3.80 0.00 NA
52 CA-37 88.74 11.26 77.48 100.00 85.94 14.06 71.88 100.00 -2.80 2.80 -5.60 0.00 NA
53 CA-38 100.00 0.00 100.00 100.00 100.00 0.00 100.00 100.00 0.00 0.00 0.00 0.00 NA
54 CA-39 52.30 47.70 4.61 100.00 49.40 50.60 -1.20 100.00 -2.90 2.90 -5.80 0.00 -5.80
55 CA-4 43.55 56.45 -12.91 100.00 44.05 55.95 -11.89 100.00 0.51 -0.51 1.02 0.00 NA
56 CA-40 84.59 15.41 69.19 100.00 72.74 27.26 45.48 100.00 -11.85 11.85 -23.71 0.00 NA
57 CA-41 65.69 34.31 31.39 100.00 64.04 35.96 28.09 100.00 -1.65 1.65 -3.30 0.00 NA
58 CA-42 43.05 56.95 -13.91 100.00 42.87 57.13 -14.25 100.00 -0.17 0.17 -0.34 0.00 NA
59 CA-43 75.65 24.35 51.30 100.00 71.68 28.32 43.37 100.00 -3.96 3.96 -7.93 0.00 NA
60 CA-44 100.00 0.00 100.00 100.00 100.00 0.00 100.00 100.00 0.00 0.00 0.00 0.00 NA
61 CA-45 57.25 42.75 14.50 100.00 53.46 46.54 6.93 100.00 -3.79 3.79 -7.57 0.00 NA
62 CA-46 71.58 28.42 43.16 100.00 68.75 31.25 37.51 100.00 -2.83 2.83 -5.65 0.00 NA
63 CA-47 67.14 32.86 34.29 100.00 63.27 36.73 26.54 100.00 -3.87 3.87 -7.74 0.00 NA
64 CA-48 52.04 47.96 4.08 100.00 48.94 51.06 -2.12 100.00 -3.10 3.10 -6.20 0.00 -6.20
65 CA-49 58.74 41.26 17.48 100.00 53.13 46.87 6.26 100.00 -5.61 5.61 -11.22 0.00 NA
66 CA-5 78.32 21.68 56.64 100.00 76.09 23.91 52.18 100.00 -2.23 2.23 -4.46 0.00 NA
67 CA-50 44.35 55.65 -11.29 100.00 46.05 53.95 -7.91 100.00 1.69 -1.69 3.39 0.00 NA
68 CA-51 74.31 25.69 48.62 100.00 68.30 31.70 36.61 100.00 -6.00 6.00 -12.01 0.00 NA
69 CA-52 65.69 34.31 31.38 100.00 61.58 38.42 23.15 100.00 -4.11 4.11 -8.23 0.00 NA
70 CA-53 100.00 0.00 100.00 100.00 100.00 0.00 100.00 100.00 0.00 0.00 0.00 0.00 NA
71 CA-6 77.49 22.51 54.99 100.00 73.34 26.66 46.69 100.00 -4.15 4.15 -8.30 0.00 NA
72 CA-7 60.66 39.34 21.32 100.00 56.62 43.38 13.25 100.00 -4.04 4.04 -8.07 0.00 NA
73 CA-8 42.21 57.79 -15.59 100.00 43.94 56.06 -12.12 100.00 1.73 -1.73 3.47 0.00 NA
74 CA-9 61.62 38.38 23.24 100.00 57.58 42.42 15.17 100.00 -4.04 4.04 -8.08 0.00 NA
75 CO-1 71.81 23.50 48.31 95.30 73.65 23.53 50.12 97.18 1.84 0.03 1.81 1.87 NA
76 CO-2 62.44 32.78 29.66 95.22 61.46 35.40 26.06 96.86 -0.98 2.62 -3.60 1.64 NA
77 CO-3 46.33 48.60 -2.27 94.93 45.22 51.39 -6.18 96.61 -1.11 2.79 -3.91 1.68 NA
78 CO-4 38.47 57.41 -18.94 95.88 36.92 60.62 -23.70 97.55 -1.55 3.22 -4.76 1.67 NA
79 CO-5 36.76 59.11 -22.35 95.87 37.37 57.59 -20.22 94.96 0.61 -1.52 2.13 -0.91 NA
80 CO-6 57.18 38.98 18.20 96.17 57.09 39.96 17.13 97.04 -0.09 0.97 -1.06 0.88 NA
81 CO-7 59.59 36.12 23.47 95.71 59.13 37.60 21.53 96.73 -0.46 1.48 -1.94 1.02 NA
82 CT-1 65.13 34.87 30.26 100.00 63.76 34.97 28.79 98.72 -1.37 0.09 -1.46 -1.28 NA
83 CT-2 61.54 38.46 23.08 100.00 59.37 38.22 21.15 97.59 -2.17 -0.24 -1.94 -2.41 NA
84 CT-3 63.34 36.66 26.68 100.00 58.73 39.76 18.97 98.49 -4.61 3.10 -7.71 -1.51 NA
85 CT-4 64.95 35.05 29.90 100.00 62.15 36.27 25.88 98.43 -2.79 1.22 -4.01 -1.57 NA
86 CT-5 58.71 41.29 17.42 100.00 55.07 43.48 11.59 98.55 -3.64 2.19 -5.83 -1.45 NA
87 DE-1 60.15 36.09 24.06 96.24 57.63 40.22 17.41 97.85 -2.52 4.13 -6.65 1.61 NA
88 FL-1 32.92 67.08 -34.16 100.00 34.01 64.61 -30.60 98.62 1.09 -2.47 3.56 -1.38 NA
89 FL-10 67.40 32.60 34.80 100.00 63.61 36.37 27.24 99.98 -3.79 3.77 -7.56 -0.02 NA
90 FL-11 31.91 68.09 -36.17 100.00 33.28 66.72 -33.44 100.00 1.36 -1.36 2.73 0.00 NA
91 FL-12 36.35 63.65 -27.29 100.00 37.12 62.88 -25.76 100.00 0.76 -0.76 1.53 0.00 NA
92 FL-13 57.85 42.15 15.70 100.00 53.04 46.96 6.08 100.00 -4.81 4.81 -9.62 0.00 NA
93 FL-14 65.21 34.79 30.41 100.00 60.26 39.74 20.52 100.00 -4.95 4.95 -9.90 0.00 NA
94 FL-15 46.89 53.11 -6.22 100.00 44.61 55.39 -10.77 100.00 -2.27 2.27 -4.55 0.00 NA
95 FL-16 45.31 54.69 -9.38 100.00 44.50 55.50 -11.00 100.00 -0.81 0.81 -1.62 0.00 NA
96 FL-17 34.96 65.04 -30.09 100.00 34.07 64.63 -30.56 98.69 -0.89 -0.42 -0.47 -1.31 NA
97 FL-18 44.08 55.92 -11.83 100.00 41.51 56.32 -14.81 97.83 -2.57 0.40 -2.98 -2.17 NA
98 FL-19 36.82 63.18 -26.35 100.00 38.72 61.28 -22.56 100.00 1.90 -1.90 3.79 0.00 NA
99 FL-2 0.00 100.00 -100.00 100.00 0.00 97.86 -97.86 97.86 0.00 -2.14 2.14 -2.14 NA
100 FL-20 82.75 17.25 65.49 100.00 78.68 21.32 57.35 100.00 -4.07 4.07 -8.14 0.00 NA
101 FL-21 62.36 37.64 24.72 100.00 59.02 39.10 19.92 98.13 -3.34 1.46 -4.80 -1.87 NA
102 FL-22 63.20 36.80 26.39 100.00 58.60 41.40 17.20 100.00 -4.59 4.59 -9.19 0.00 NA
103 FL-23 62.98 37.02 25.97 100.00 58.19 41.79 16.40 99.98 -4.79 4.77 -9.56 -0.02 NA
104 FL-24 84.21 15.79 68.42 100.00 75.55 20.40 55.15 95.95 -8.66 4.61 -13.26 -4.05 NA
105 FL-25 NaN NaN NaN NaN 0.00 100.00 -100.00 100.00 NaN NaN NaN NaN NA
106 FL-26 54.10 45.90 8.21 100.00 48.28 51.72 -3.45 100.00 -5.83 5.83 -11.66 0.00 -11.66
107 FL-27 53.58 46.42 7.16 100.00 48.62 51.36 -2.74 99.98 -4.96 4.93 -9.89 -0.02 -9.89
108 FL-3 40.19 59.81 -19.61 100.00 42.86 57.14 -14.28 100.00 2.67 -2.67 5.33 0.00 NA
109 FL-4 38.07 61.93 -23.86 100.00 38.90 61.10 -22.20 100.00 0.83 -0.83 1.66 0.00 NA
110 FL-5 67.10 32.90 34.20 100.00 65.13 34.87 30.26 100.00 -1.97 1.97 -3.94 0.00 NA
111 FL-6 36.11 63.89 -27.79 100.00 39.35 60.61 -21.26 99.96 3.24 -3.28 6.53 -0.04 NA
112 FL-7 58.61 41.39 17.22 100.00 55.34 43.24 12.10 98.58 -3.26 1.85 -5.11 -1.42 NA
113 FL-8 35.74 64.26 -28.52 100.00 38.65 61.35 -22.71 100.00 2.91 -2.91 5.81 0.00 NA
114 FL-9 58.06 41.94 16.12 100.00 56.03 43.96 12.06 99.99 -2.03 2.02 -4.05 -0.01 NA
115 GA-1 36.68 63.32 -26.64 100.00 41.65 58.35 -16.70 100.00 4.97 -4.97 9.94 0.00 NA
116 GA-10 32.38 67.62 -35.23 100.00 37.69 62.31 -24.62 100.00 5.31 -5.31 10.61 0.00 NA
117 GA-11 37.27 62.73 -25.45 100.00 39.57 60.43 -20.85 100.00 2.30 -2.30 4.60 0.00 NA
118 GA-12 36.63 63.37 -26.74 100.00 41.62 58.38 -16.76 100.00 4.99 -4.99 9.98 0.00 NA
119 GA-13 73.33 26.67 46.67 100.00 77.40 22.60 54.80 100.00 4.07 -4.07 8.13 0.00 NA
120 GA-14 22.78 77.22 -54.44 100.00 25.29 74.71 -49.42 100.00 2.51 -2.51 5.02 0.00 NA
121 GA-2 57.91 42.09 15.81 100.00 59.12 40.88 18.23 100.00 1.21 -1.21 2.42 0.00 NA
122 GA-3 29.62 70.38 -40.76 100.00 34.95 65.05 -30.09 100.00 5.33 -5.33 10.67 0.00 NA
123 GA-4 76.64 23.36 53.28 100.00 80.08 19.92 60.15 100.00 3.44 -3.44 6.87 0.00 NA
124 GA-5 83.46 16.54 66.93 100.00 85.15 14.85 70.30 100.00 1.68 -1.68 3.37 0.00 NA
125 GA-6 52.32 47.68 4.64 100.00 54.59 45.41 9.18 100.00 2.27 -2.27 4.54 0.00 NA
126 GA-7 49.34 50.66 -1.31 100.00 51.39 48.61 2.78 100.00 2.05 -2.05 4.10 0.00 4.10
127 GA-8 29.80 70.20 -40.40 100.00 35.48 64.52 -29.04 100.00 5.68 -5.68 11.35 0.00 NA
128 GA-9 20.03 79.97 -59.94 100.00 21.42 78.58 -57.16 100.00 1.39 -1.39 2.78 0.00 NA
129 HI-1 75.09 24.91 50.19 100.00 72.03 27.97 44.05 100.00 -3.07 3.07 -6.13 0.00 NA
130 HI-2 69.45 25.18 44.27 94.63 63.05 30.87 32.18 93.92 -6.40 5.69 -12.10 -0.71 NA
131 IA-1 54.01 45.99 8.03 100.00 48.65 51.25 -2.60 99.90 -5.36 5.26 -10.62 -0.10 -10.62
132 IA-2 54.27 45.73 8.53 100.00 49.91 49.91 0.00 99.82 -4.36 4.18 -8.54 -0.18 -8.54
133 IA-3 53.66 46.34 7.32 100.00 48.94 47.55 1.39 96.49 -4.72 1.21 -5.93 -3.51 NA
134 IA-4 41.96 58.04 -16.07 100.00 37.79 61.97 -24.18 99.77 -4.17 3.94 -8.11 -0.23 NA
135 ID-1 33.95 66.05 -32.10 100.00 28.65 67.76 -39.11 96.41 -5.30 1.71 -7.02 -3.59 NA
136 ID-2 33.01 61.69 -28.68 94.70 31.73 64.06 -32.33 95.78 -1.28 2.37 -3.65 1.09 NA
137 IL-1 77.93 22.07 55.87 100.00 73.80 26.15 47.65 99.95 -4.13 4.09 -8.22 -0.05 NA
138 IL-10 68.10 31.90 36.19 100.00 63.87 36.12 27.76 99.99 -4.22 4.21 -8.43 -0.01 NA
139 IL-11 66.14 33.86 32.27 100.00 63.30 36.70 26.60 100.00 -2.84 2.84 -5.68 0.00 NA
140 IL-12 39.89 60.11 -20.22 100.00 39.57 60.43 -20.86 100.00 -0.32 0.32 -0.65 0.00 NA
141 IL-13 48.82 51.18 -2.36 100.00 45.54 54.46 -8.93 100.00 -3.28 3.28 -6.56 0.00 NA
142 IL-14 54.83 45.17 9.66 100.00 50.67 49.33 1.34 100.00 -4.16 4.16 -8.32 0.00 NA
143 IL-15 28.79 71.21 -42.42 100.00 26.55 73.45 -46.89 100.00 -2.24 2.24 -4.47 0.00 NA
144 IL-16 39.50 60.50 -21.01 100.00 35.28 64.71 -29.43 100.00 -4.21 4.21 -8.42 0.00 NA
145 IL-17 56.07 43.93 12.14 100.00 52.02 47.97 4.05 99.99 -4.05 4.04 -8.09 -0.01 NA
146 IL-18 31.02 68.98 -37.96 100.00 29.59 70.41 -40.82 100.00 -1.43 1.43 -2.86 0.00 NA
147 IL-2 81.04 18.96 62.07 100.00 78.81 21.19 57.63 100.00 -2.22 2.22 -4.45 0.00 NA
148 IL-3 59.29 40.71 18.59 100.00 56.38 43.62 12.76 100.00 -2.91 2.91 -5.83 0.00 NA
149 IL-4 84.67 15.33 69.34 100.00 84.05 15.95 68.11 100.00 -0.62 0.62 -1.23 0.00 NA
150 IL-5 75.59 24.41 51.18 100.00 70.77 26.63 44.14 97.40 -4.82 2.22 -7.04 -2.60 NA
151 IL-6 55.15 44.85 10.30 100.00 52.82 45.43 7.38 98.25 -2.33 0.58 -2.91 -1.75 NA
152 IL-7 87.67 12.33 75.34 100.00 80.41 13.35 67.07 93.76 -7.26 1.02 -8.28 -6.24 NA
153 IL-8 100.00 0.00 100.00 100.00 73.16 0.00 73.16 73.16 -26.84 0.00 -26.84 -26.84 NA
154 IL-9 73.62 26.38 47.24 100.00 70.98 29.02 41.96 100.00 -2.64 2.64 -5.27 0.00 NA
155 IN-1 64.24 35.76 28.48 100.00 56.64 40.45 16.19 97.09 -7.60 4.69 -12.29 -2.91 NA
156 IN-2 40.78 59.22 -18.44 100.00 38.51 61.49 -22.99 100.00 -2.27 2.27 -4.55 0.00 NA
157 IN-3 32.18 67.82 -35.65 100.00 32.16 67.84 -35.68 100.00 -0.02 0.02 -0.03 0.00 NA
158 IN-4 32.80 67.20 -34.40 100.00 33.38 66.62 -33.25 100.00 0.58 -0.58 1.15 0.00 NA
159 IN-5 50.02 49.98 0.05 100.00 45.94 50.02 -4.08 95.97 -4.08 0.05 -4.13 -4.03 -4.13
160 IN-6 29.18 70.82 -41.63 100.00 27.76 68.65 -40.89 96.41 -1.43 -2.16 0.74 -3.59 NA
161 IN-7 67.09 32.91 34.18 100.00 62.44 37.56 24.87 100.00 -4.66 4.66 -9.31 0.00 NA
162 IN-8 33.36 66.64 -33.28 100.00 29.85 66.95 -37.10 96.79 -3.51 0.31 -3.82 -3.21 NA
163 IN-9 38.95 61.05 -22.09 100.00 34.77 60.89 -26.12 95.65 -4.19 -0.16 -4.03 -4.35 NA
164 KS-1 32.66 67.34 -34.68 100.00 28.84 71.16 -42.32 100.00 -3.82 3.82 -7.64 0.00 NA
165 KS-2 44.75 55.25 -10.50 100.00 40.63 55.15 -14.51 95.78 -4.12 -0.10 -4.01 -4.22 NA
166 KS-3 58.61 41.39 17.22 100.00 53.62 43.56 10.06 97.17 -5.00 2.17 -7.17 -2.83 NA
167 KS-4 39.10 60.90 -21.81 100.00 36.35 63.65 -27.30 100.00 -2.75 2.75 -5.50 0.00 NA
168 KY-1 28.28 71.72 -43.43 100.00 25.01 74.99 -49.99 100.00 -3.28 3.28 -6.55 0.00 NA
169 KY-2 31.56 65.02 -33.47 96.58 26.26 70.96 -44.70 97.22 -5.30 5.93 -11.23 0.64 NA
170 KY-3 64.50 35.50 28.99 100.00 62.67 37.33 25.33 100.00 -1.83 1.83 -3.66 0.00 NA
171 KY-4 33.74 66.26 -32.51 100.00 32.91 67.09 -34.17 100.00 -0.83 0.83 -1.66 0.00 NA
172 KY-5 19.84 80.16 -60.31 100.00 15.79 84.21 -68.42 100.00 -4.05 4.05 -8.10 0.00 NA
173 KY-6 45.91 54.09 -8.19 100.00 40.96 57.33 -16.37 98.28 -4.95 3.23 -8.18 -1.72 NA
174 LA-1 24.01 75.99 -51.99 100.00 25.30 72.21 -46.91 97.51 1.30 -3.78 5.08 -2.49 NA
175 LA-2 84.28 11.61 72.67 95.89 74.24 19.92 54.32 94.16 -10.04 8.31 -18.35 -1.73 NA
176 LA-3 21.28 78.72 -57.43 100.00 29.48 67.76 -38.28 97.25 8.20 -10.95 19.15 -2.75 NA
177 LA-4 29.01 70.99 -41.98 100.00 33.26 66.74 -33.48 100.00 4.25 -4.25 8.50 0.00 NA
178 LA-5 26.05 73.95 -47.90 100.00 32.16 67.84 -35.67 100.00 6.12 -6.12 12.23 0.00 NA
179 LA-6 26.74 70.02 -43.28 96.77 25.55 71.05 -45.50 96.59 -1.20 1.02 -2.22 -0.18 NA
180 MA-1 100.00 0.00 100.00 100.00 96.51 0.00 96.51 96.51 -3.49 0.00 -3.49 -3.49 NA
181 MA-2 66.22 33.78 32.44 100.00 65.33 34.57 30.76 99.90 -0.89 0.79 -1.68 -0.10 NA
182 MA-3 100.00 0.00 100.00 100.00 97.74 0.00 97.74 97.74 -2.26 0.00 -2.26 -2.26 NA
183 MA-4 65.61 34.39 31.22 100.00 60.83 38.87 21.95 99.70 -4.78 4.48 -9.26 -0.30 NA
184 MA-5 72.94 27.06 45.87 100.00 74.32 25.58 48.73 99.90 1.38 -1.48 2.86 -0.10 NA
185 MA-6 64.15 35.85 28.31 100.00 65.43 34.43 31.00 99.86 1.28 -1.41 2.69 -0.14 NA
186 MA-7 100.00 0.00 100.00 100.00 86.62 0.00 86.62 86.62 -13.38 0.00 -13.38 -13.38 NA
187 MA-8 100.00 0.00 100.00 100.00 80.68 0.00 80.68 80.68 -19.32 0.00 -19.32 -19.32 NA
188 MA-9 62.15 37.85 24.30 100.00 61.30 36.33 24.96 97.63 -0.86 -1.52 0.66 -2.37 NA
189 MD-1 33.57 66.43 -32.86 100.00 36.38 63.44 -27.06 99.81 2.81 -3.00 5.80 -0.19 NA
190 MD-2 65.96 34.04 31.92 100.00 67.72 32.03 35.68 99.75 1.76 -2.01 3.77 -0.25 NA
191 MD-3 69.97 30.03 39.93 100.00 69.76 30.04 39.72 99.80 -0.20 0.01 -0.21 -0.20 NA
192 MD-4 80.29 19.71 60.57 100.00 79.58 20.22 59.36 99.79 -0.71 0.50 -1.21 -0.21 NA
193 MD-5 71.32 28.68 42.63 100.00 68.75 30.97 37.78 99.72 -2.56 2.29 -4.85 -0.28 NA
194 MD-6 59.63 40.37 19.26 100.00 58.82 39.19 19.63 98.01 -0.81 -1.18 0.37 -1.99 NA
195 MD-7 70.84 29.16 41.67 100.00 71.63 28.04 43.58 99.67 0.79 -1.12 1.91 -0.33 NA
196 MD-8 70.51 29.49 41.01 100.00 68.23 31.58 36.65 99.82 -2.27 2.09 -4.36 -0.18 NA
197 ME-1 62.45 37.55 24.91 100.00 62.15 37.84 24.31 100.00 -0.30 0.30 -0.60 0.00 NA
198 ME-2 56.91 43.09 13.82 100.00 53.04 46.95 6.09 99.99 -3.87 3.86 -7.73 -0.01 NA
199 MI-1 39.63 60.37 -20.74 100.00 36.84 61.65 -24.81 98.48 -2.79 1.28 -4.07 -1.52 NA
200 MI-10 38.53 61.47 -22.94 100.00 33.72 66.28 -32.56 100.00 -4.81 4.81 -9.62 0.00 NA
201 MI-11 56.61 43.39 13.22 100.00 50.20 47.82 2.38 98.02 -6.41 4.43 -10.84 -1.98 NA
202 MI-12 71.12 28.88 42.25 100.00 66.43 30.67 35.76 97.10 -4.70 1.80 -6.49 -2.90 NA
203 MI-13 79.17 16.61 62.57 95.78 78.08 18.65 59.43 96.72 -1.10 2.04 -3.14 0.94 NA
204 MI-14 79.57 16.25 63.32 95.81 79.28 18.31 60.97 97.58 -0.29 2.06 -2.35 1.77 NA
205 MI-2 39.78 56.01 -16.24 95.79 38.22 59.20 -20.98 97.42 -1.56 3.18 -4.74 1.63 NA
206 MI-3 49.46 50.54 -1.07 100.00 47.04 52.96 -5.92 100.00 -2.42 2.42 -4.85 0.00 NA
207 MI-4 34.57 62.13 -27.56 96.69 32.37 65.00 -32.64 97.37 -2.20 2.88 -5.08 0.68 NA
208 MI-5 60.35 36.38 23.97 96.73 54.45 41.76 12.69 96.22 -5.90 5.38 -11.28 -0.52 NA
209 MI-6 45.93 50.45 -4.53 96.38 40.13 55.81 -15.68 95.94 -5.80 5.35 -11.15 -0.44 NA
210 MI-7 43.97 56.03 -12.05 100.00 41.25 58.75 -17.50 100.00 -2.73 2.73 -5.45 0.00 NA
211 MI-8 56.89 43.11 13.78 100.00 50.88 47.28 3.59 98.16 -6.02 4.17 -10.19 -1.84 NA
212 MI-9 62.16 34.57 27.59 96.73 57.71 38.41 19.30 96.12 -4.45 3.84 -8.29 -0.62 NA
213 MN-1 48.96 51.04 -2.08 100.00 45.52 48.59 -3.07 94.11 -3.44 -2.45 -1.00 -5.89 NA
214 MN-2 56.09 43.91 12.18 100.00 48.18 45.93 2.26 94.11 -7.91 2.01 -9.92 -5.89 NA
215 MN-3 58.33 41.67 16.66 100.00 55.61 44.32 11.28 99.93 -2.73 2.65 -5.38 -0.07 NA
216 MN-4 70.11 29.89 40.21 100.00 63.17 28.97 34.20 92.14 -6.93 -0.92 -6.01 -7.86 NA
217 MN-5 70.89 29.11 41.79 100.00 64.27 25.83 38.43 90.10 -6.63 -3.27 -3.36 -9.90 NA
218 MN-6 34.84 65.16 -30.31 100.00 34.16 65.70 -31.54 99.87 -0.68 0.55 -1.23 -0.13 NA
219 MN-7 45.02 51.48 -6.45 96.50 39.85 53.39 -13.54 93.24 -5.17 1.92 -7.09 -3.25 NA
220 MN-8 41.86 58.14 -16.28 100.00 37.55 56.75 -19.20 94.30 -4.31 -1.39 -2.92 -5.70 NA
221 MO-1 81.26 18.74 62.52 100.00 78.78 18.96 59.82 97.74 -2.48 0.22 -2.70 -2.26 NA
222 MO-2 48.07 51.93 -3.86 100.00 45.52 51.89 -6.37 97.41 -2.55 -0.04 -2.51 -2.59 NA
223 MO-3 28.52 71.48 -42.96 100.00 28.50 69.44 -40.94 97.94 -0.02 -2.04 2.02 -2.06 NA
224 MO-4 31.14 68.86 -37.72 100.00 29.66 67.59 -37.93 97.26 -1.48 -1.27 -0.21 -2.74 NA
225 MO-5 62.54 37.46 25.08 100.00 58.79 38.57 20.22 97.36 -3.76 1.11 -4.87 -2.64 NA
226 MO-6 30.19 69.81 -39.62 100.00 30.83 67.06 -36.23 97.89 0.64 -2.75 3.39 -2.11 NA
227 MO-7 25.70 74.30 -48.61 100.00 26.57 68.87 -42.30 95.44 0.87 -5.43 6.31 -4.56 NA
228 MO-8 25.43 74.57 -49.14 100.00 21.37 76.86 -55.49 98.23 -4.06 2.29 -6.35 -1.77 NA
229 MS-1 31.62 68.38 -36.77 100.00 31.25 68.75 -37.49 100.00 -0.36 0.36 -0.73 0.00 NA
230 MS-2 73.54 26.46 47.08 100.00 66.02 33.98 32.05 100.00 -7.52 7.52 -15.04 0.00 NA
231 MS-3 33.31 66.69 -33.38 100.00 35.33 64.67 -29.34 100.00 2.02 -2.02 4.04 0.00 NA
232 MS-4 0.00 100.00 -100.00 100.00 0.00 100.00 -100.00 100.00 0.00 0.00 0.00 0.00 NA
233 MT-1 47.50 52.50 -5.01 100.00 43.61 56.39 -12.77 100.00 -3.88 3.88 -7.77 0.00 NA
234 NC-1 57.24 42.76 14.48 100.00 54.18 45.82 8.35 100.00 -3.06 3.06 -6.12 0.00 NA
235 NC-10 31.85 68.15 -36.30 100.00 31.09 68.91 -37.82 100.00 -0.76 0.76 -1.52 0.00 NA
236 NC-11 45.75 50.74 -4.99 96.49 42.34 54.50 -12.16 96.85 -3.41 3.77 -7.18 0.36 NA
237 NC-12 100.00 0.00 100.00 100.00 100.00 0.00 100.00 100.00 0.00 0.00 0.00 0.00 NA
238 NC-13 33.02 66.98 -33.97 100.00 31.82 68.18 -36.36 100.00 -1.20 1.20 -2.39 0.00 NA
239 NC-2 64.08 35.92 28.16 100.00 62.96 34.83 28.13 97.80 -1.12 -1.09 -0.03 -2.20 NA
240 NC-3 34.49 65.51 -31.02 100.00 36.62 63.38 -26.77 100.00 2.13 -2.13 4.26 0.00 NA
241 NC-4 70.13 29.87 40.27 100.00 67.33 32.67 34.66 100.00 -2.80 2.80 -5.61 0.00 NA
242 NC-5 31.76 68.24 -36.49 100.00 31.11 66.93 -35.82 98.04 -0.65 -1.31 0.67 -1.96 NA
243 NC-6 61.40 35.01 26.40 96.41 62.27 37.73 24.55 100.00 0.87 2.72 -1.85 3.59 NA
244 NC-7 37.35 62.65 -25.29 100.00 39.59 60.25 -20.65 99.84 2.24 -2.40 4.64 -0.16 NA
245 NC-8 48.47 51.53 -3.06 100.00 46.72 53.28 -6.57 100.00 -1.75 1.75 -3.50 0.00 NA
246 NC-9 44.77 55.23 -10.45 100.00 44.41 55.59 -11.18 100.00 -0.37 0.37 -0.73 0.00 NA
247 ND-1 29.12 66.31 -37.19 95.43 27.55 68.96 -41.41 96.51 -1.57 2.65 -4.22 1.08 NA
248 NE-1 40.74 59.26 -18.51 100.00 37.67 59.52 -21.85 97.19 -3.08 0.26 -3.34 -2.81 NA
249 NE-2 49.11 50.89 -1.77 100.00 46.21 50.77 -4.56 96.98 -2.90 -0.12 -2.79 -3.02 NA
250 NE-3 21.90 78.10 -56.19 100.00 17.68 78.51 -60.84 96.19 -4.23 0.42 -4.65 -3.81 NA
251 NH-1 53.68 46.32 7.35 100.00 51.32 46.21 5.10 97.53 -2.36 -0.11 -2.25 -2.47 NA
252 NH-2 57.42 42.58 14.85 100.00 53.91 43.70 10.21 97.60 -3.52 1.12 -4.64 -2.40 NA
253 NJ-1 67.92 32.08 35.83 100.00 62.48 37.52 24.96 100.00 -5.44 5.44 -10.87 0.00 NA
254 NJ-10 87.22 12.78 74.44 100.00 83.28 13.90 69.39 97.18 -3.94 1.12 -5.06 -2.82 NA
255 NJ-11 58.66 41.34 17.33 100.00 53.30 46.70 6.61 100.00 -5.36 5.36 -10.72 0.00 NA
256 NJ-12 70.56 29.44 41.12 100.00 65.64 32.58 33.06 98.22 -4.92 3.14 -8.05 -1.78 NA
257 NJ-2 50.03 49.97 0.05 100.00 46.17 51.93 -5.76 98.10 -3.86 1.95 -5.81 -1.90 -5.81
258 NJ-3 55.83 44.17 11.66 100.00 53.23 45.47 7.76 98.70 -2.60 1.30 -3.90 -1.30 NA
259 NJ-4 40.12 59.88 -19.76 100.00 38.27 59.88 -21.60 98.15 -1.84 0.00 -1.84 -1.85 NA
260 NJ-5 59.17 40.83 18.34 100.00 53.15 45.64 7.52 98.79 -6.02 4.81 -10.83 -1.21 NA
261 NJ-6 65.33 34.67 30.65 100.00 61.17 38.83 22.33 100.00 -4.16 4.16 -8.32 0.00 NA
262 NJ-7 52.91 47.09 5.82 100.00 50.61 49.39 1.22 100.00 -2.30 2.30 -4.59 0.00 NA
263 NJ-8 79.81 20.19 59.62 100.00 74.03 24.58 49.45 98.61 -5.78 4.39 -10.17 -1.39 NA
264 NJ-9 70.91 29.09 41.82 100.00 65.80 31.86 33.94 97.66 -5.11 2.77 -7.89 -2.34 NA
265 NM-1 62.11 37.89 24.22 100.00 58.19 41.81 16.38 100.00 -3.92 3.92 -7.85 0.00 NA
266 NM-2 50.48 49.52 0.96 100.00 46.25 53.70 -7.45 99.96 -4.23 4.18 -8.41 -0.04 -8.41
267 NM-3 62.35 37.65 24.70 100.00 58.68 41.32 17.36 100.00 -3.67 3.67 -7.33 0.00 NA
268 NV-1 67.30 28.65 38.64 95.95 61.77 33.37 28.39 95.14 -5.53 4.72 -10.25 -0.81 NA
269 NV-2 38.96 57.50 -18.54 96.46 40.71 56.47 -15.76 97.17 1.75 -1.03 2.78 0.71 NA
270 NV-3 52.13 44.08 8.05 96.21 48.75 45.77 2.98 94.52 -3.38 1.69 -5.07 -1.69 NA
271 NV-4 50.88 45.69 5.19 96.58 50.67 45.80 4.86 96.47 -0.21 0.11 -0.32 -0.10 NA
272 NY-1 44.81 52.53 -7.72 97.35 45.13 54.84 -9.71 99.97 0.32 2.31 -1.99 2.63 NA
273 NY-10 78.06 18.40 59.65 96.46 74.49 24.15 50.34 98.64 -3.57 5.75 -9.32 2.18 NA
274 NY-11 50.83 49.17 1.67 100.00 46.78 53.05 -6.28 99.83 -4.06 3.89 -7.95 -0.17 -7.95
275 NY-12 85.19 14.81 70.39 100.00 82.09 16.43 65.66 98.52 -3.10 1.62 -4.72 -1.48 NA
276 NY-13 93.02 6.98 86.04 100.00 90.79 7.76 83.02 98.55 -2.23 0.78 -3.01 -1.45 NA
277 NY-14 77.03 19.39 57.64 96.42 71.50 27.37 44.13 98.87 -5.54 7.98 -13.52 2.44 NA
278 NY-15 91.55 3.90 87.65 95.45 88.74 11.11 77.64 99.85 -2.81 7.20 -10.01 4.40 NA
279 NY-16 100.00 0.00 100.00 100.00 84.04 15.80 68.23 99.84 -15.96 15.80 -31.77 -0.16 NA
280 NY-17 62.22 33.71 28.51 95.93 59.29 35.24 24.05 94.53 -2.93 1.53 -4.46 -1.39 NA
281 NY-18 57.19 42.81 14.39 100.00 55.78 43.24 12.54 99.02 -1.41 0.44 -1.85 -0.98 NA
282 NY-19 55.30 41.65 13.65 96.95 54.45 42.94 11.52 97.39 -0.85 1.29 -2.14 0.44 NA
283 NY-2 48.99 47.43 1.56 96.42 46.02 52.92 -6.90 98.94 -2.97 5.50 -8.47 2.52 -8.47
284 NY-20 62.08 37.92 24.17 100.00 61.14 38.81 22.33 99.95 -0.94 0.89 -1.83 -0.05 NA
285 NY-21 41.51 58.49 -16.98 100.00 41.15 58.81 -17.66 99.96 -0.36 0.32 -0.68 -0.04 NA
286 NY-22 52.36 47.64 4.73 100.00 48.96 48.99 -0.03 97.95 -3.40 1.36 -4.76 -2.05 -4.76
287 NY-23 41.70 58.30 -16.61 100.00 41.11 57.69 -16.58 98.80 -0.59 -0.61 0.02 -1.20 NA
288 NY-24 48.76 51.24 -2.48 100.00 42.95 53.11 -10.16 96.07 -5.81 1.88 -7.69 -3.93 NA
289 NY-25 62.03 34.82 27.22 96.85 59.29 39.13 20.17 98.42 -2.74 4.31 -7.05 1.57 NA
290 NY-26 69.80 30.20 39.60 100.00 69.86 28.69 41.17 98.55 0.06 -1.51 1.57 -1.45 NA
291 NY-27 37.28 58.58 -21.30 95.86 38.99 59.71 -20.72 98.70 1.71 1.13 0.58 2.84 NA
292 NY-3 58.25 38.87 19.38 97.12 55.95 43.44 12.51 99.38 -2.31 4.57 -6.88 2.26 NA
293 NY-4 60.78 36.13 24.65 96.91 56.13 42.99 13.14 99.12 -4.65 6.86 -11.51 2.21 NA
294 NY-5 90.32 0.00 90.32 90.32 99.33 0.00 99.33 99.33 9.01 0.00 9.01 9.01 NA
295 NY-6 73.67 26.33 47.34 100.00 67.91 31.99 35.92 99.90 -5.75 5.66 -11.41 -0.10 NA
296 NY-7 87.18 9.05 78.12 96.23 84.75 14.42 70.33 99.17 -2.43 5.37 -7.80 2.94 NA
297 NY-8 89.10 10.90 78.20 100.00 84.76 15.16 69.61 99.92 -4.34 4.25 -8.59 -0.08 NA
298 NY-9 83.63 12.30 71.33 95.93 83.04 15.85 67.19 98.89 -0.59 3.55 -4.15 2.96 NA
299 OH-1 49.29 50.71 -1.41 100.00 44.65 51.80 -7.15 96.44 -4.64 1.09 -5.73 -3.56 NA
300 OH-10 45.23 54.77 -9.54 100.00 41.64 58.36 -16.71 100.00 -3.59 3.59 -7.17 0.00 NA
301 OH-11 79.30 20.70 58.59 100.00 80.05 19.95 60.11 100.00 0.76 -0.76 1.51 0.00 NA
302 OH-12 44.00 56.00 -11.99 100.00 41.78 55.24 -13.47 97.02 -2.23 -0.75 -1.47 -2.98 NA
303 OH-13 59.16 40.84 18.33 100.00 52.49 44.94 7.55 97.42 -6.68 4.10 -10.78 -2.58 NA
304 OH-14 41.08 58.92 -17.83 100.00 39.90 60.10 -20.20 100.00 -1.18 1.18 -2.36 0.00 NA
305 OH-15 37.67 62.33 -24.66 100.00 36.57 63.41 -26.85 99.98 -1.10 1.08 -2.19 -0.02 NA
306 OH-16 36.77 63.23 -26.47 100.00 36.81 63.19 -26.38 100.00 0.04 -0.04 0.09 0.00 NA
307 OH-2 39.65 60.35 -20.70 100.00 38.91 61.08 -22.17 99.99 -0.74 0.73 -1.47 -0.01 NA
308 OH-3 74.05 25.95 48.09 100.00 70.83 29.14 41.69 99.97 -3.22 3.19 -6.41 -0.03 NA
309 OH-4 32.78 63.73 -30.95 96.50 29.31 67.85 -38.54 97.17 -3.46 4.13 -7.59 0.66 NA
310 OH-5 37.11 62.89 -25.78 100.00 32.00 68.00 -36.00 100.00 -5.11 5.11 -10.21 0.00 NA
311 OH-6 28.80 71.20 -42.41 100.00 25.59 74.41 -48.83 100.00 -3.21 3.21 -6.42 0.00 NA
312 OH-7 35.29 64.71 -29.43 100.00 29.17 67.50 -38.32 96.67 -6.11 2.78 -8.90 -3.33 NA
313 OH-8 31.46 68.54 -37.07 100.00 31.01 68.95 -37.94 99.97 -0.45 0.42 -0.87 -0.03 NA
314 OH-9 67.75 32.25 35.50 100.00 63.07 36.91 26.16 99.99 -4.68 4.66 -9.34 -0.01 NA
315 OK-1 34.94 65.06 -30.12 100.00 32.68 63.70 -31.02 96.38 -2.26 -1.36 -0.90 -3.62 NA
316 OK-2 27.57 72.43 -44.85 100.00 22.00 75.04 -53.04 97.04 -5.58 2.61 -8.19 -2.96 NA
317 OK-3 23.31 76.69 -53.38 100.00 21.51 78.49 -56.98 100.00 -1.80 1.80 -3.61 0.00 NA
318 OK-4 30.09 69.91 -39.82 100.00 28.78 67.79 -39.01 96.56 -1.31 -2.12 0.81 -3.44 NA
319 OK-5 50.07 49.93 0.15 100.00 47.94 52.06 -4.12 100.00 -2.14 2.14 -4.27 0.00 -4.27
320 OR-1 67.00 33.00 34.00 100.00 64.59 35.21 29.39 99.80 -2.41 2.21 -4.62 -0.20 NA
321 OR-2 38.21 61.79 -23.57 100.00 36.92 59.86 -22.94 96.78 -1.29 -1.92 0.63 -3.22 NA
322 OR-3 73.08 21.82 51.26 94.91 73.02 23.50 49.52 96.52 -0.06 1.68 -1.73 1.62 NA
323 OR-4 53.43 46.57 6.85 100.00 51.52 46.20 5.32 97.72 -1.91 -0.37 -1.53 -2.28 NA
324 OR-5 57.94 42.06 15.88 100.00 51.89 45.15 6.74 97.04 -6.06 3.09 -9.15 -2.96 NA
325 PA-1 46.51 53.49 -6.97 100.00 43.44 56.56 -13.12 100.00 -3.07 3.07 -6.15 0.00 NA
326 PA-10 49.79 50.21 -0.42 100.00 46.69 53.31 -6.62 100.00 -3.10 3.10 -6.20 0.00 NA
327 PA-11 34.65 65.35 -30.69 100.00 36.88 63.12 -26.25 100.00 2.22 -2.22 4.45 0.00 NA
328 PA-12 29.20 70.80 -41.59 100.00 29.16 70.84 -41.68 100.00 -0.05 0.05 -0.09 0.00 NA
329 PA-13 26.57 73.43 -46.86 100.00 26.53 73.47 -46.95 100.00 -0.05 0.05 -0.09 0.00 NA
330 PA-14 33.43 66.57 -33.15 100.00 35.30 64.70 -29.39 100.00 1.88 -1.88 3.76 0.00 NA
331 PA-15 27.46 72.54 -45.07 100.00 26.54 73.46 -46.92 100.00 -0.92 0.92 -1.84 0.00 NA
332 PA-16 42.35 57.65 -15.29 100.00 40.66 59.34 -18.68 100.00 -1.69 1.69 -3.39 0.00 NA
333 PA-17 55.21 44.79 10.43 100.00 51.15 48.85 2.29 100.00 -4.07 4.07 -8.13 0.00 NA
334 PA-18 67.21 29.56 37.64 96.77 69.25 30.75 38.50 100.00 2.04 1.19 0.85 3.23 NA
335 PA-2 78.50 21.50 56.99 100.00 72.53 27.47 45.06 100.00 -5.96 5.96 -11.93 0.00 NA
336 PA-3 91.61 8.39 83.22 100.00 91.02 8.98 82.04 100.00 -0.59 0.59 -1.18 0.00 NA
337 PA-4 60.93 39.07 21.86 100.00 59.53 40.47 19.06 100.00 -1.40 1.40 -2.80 0.00 NA
338 PA-5 68.26 31.74 36.52 100.00 64.70 35.30 29.40 100.00 -3.56 3.56 -7.12 0.00 NA
339 PA-6 60.80 39.20 21.60 100.00 56.05 43.95 12.11 100.00 -4.74 4.74 -9.49 0.00 NA
340 PA-7 56.65 43.35 13.30 100.00 52.13 47.87 4.26 100.00 -4.52 4.52 -9.04 0.00 NA
341 PA-8 55.11 44.89 10.23 100.00 51.77 48.23 3.54 100.00 -3.34 3.34 -6.68 0.00 NA
342 PA-9 33.86 66.14 -32.29 100.00 33.67 66.33 -32.66 100.00 -0.19 0.19 -0.37 0.00 NA
343 RI-1 83.70 0.00 83.70 83.70 70.83 0.00 70.83 70.83 -12.88 0.00 -12.88 -12.88 NA
344 RI-2 64.42 35.58 28.83 100.00 58.24 41.54 16.70 99.78 -6.17 5.95 -12.13 -0.22 NA
345 SC-1 51.28 48.72 2.55 100.00 49.31 50.58 -1.27 99.90 -1.96 1.86 -3.82 -0.10 -3.82
346 SC-2 40.90 55.93 -15.02 96.83 42.59 55.66 -13.07 98.25 1.69 -0.27 1.95 1.42 NA
347 SC-3 28.79 71.21 -42.42 100.00 28.69 71.21 -42.52 99.91 -0.10 0.00 -0.10 -0.09 NA
348 SC-4 35.72 64.28 -28.56 100.00 36.89 61.61 -24.71 98.50 1.18 -2.67 3.85 -1.50 NA
349 SC-5 40.30 59.70 -19.39 100.00 39.86 60.07 -20.21 99.93 -0.45 0.37 -0.82 -0.07 NA
350 SC-6 70.85 25.85 45.00 96.70 68.18 30.82 37.36 98.99 -2.67 4.97 -7.64 2.30 NA
351 SC-7 38.08 61.92 -23.84 100.00 38.14 61.80 -23.66 99.94 0.06 -0.13 0.19 -0.06 NA
352 SD-1 0.00 100.00 -100.00 100.00 0.00 80.96 -80.96 80.96 0.00 -19.04 19.04 -19.04 NA
353 TN-1 24.70 75.30 -50.60 100.00 22.47 74.71 -52.24 97.18 -2.23 -0.59 -1.64 -2.82 NA
354 TN-2 32.14 67.86 -35.72 100.00 31.05 67.64 -36.59 98.70 -1.08 -0.22 -0.87 -1.30 NA
355 TN-3 29.67 66.95 -37.29 96.62 30.50 67.30 -36.80 97.80 0.83 0.35 0.48 1.18 NA
356 TN-4 33.68 66.32 -32.64 100.00 33.33 66.67 -33.33 100.00 -0.35 0.35 -0.69 0.00 NA
357 TN-5 100.00 0.00 100.00 100.00 99.99 0.00 99.99 99.99 -0.01 0.00 -0.01 -0.01 NA
358 TN-6 23.93 76.07 -52.13 100.00 23.99 73.68 -49.69 97.67 0.05 -2.39 2.44 -2.33 NA
359 TN-7 28.20 68.37 -40.17 96.57 27.33 69.93 -42.59 97.26 -0.87 1.55 -2.42 0.69 NA
360 TN-8 27.22 69.37 -42.15 96.60 29.50 68.47 -38.97 97.97 2.27 -0.90 3.18 1.37 NA
361 TN-9 76.67 19.77 56.90 96.43 77.37 20.10 57.27 97.47 0.70 0.33 0.37 1.03 NA
362 TX-1 28.61 71.39 -42.79 100.00 27.42 72.58 -45.16 100.00 -1.19 1.19 -2.37 0.00 NA
363 TX-10 42.59 54.41 -11.81 97.00 45.35 52.48 -7.13 97.83 2.75 -1.93 4.68 0.83 NA
364 TX-11 18.88 81.12 -62.25 100.00 18.30 79.71 -61.41 98.01 -0.58 -1.42 0.84 -1.99 NA
365 TX-12 29.89 70.11 -40.23 100.00 33.04 63.72 -30.68 96.75 3.15 -6.40 9.55 -3.25 NA
366 TX-13 16.72 83.28 -66.55 100.00 18.46 79.38 -60.93 97.84 1.73 -3.89 5.62 -2.16 NA
367 TX-14 37.61 62.39 -24.79 100.00 38.36 61.64 -23.28 100.00 0.75 -0.75 1.51 0.00 NA
368 TX-15 59.43 40.57 18.85 100.00 50.50 47.62 2.88 98.12 -8.92 7.05 -15.97 -1.88 NA
369 TX-16 70.96 29.04 41.91 100.00 64.72 35.28 29.44 100.00 -6.24 6.24 -12.47 0.00 NA
370 TX-17 40.45 59.55 -19.10 100.00 40.92 55.85 -14.93 96.77 0.47 -3.70 4.17 -3.23 NA
371 TX-18 73.57 22.88 50.69 96.45 73.29 23.51 49.79 96.80 -0.28 0.63 -0.91 0.35 NA
372 TX-19 21.93 78.07 -56.14 100.00 22.86 74.78 -51.92 97.63 0.93 -3.29 4.22 -2.37 NA
373 TX-2 39.07 60.93 -21.85 100.00 42.79 55.61 -12.82 98.41 3.72 -5.31 9.03 -1.59 NA
374 TX-20 66.69 30.08 36.61 96.77 64.67 33.11 31.56 97.78 -2.02 3.03 -5.05 1.00 NA
375 TX-21 46.63 50.43 -3.81 97.06 45.35 51.95 -6.60 97.30 -1.27 1.52 -2.80 0.25 NA
376 TX-22 48.18 51.82 -3.64 100.00 44.60 51.53 -6.93 96.13 -3.58 -0.29 -3.29 -3.87 NA
377 TX-23 50.59 45.63 4.97 96.22 46.60 50.56 -3.96 97.17 -3.99 4.94 -8.93 0.95 -8.93
378 TX-24 47.68 48.17 -0.49 95.84 47.48 48.81 -1.33 96.28 -0.20 0.64 -0.84 0.44 NA
379 TX-25 45.19 54.81 -9.61 100.00 42.11 55.93 -13.82 98.03 -3.09 1.12 -4.21 -1.97 NA
380 TX-26 32.57 67.43 -34.86 100.00 37.25 60.61 -23.36 97.86 4.68 -6.82 11.51 -2.14 NA
381 TX-27 32.74 67.26 -34.51 100.00 34.94 63.06 -28.12 97.99 2.19 -4.20 6.39 -2.01 NA
382 TX-28 67.62 32.38 35.25 100.00 58.30 38.98 19.32 97.28 -9.33 6.60 -15.93 -2.72 NA
383 TX-29 74.94 25.06 49.89 100.00 71.13 27.38 43.76 98.51 -3.81 2.32 -6.13 -1.49 NA
384 TX-3 44.19 55.81 -11.62 100.00 42.87 55.07 -12.20 97.94 -1.32 -0.74 -0.57 -2.06 NA
385 TX-30 77.95 22.05 55.91 100.00 77.49 18.41 59.08 95.90 -0.47 -3.64 3.17 -4.10 NA
386 TX-31 43.39 56.61 -13.23 100.00 44.29 53.43 -9.14 97.72 0.90 -3.18 4.08 -2.28 NA
387 TX-32 52.63 44.22 8.41 96.86 51.95 45.93 6.02 97.88 -0.68 1.71 -2.39 1.03 NA
388 TX-33 73.97 22.56 51.41 96.53 66.82 25.15 41.67 91.97 -7.15 2.59 -9.74 -4.56 NA
389 TX-34 63.11 33.69 29.42 96.80 55.43 41.84 13.59 97.28 -7.67 8.16 -15.83 0.48 NA
390 TX-35 68.68 28.02 40.67 96.70 65.37 29.95 35.43 95.32 -3.31 1.93 -5.24 -1.38 NA
391 TX-36 23.47 72.95 -49.49 96.42 24.27 73.61 -49.35 97.88 0.80 0.66 0.14 1.46 NA
392 TX-4 21.83 78.17 -56.34 100.00 22.59 75.14 -52.55 97.74 0.77 -3.03 3.79 -2.26 NA
393 TX-5 32.45 67.55 -35.11 100.00 35.93 61.99 -26.07 97.92 3.48 -5.56 9.04 -2.08 NA
394 TX-6 44.43 55.57 -11.13 100.00 43.98 52.80 -8.82 96.78 -0.45 -2.77 2.31 -3.22 NA
395 TX-7 52.62 47.38 5.24 100.00 50.79 47.45 3.33 98.24 -1.84 0.07 -1.91 -1.76 NA
396 TX-8 21.66 78.34 -56.68 100.00 25.47 72.51 -47.04 97.98 3.81 -5.83 9.64 -2.02 NA
397 TX-9 77.97 18.43 59.54 96.40 75.48 21.64 53.85 97.12 -2.49 3.21 -5.69 0.72 NA
398 UT-1 33.64 66.36 -32.72 100.00 30.43 69.52 -39.08 99.95 -3.21 3.16 -6.36 -0.05 NA
399 UT-2 38.80 61.20 -22.41 100.00 36.63 59.00 -22.37 95.63 -2.16 -2.20 0.04 -4.37 NA
400 UT-3 28.35 60.36 -32.00 88.71 26.77 68.73 -41.96 95.49 -1.59 8.37 -9.96 6.78 NA
401 UT-4 46.48 45.44 1.04 91.93 46.70 47.70 -1.00 94.39 0.21 2.25 -2.04 2.47 -2.04
402 VA-1 43.07 56.93 -13.87 100.00 41.71 58.15 -16.44 99.86 -1.36 1.22 -2.58 -0.14 NA
403 VA-10 59.59 40.41 19.17 100.00 56.51 43.37 13.14 99.88 -3.08 2.96 -6.04 -0.12 NA
404 VA-11 72.47 27.53 44.95 100.00 71.39 28.32 43.06 99.71 -1.09 0.80 -1.88 -0.29 NA
405 VA-2 53.96 46.04 7.92 100.00 51.55 45.81 5.75 97.36 -2.41 -0.23 -2.17 -2.64 NA
406 VA-3 69.64 30.36 39.28 100.00 68.35 31.43 36.92 99.78 -1.29 1.07 -2.36 -0.22 NA
407 VA-4 62.37 37.63 24.74 100.00 61.62 38.23 23.39 99.85 -0.75 0.61 -1.36 -0.15 NA
408 VA-5 49.94 50.06 -0.12 100.00 47.30 52.44 -5.14 99.75 -2.64 2.39 -5.02 -0.25 NA
409 VA-6 36.36 63.64 -27.28 100.00 35.29 64.59 -29.30 99.87 -1.07 0.95 -2.02 -0.13 NA
410 VA-7 53.23 46.77 6.46 100.00 50.82 49.00 1.82 99.82 -2.41 2.23 -4.64 -0.18 NA
411 VA-8 77.86 22.14 55.72 100.00 75.79 23.98 51.81 99.77 -2.07 1.83 -3.90 -0.23 NA
412 VA-9 0.00 100.00 -100.00 100.00 0.00 93.98 -93.98 93.98 0.00 -6.02 6.02 -6.02 NA
413 VT-1 69.99 30.01 39.98 100.00 67.31 27.01 40.30 94.31 -2.68 -3.00 0.32 -5.69 NA
414 WA-1 62.97 37.03 25.93 100.00 58.55 41.33 17.23 99.88 -4.41 4.29 -8.71 -0.12 NA
415 WA-10 100.00 0.00 100.00 100.00 84.89 0.00 84.89 84.89 -15.11 0.00 -15.11 -15.11 NA
416 WA-2 70.06 29.94 40.13 100.00 63.09 36.67 26.41 99.76 -6.98 6.74 -13.71 -0.24 NA
417 WA-3 46.68 53.32 -6.63 100.00 43.39 56.37 -12.98 99.77 -3.29 3.06 -6.35 -0.23 NA
418 WA-4 33.69 66.31 -32.62 100.00 33.63 66.21 -32.58 99.84 -0.06 -0.10 0.04 -0.16 NA
419 WA-5 39.64 60.36 -20.72 100.00 38.51 61.29 -22.77 99.80 -1.13 0.93 -2.06 -0.20 NA
420 WA-6 64.65 35.35 29.31 100.00 59.30 40.45 18.85 99.76 -5.35 5.11 -10.46 -0.24 NA
421 WA-7 86.46 13.54 72.91 100.00 82.99 16.77 66.22 99.76 -3.47 3.23 -6.70 -0.24 NA
422 WA-8 57.92 42.08 15.84 100.00 51.71 48.15 3.57 99.86 -6.20 6.07 -12.27 -0.14 NA
423 WA-9 78.10 21.90 56.20 100.00 74.14 25.70 48.44 99.83 -3.97 3.80 -7.77 -0.17 NA
424 WI-1 40.23 59.77 -19.54 100.00 40.61 59.31 -18.69 99.92 0.39 -0.46 0.85 -0.08 NA
425 WI-2 73.18 26.82 46.36 100.00 69.67 30.25 39.42 99.92 -3.51 3.43 -6.94 -0.08 NA
426 WI-3 54.29 45.71 8.59 100.00 51.30 48.64 2.66 99.94 -2.99 2.94 -5.93 -0.06 NA
427 WI-4 77.59 22.41 55.17 100.00 74.65 22.70 51.94 97.35 -2.94 0.29 -3.23 -2.65 NA
428 WI-5 38.87 61.13 -22.27 100.00 39.83 60.11 -20.27 99.94 0.97 -1.03 1.99 -0.06 NA
429 WI-6 39.99 60.01 -20.03 100.00 40.72 59.23 -18.50 99.95 0.73 -0.79 1.52 -0.05 NA
430 WI-7 40.61 59.39 -18.77 100.00 39.21 60.73 -21.52 99.95 -1.40 1.35 -2.74 -0.05 NA
431 WI-8 37.38 62.62 -25.25 100.00 35.79 64.18 -28.39 99.97 -1.58 1.56 -3.14 -0.03 NA
432 WV-1 32.30 67.70 -35.41 100.00 31.02 68.98 -37.95 100.00 -1.27 1.27 -2.55 0.00 NA
433 WV-2 37.96 62.04 -24.08 100.00 36.92 63.08 -26.15 100.00 -1.03 1.03 -2.07 0.00 NA
434 WV-3 31.96 68.04 -36.07 100.00 28.66 71.34 -42.67 100.00 -3.30 3.30 -6.60 0.00 NA
435 WY-1 31.19 68.81 -37.63 100.00 24.58 68.56 -43.99 93.14 -6.61 -0.25 -6.36 -6.86 NA
436 TOTAL 52.65 46.72 5.93 99.37 50.80 47.75 3.06 98.55 -1.85 1.03 -2.88 -0.82 NA
Source: 538 data: Model outputs - Click "Model outputs" (after "Download the data") to download
election-forecasts-2020.zip, unzip, use file house_district_toplines_2020.csv
Actual data: 2020 National House Vote Tracker,Cook Political Report -
click on "Downoad for Excel" to download House Popular Vote Tracker.xlsx
This shows a comparison of the predictions to the actual results in all 435 House races. As can be seen in the last column, a number of them flipped. The following table shows all of the flipped districts by sorting the table by the last column and displaying those rows that have non-NA values:
Shift in Margin Vote Share from House_538_deluxe_2020 to House_2020 Race in U.S. (Percent)

     AREA   DEM1   REP1 MARGIN1 TOTAL1   DEM2   REP2 MARGIN2 TOTAL2 DEM_SH REP_SH MAR_SH TOT_SH   FLIP
106 FL-26  54.10  45.90    8.21 100.00  48.28  51.72   -3.45 100.00  -5.83   5.83 -11.66   0.00 -11.66
131  IA-1  54.01  45.99    8.03 100.00  48.65  51.25   -2.60  99.90  -5.36   5.26 -10.62  -0.10 -10.62
107 FL-27  53.58  46.42    7.16 100.00  48.62  51.36   -2.74  99.98  -4.96   4.93  -9.89  -0.02  -9.89
377 TX-23  50.59  45.63    4.97  96.22  46.60  50.56   -3.96  97.17  -3.99   4.94  -8.93   0.95  -8.93
132  IA-2  54.27  45.73    8.53 100.00  49.91  49.91    0.00  99.82  -4.36   4.18  -8.54  -0.18  -8.54
283  NY-2  48.99  47.43    1.56  96.42  46.02  52.92   -6.90  98.94  -2.97   5.50  -8.47   2.52  -8.47
266  NM-2  50.48  49.52    0.96 100.00  46.25  53.70   -7.45  99.96  -4.23   4.18  -8.41  -0.04  -8.41
274 NY-11  50.83  49.17    1.67 100.00  46.78  53.05   -6.28  99.83  -4.06   3.89  -7.95  -0.17  -7.95
64  CA-48  52.04  47.96    4.08 100.00  48.94  51.06   -2.12 100.00  -3.10   3.10  -6.20   0.00  -6.20
257  NJ-2  50.03  49.97    0.05 100.00  46.17  51.93   -5.76  98.10  -3.86   1.95  -5.81  -1.90  -5.81
54  CA-39  52.30  47.70    4.61 100.00  49.40  50.60   -1.20 100.00  -2.90   2.90  -5.80   0.00  -5.80
286 NY-22  52.36  47.64    4.73 100.00  48.96  48.99   -0.03  97.95  -3.40   1.36  -4.76  -2.05  -4.76
319  OK-5  50.07  49.93    0.15 100.00  47.94  52.06   -4.12 100.00  -2.14   2.14  -4.27   0.00  -4.27
159  IN-5  50.02  49.98    0.05 100.00  45.94  50.02   -4.08  95.97  -4.08   0.05  -4.13  -4.03  -4.13
345  SC-1  51.28  48.72    2.55 100.00  49.31  50.58   -1.27  99.90  -1.96   1.86  -3.82  -0.10  -3.82
35  CA-21  50.92  49.08    1.83 100.00  49.55  50.45   -0.89 100.00  -1.36   1.36  -2.72   0.00  -2.72
401  UT-4  46.48  45.44    1.04  91.93  46.70  47.70   -1.00  94.39   0.21   2.25  -2.04   2.47  -2.04
39  CA-25  50.49  49.51    0.99 100.00  49.95  50.05   -0.10 100.00  -0.54   0.54  -1.09   0.00  -1.09
126  GA-7  49.34  50.66   -1.31 100.00  51.39  48.61    2.78 100.00   2.05  -2.05   4.10   0.00   4.10
1    AK-1  46.85  53.15   -6.30 100.00  45.26  54.40   -9.14  99.67  -1.58   1.25  -2.83  -0.33     NA

Source: 538 data: Model outputs - Click "Model outputs" (after "Download the data") to download
        election-forecasts-2020.zip, unzip, use file house_district_toplines_2020.csv
        Actual data: 2020 National House Vote Tracker,Cook Political Report -
        click on "Downoad for Excel" to download House Popular Vote Tracker.xlsx
As can be seen, 19 House districts flipped from their predicted to their actual results and all but one of them flipped from a predicted Democrat win to an actual Republican win.
Comparing the House Predictions and Results via the Plot Tab
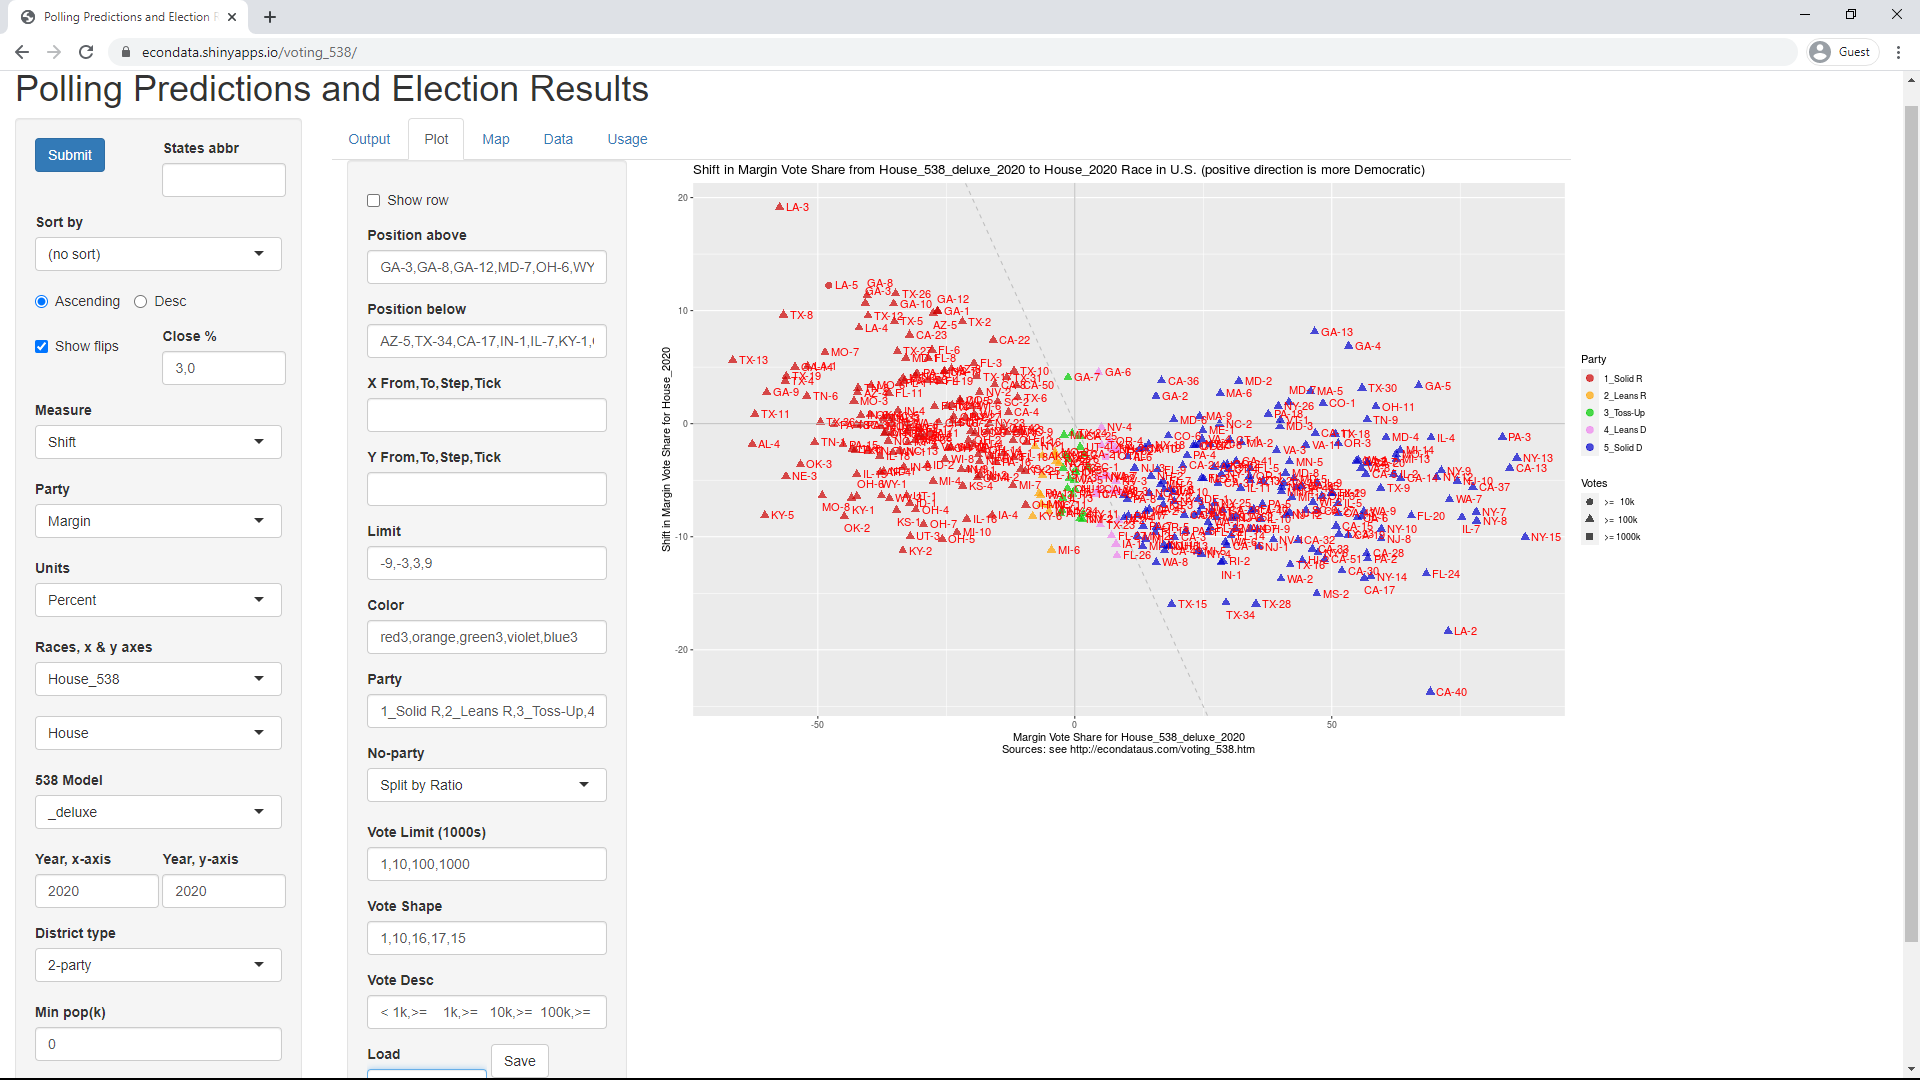
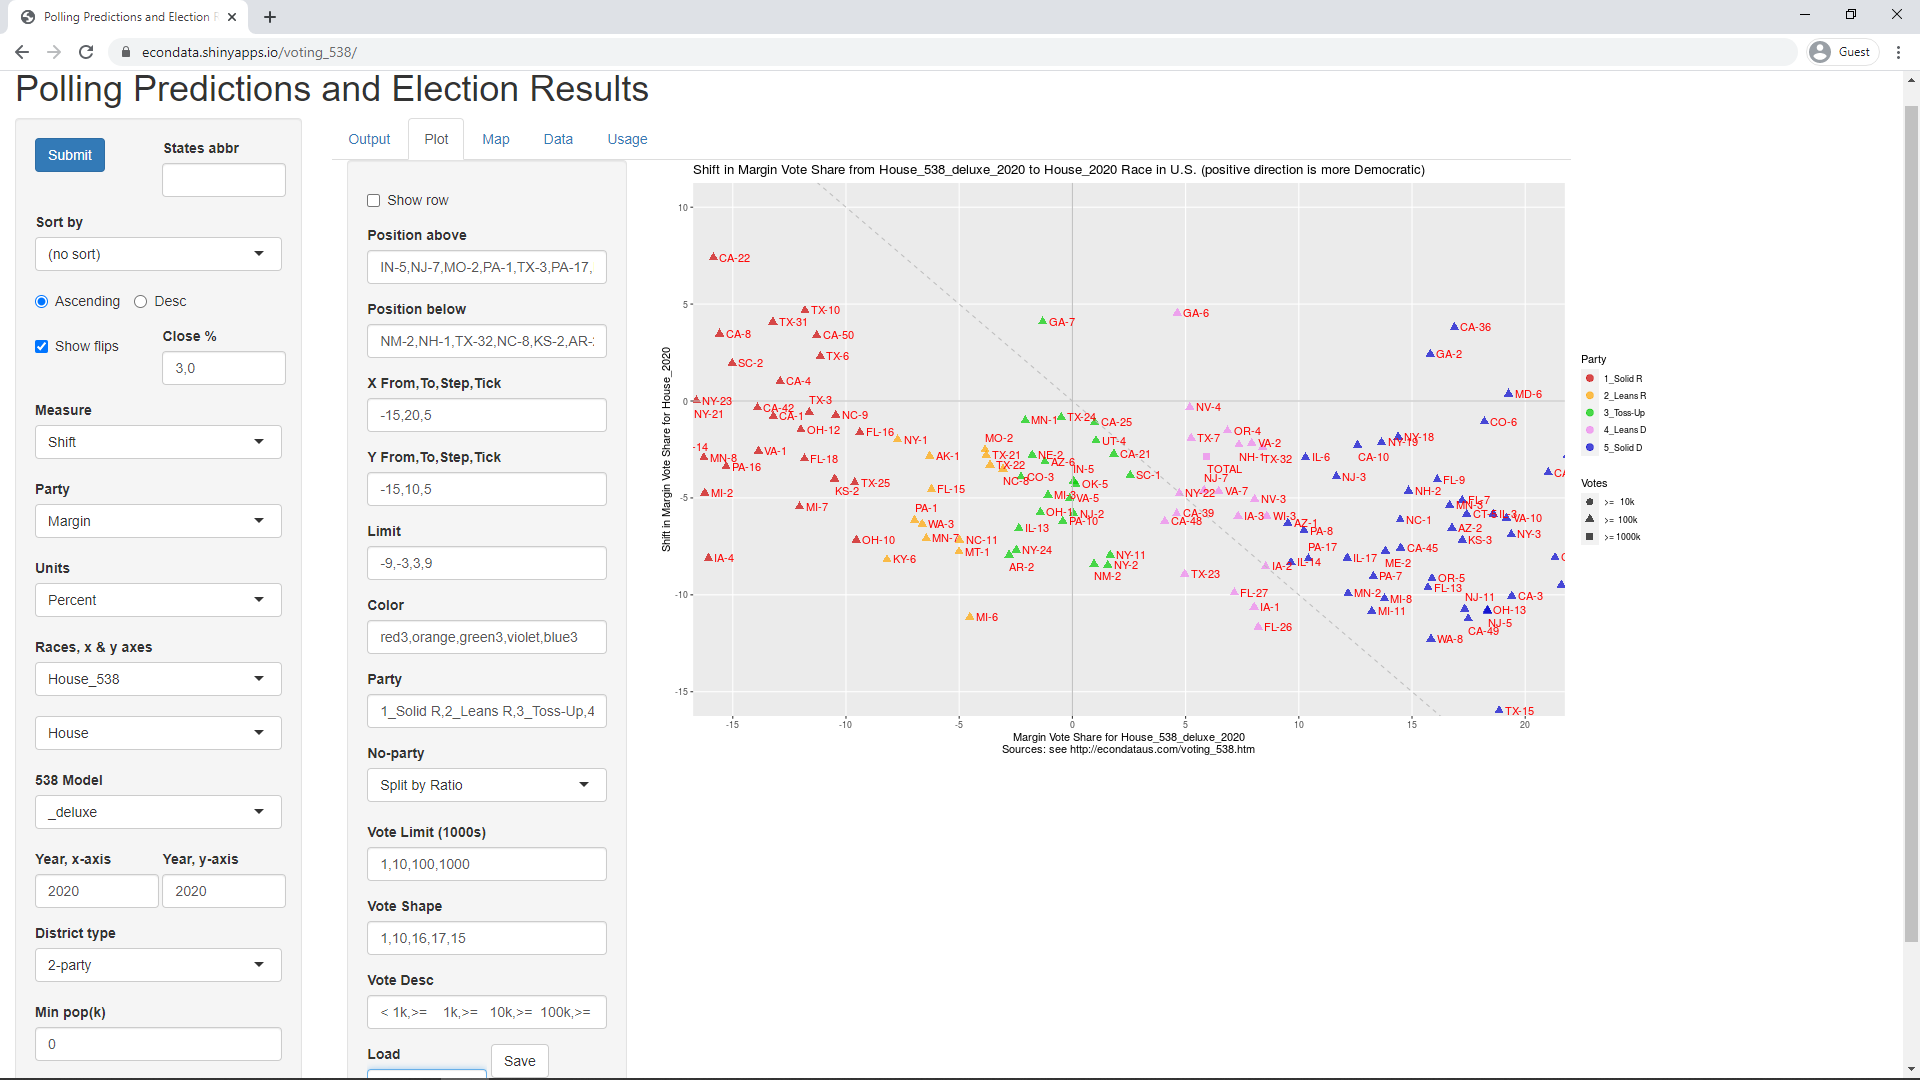
Comparing the House Predictions and Results via the Map Tab
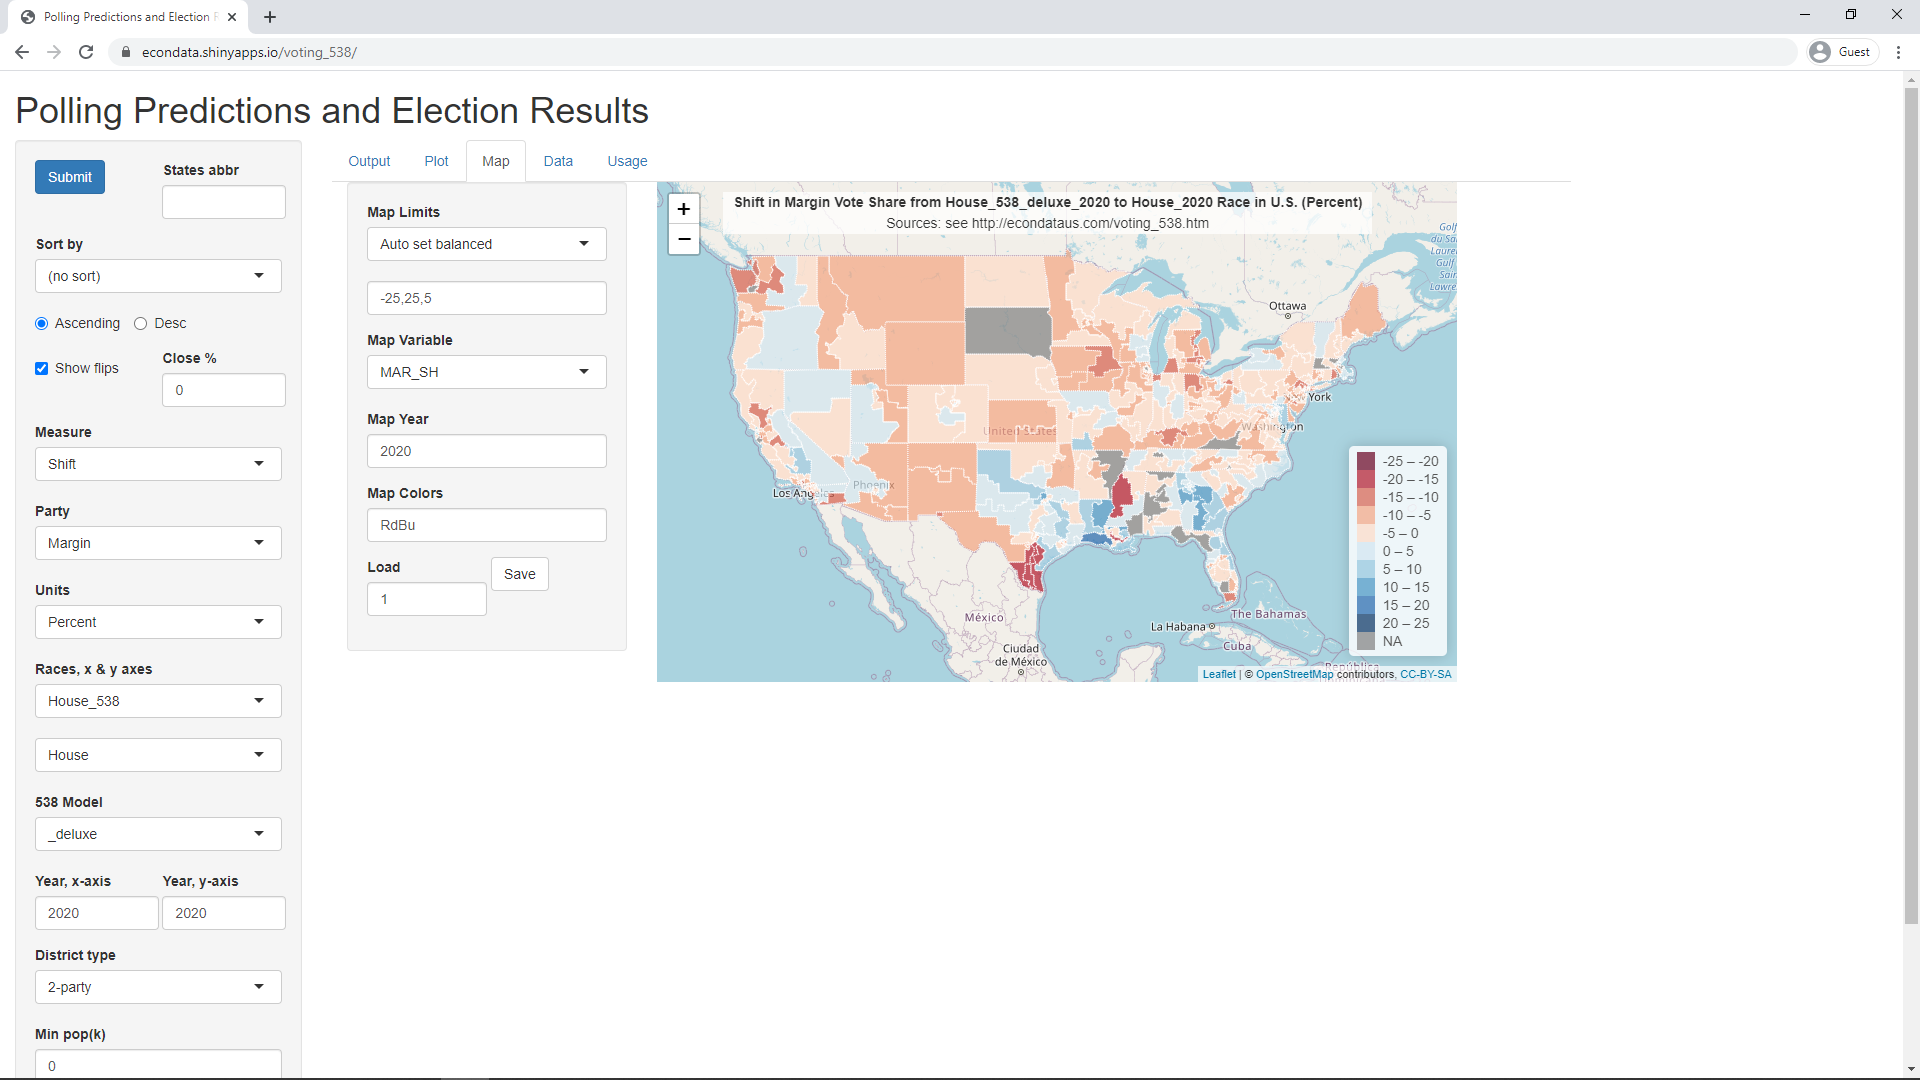

Polling Place Equipment of House Races that Flipped between Predictions and Results
          PREDICT  ACTUAL MARGIN
 N  AREA   MARGIN  MARGIN  SHIFT    COUNTY      VOTES   POLLING PLACE EQUIPMENT
 1  FL-26    8.21   -3.45 -11.66    Miami-Dade  296k    ES&S DS200 HF OS & DS850 BF OS, ExpressVote BMD, VR Systems EViD EPB, Democracy Live OmniBallot Online RBMS CS
                                    Monroe       47k    Dominion ImageCast Evolution Hybrid OS/BMD & ImageCast Central BF OS (mail/absentee)
 2  IA-1     8.03   -2.60 -10.62    Linn        126k    ES&S DS200 HF OS & DS850 BF OS (mail/absentee), ExpressVote BMD, KNOWiNK Poll Pad EPB
                                    Black Hawk   65k    ES&S DS200 HF OS & DS850 BF OS (mail/absentee), ExpressVote BMD, IPAC Precinct Atlas EPB
                                    Dubuque      53k    Unisyn VS, OpenElect OVO HF OS & OVCS BF OS (mail/absentee), OpenElect OVI-VC BMD, Tenex Precinct Central EPB
                                    Marshall     17k... Unisyn VS, OpenElect OVO HF OS & OVCS BF OS (mail/absentee), OpenElect OVI BMD, IPAC Precinct Atlas EPB
 3  FL-27    7.16   -2.74  -9.89    Miami-Dade  296k    ES&S DS200 HF OS & DS850 BF OS, ExpressVote BMD, VR Systems EViD EPB, Democracy Live OmniBallot Online RBMS CS
 4  TX-23    4.97   -3.96  -8.93    Bexar       159k    ES&S DS200,DS450,DS850 OS, ExpressVote BMD*, ExpressTouch DRE (curbside), Votec EPB
                                    El Paso      24k    ES&S DS200 & DS450 OS, ExpressVote BMD*, ExpressTouch DRE (curbside), KNOWiNK Poll Pad EPB
                                    Medina       22k    Hart InterCivic Verity Touch DRE* w/o VVPAT, Verity Scan & Central OS (mail/absentee), KNOWiNK Poll Pad EPB
                                    Val Verde    15k    ES&S Model 100 HF OS & 650 BF OS, AutoMARK BMD, KNOWiNK Poll Pad EPB, Democracy Live RBMS SS (military/overseas)
                                    Maverick     15k... ES&S Model 650 BF OS, AutoMARK BMD, (Paper PB)
 5  IA-2     8.53    0.00  -8.54    Scott        90k    ES&S DS200 HF OS & DS850 BF OS (mail/absentee), ExpressVote BMD, IPAC Precinct Atlas EPB
                                    Johnson      80k    ES&S DS200 HF OS & DS850 BF OS (mail/absentee), ExpressVote BMD, IPAC Precinct Atlas EPB
                                    Clinton      24k    ES&S DS200 HF OS & DS850 BF OS (mail/absentee), ExpressVote BMD, IPAC Precinct Atlas EPB
                                    Muscatine    20k... ES&S DS200 HF OS & DS450 BF OS (mail/absentee), ExpressVote BMD, IPAC Precinct Atlas EPB
 6  NY-2     1.56   -6.90  -8.47    Suffolk     247k    Dominion ImageCast Evolution & Precinct Hybrid OS/BMD, Clear Ballot ClearCount BF OS (mail/absentee), KNOWiNK Poll Pad EPB
                                    Nassau      111k    ES&S DS200 HF OS & DS850 BF OS (mail/absentee), AutoMARK BMD, KNOWiNK Poll Pad EPB
 7  NM-2     0.96   -7.45  -8.41    Dona Ana     81k    Dominion ImageCast Evolution Hybrid OS/BMD & ImageCast Central BF OS (mail/absentee), Robis AskED ePollbook EPB
                                    Velencia     28k    Dominion ImageCast Evolution Hybrid OS/BMD & ImageCast Central BF OS (mail/absentee), Robis AskED ePollbook EPB
                                    Otero        23k    Dominion ImageCast Evolution Hybrid OS/BMD, Robis AskED ePollbook EPB
                                    Eddy         23k    Dominion ImageCast Evolution Hybrid OS/BMD, Robis AskED ePollbook EPB
                                    Chaves       22k    Dominion ImageCast Evolution Hybrid OS/BMD, Robis AskED ePollbook EPB
                                    Lea          20k... Dominion ImageCast Evolution Hybrid OS/BMD, Robis AskED ePollbook EPB
 8  NY-11    1.67   -6.28  -7.95    Richmond    218k    ES&S DS200 HF OS, AutoMARK BMD, Clear Ballot ClearCount BF OS (mail/absentee), KNOWiNK Poll Pad EPB
                                    Kings        83k    ES&S DS200 HF OS, AutoMARK BMD, Clear Ballot ClearCount BF OS (mail/absentee), KNOWiNK Poll Pad EPB
 9  CA-48    4.08   -2.12  -6.20    Orange      395k    Hart InterCivic Verity Scan HF OS & Verity Central BF OS, Verity Touch Writer BMD, Tenex Precinct Central EPB, Democracy Live RBMS Client-Side
10  NJ-2     0.05   -5.76  -5.81    Atlantic    135k    ES&S DS450 Batch-Fed OS,Sequoia AVC Advantage DRE, VotingWorks VX Accessible Vote-by-Mail
                                    Cumberland   60k    Dominion ImageCast Central BFOS,Sequoia AVC Advantage DRE, VotingWorks VX Accessible Vote-by-Mail
                                    Cape May     57k    Dominion ImageCast Central BFOS,Sequoia AVC Advantage DRE, VotingWorks VX Accessible Vote-by-Mail
                                    Gloucester   52k    ES&S DS450 Batch-Fed OS, ES&S ExpressVote XL Hybrid BMD/Tabulator, VotingWorks VX Accessible Vote-by-Mail
11  CA-39    4.61   -1.20  -5.80    Orange      105k    Hart InterCivic Verity Scan HF OS & Verity Central BF OS, Verity Touch Writer BMD, Tenex Precinct Central EPB, Democracy Live RBMS Client-Side
                                    Los Angeles  46k    Smartmatic/LA County BMD*, LA County VSAP Tally BF OS, KNOWiNK Poll Pad EPB, Smartmatic/LA VSAP Interactive Sample Ballot RBMS Client-Side
                                    San Bernan.  19k    Dominion ImageCast Central BF OS & ImageCast X BMD, KNOWiNK Poll Pad EPB, Democracy Live Secure Select RBMS Client-Side
12  NY-22    4.73   -0.03  -4.76    Broome       92k    Dominion ImageCast Precinct Hybrid OS/BMD, Clear Ballot ClearCount BF OS (mail/absentee), Tenex Precinct Central EPB
                                    Herkimer     25k    Dominion ImageCast Precinct Hybrid OS/BMD & Hand-Fed OS, KNOWiNK Poll Pad EPB
                                    Oswego       22k    Dominion ImageCast Precinct Hybrid OS/BMD & Hand-Fed OS, Tenex Precinct Central EPB
                                    Tioga         6k    Dominion ImageCast Precinct Hybrid OS/BMD, Clear Ballot ClearCount BF OS (mail/absentee), Robis AskED ePollbook EPB
13  OK-5     0.15   -4.12  -4.27    Oklahoma    268k    Hart InterCivic eScan Hybrid OS/DRE & Ballot Now BF OS, Enhanced Voting MyBallot RBMS Server-Side (military/overseas)
                                    Pottawatomie 27k    Hart InterCivic eScan Hybrid OS/DRE & Ballot Now BF OS, Enhanced Voting MyBallot RBMS Server-Side (military/overseas)
                                    Seminole      8k    Hart InterCivic eScan Hybrid OS/DRE & Ballot Now BF OS, Enhanced Voting MyBallot RBMS Server-Side (military/overseas)
14  IN-5     0.05   -4.08  -4.13    Hamilton    193k    MicroVote Infinity DRE with VVPAT, MicroVote/Chatsworth Scanner OS (mail/absentee), KNOWiNK Poll Pad EPB
                                    Marion      106k    ES&S DS200 HF OS & DS850 BF OS, ES&S ExpressVote BMD*, KNOWiNK Poll Pad EPB
                                    Grant        27k    MicroVote Infinity DRE w/o VVPAT, MicroVote/Chatsworth Scanner OS (mail/absentee), (paper poll book)
15  SC-1     2.55   -1.27  -3.82    Charleston  175k    ES&S DS200 HF OS & DS450 BF OS, ES&S ExpressVote BMD, ES&S ExpressPoll EPB
                                    Beaufort     92k    ES&S DS200 HF OS & DS450 BF OS, ES&S ExpressVote BMD, ES&S ExpressPoll EPB
                                    Berkeley     92k    ES&S DS200 HF OS & DS450 BF OS, ES&S ExpressVote BMD, ES&S ExpressPoll EPB
                                    Dorchester   67k    ES&S DS200 HF OS & DS450 BF OS, ES&S ExpressVote BMD, ES&S ExpressPoll EPB
16  CA-21    1.83   -0.89  -2.72    Kern         63k    Dominion ImageCast Central BF OS, ImageCast X BMD, Tenex Precinct Central EPB, ImageCast Remote RBMS Client-Side
                                    Fresno       58k    Dominion ImageCast Central BF OS & Evolution Hybrid OS/BMD, ImageCast X BMD, DFM Vote Center App EPB, Democracy Live RBMS Client-Side
                                    Kings        44k    Dominion ImageCast Central BF OS, ImageCast X BMD, OS/BMD, KNOWiNK Poll Pad EPB, ImageCast Remote RBMS Client-Side
                                    Tulare        6k    Dominion ImageCast Central BF OS & Evolution Hybrid OS/BMD, ImageCast X BMD, KNOWiNK Poll Pad, ImageCast Remote RBMS Client-Side
17  UT-4     1.04   -1.00  -2.04    Salt Lake   305k    Premier Election Solutions (Diebold) AccuVote TSX DRE-Touchscreen, AccuVote OS Central BF OS, KNOWiNK Poll Pad EPB
                                    Utah         60k... ES&S DS850 BF OS, ES&S ExpressVote BMD, KNOWiNK Poll Pad EPB, Voatz Mobile Voting App Internet Voting System
18  CA-25    0.99   -0.10  -1.09    Los Angeles 272k    Smartmatic/LA County BMD*, LA County VSAP Tally BF OS, KNOWiNK Poll Pad EPB, Smartmatic/LA VSAP Interactive Sample Ballot RBMS Client-Side
                                    Ventura      67k    Dominion ImageCast Central BF OS & ImageCast X BMD, DFM EIMS EPB, ImageCast Remote RBMS Client-Side
19  GA-7    -1.31    2.78   4.10    Forsyth      91k    Dominion ImageCast X BMD*, ImageCast Precinct HF OS & ImageCast Central BF OS, KNOWiNK Poll Pad EPB
                                    Gwinnett      ??    Dominion ImageCast X BMD*, ImageCast Precinct HF OS & ImageCast Central BF OS, KNOWiNK Poll Pad EPB
Key: BMD = Ballot Marking Device (BMD* = Ballot Marking Device used for all voters)
     DRE = Direct-Recording Electronic voting machine
     EPB = Electronic Poll Book
     OS  = Optical Scanner (HF OS = Hand-Fed Optical Scanner, BF OS = Batch-Fed Optical Scanner)
     RBMS CS = Remote Ballot Marking System: Client-Side (for overseas and military voters and voters with disabilities)
     RBMS SS = Remote Ballot Marking System: Server-Side (for overseas and military voters only)
     ES&S DS200 are HF OS (Hand-Fed Optical Scanners)
     ES&S DS450 & DS850 are BF OS (Batch-Fed Optical Scanners) used for Mail/Absentee Ballots
     ES&S DS200 and similar equipment are highlighted in red due to security questions raised here and here.
     BMDs (Ballot Marking Devices) being used by all voters are highlighed in orange due to security questions raised here.
     DREs (Direct-Recording Electronic devices) are highlighted in violet due to security questions raised here.

Source: Polling Place Equipment: Verified Voting (select state and click Display button)
        Election Results in Selected States: GA, NJ, NM, NY, OK, UT
Polling Place Equipment of Additional House Races that were listed as Tossup Districts in the New York Times
The following table shows the main polling place equipment used in the key counties (those with the most votes) in house races that were designated as "Tossup districts" in the New York Times but not mentioned in the prior section. These include chiefly races that were tossup races but leaned Republican and shifted further Republican. These are listed from the most severe red shift (as judged by the 538 predictions) to the one race (TX-10) that had a blue shift.
          PREDICT  ACTUAL MARGIN
    AREA   MARGIN  MARGIN  SHIFT    COUNTY      VOTES   POLLING PLACE EQUIPMENT
20  AR-2    -2.79  -10.73  -7.94    Pulaski      169k   ES&S DS200 & DS450 OS, ExpressVote BMD*, ExpressPoll EPB
                                    Saline        57k   ES&S DS200 & DS450 OS, ExpressVote BMD*, ExpressPoll EPB
                                    Faulkner      54k   ES&S DS200 & DS450 OS, ExpressVote BMD*, ExpressPoll EPB
                                    White         31k   ES&S DS200 OS, ExpressVote BMD*, ExpressPoll EPB
21  NY-24   -2.48  -10.16  -7.69    Onondaga     238k   Dominion ImageCast Evolution & Precinct Hybrid OS/BMD, ImageCast Central BF OS, KNOWiNK Poll Pad EPB
                                    Wayne         45k   Dominion ImageCast Evolution & Precinct Hybrid OS/BMD, Hand Counted Paper Ballots
                                    Cayuga        37k   Dominion ImageCast Precinct Hybrid OS/BMD, Clear Ballot ClearCount BF OS, Robis AskED ePollbook EPB
                                    Oswego        33k   Dominion ImageCast Evolution & Precinct Hybrid OS/BMD, Hand Counted Paper Ballots, Tenex Precinct Central EPB
22  MN-7    -6.45  -13.54  -7.09    Otter Tail    36k   ES&S DS200 HF OS, AutoMARK BMD, KNOWiNK Poll Pad EPB
                                    Clay          32k   ES&S DS200 HF OS & DS450 BF OS, AutoMARK BMD, KNOWiNK Poll Pad EPB
                                    Douglas       24k   ES&S DS200 HF OS & DS450 BF OS, Democracy Live OmniBallot Tablet BMD,  KNOWiNK Poll Pad EPB
                                    Kandiyohi     23k   ES&S DS200 HF OS, AutoMARK BMD, KNOWiNK Poll Pad EPB
                                    Mcleod        21k   ES&S DS200 HF OS & DS450 BF OS, AutoMARK BMD, KNOWiNK Poll Pad EPB
                                    Becker        19k.. ES&S DS200 HF OS & Model 100 HF OS, AutoMARK BMD, Paper Poll Book
23  IL-13   -2.36   -8.93  -6.56    Champaign     69k   ES&S DS200 HF OS, AutoMARK BMD, Platinum Technology Resource Poll Book EPB, VotingWorks VX Accessible Vote-by-Mail RBMS Client-Side
                                    Madison       59k   ES&S DS200 HF OS & Model 100 HF OS, AutoMARK BMD, Votec VoteSafe EPB, VotingWorks VX Accessible Vote-by-Mail RBMS Client-Side
                                    Macon         49k   Unisyn Voting Solutions OpenElect OVO HF OS & OVCS BF OS, OpenElect OVI BMD, Votec VoteSafe EPB, VotingWorks VX Accessible Vote-by-Mail RBMS Client-Side
                                    Sangamon      43k   ES&S Model 100 HF OS & Model 650 BF OS, AutoMARK BMD, Platinum Technology Resource Poll Book EPB, VotingWorks VX Accessible Vote-by-Mail RBMS Client-Side
                                    Macoupin      24k   Unisyn Voting Solutions OpenElect OVO HF OS, OpenElect Freedom Vote Tablet BMD, Votec VoteSafe EPB, VotingWorks VX Accessible Vote-by-Mail RBMS Client-Side
                                    McLean        24k.. Premier Election Solutions (Diebold) AccuVote OS, AccuVote TSX DRE-Touchscreen, Votec VoteSafe EPB, VotingWorks VX Accessible Vote-by-Mail RBMS Client-Side
24  PA-10   -0.42   -6.62  -6.20    Dauphin      145k   Clear Ballot ClearCast HF OS & ClearCount BF OS, ClearAccess BMD, Paper Poll Book, Democracy Live OmniBallot Online RBMS Server-Side
                                    York         130k   Dominion ImageCast Precinct HF OS & Central BF OS, ImageCast X BMD (accessibility), Paper Poll Book, Democracy Live OmniBallot Online RBMS Server-Side
                                    Cumberland   117k   ES&S DS850 BF OS, ExpressVote XL Hybrid BMD/Tabulator, Paper Poll Book, Democracy Live OmniBallot Online RBMS Server-Side
25  OH-1    -1.41   -7.15  -5.73    Hamilton     251k   Hart InterCivic Verity Scan HF OS & Verity Central BF OS, Verity Touch Writer BMD, Tenex Precinct Central EPB, Democracy Live Secure Select RBMS Client-Side
                                    Warren       134k   Clear Ballot ClearCast HF OS & ClearCount BF OS, ClearAccess BMD, ES&S ExpressPoll EPB, TRIAD Governmental Systems, Inc. ABMT RBMS Client-Side
26  VA-5    -0.12   -5.14  -5.02    Albemarle     64k   ES&S DS200 HF OS, AutoMARK BMD, VR Systems EViD EPB, Enhanced Voting MyBallot RBMS Server-Side
                                    Fauquier      35k   ES&S DS200 HF OS, ExpressVote BMD, DemTech Advocate Precinct EPB, Enhanced Voting MyBallot RBMS Server-Side
                                    Pittsylvania  34k   ES&S DS200 HF OS, AutoMARK BMD, VR Systems EViD EPB, Enhanced Voting MyBallot RBMS Server-Side
                                    Campbell      30k   Hart InterCivic Verity Scan HF OS & Verity Central BF OS, Verity Touch Writer BMD, DemTech Advocate Precinct EPB, Enhanced Voting MyBallot RBMS Server-Side
                                    Franklin      29k   Dominion Voting Systems ImageCast Evolution Hybrid Optical Scan/BMD, VR Systems EViD EPB, KNOWiNK MyBallot RBMS Server-Side
                                    Bedford       26k   Dominion Voting Systems ImageCast Evolution Hybrid Optical Scan/BMD, DemTech Advocate Precinct EPB, Enhanced Voting MyBallot RBMS Server-Side
                                    Charlottesville 24k ES&S DS200 HF OS, ExpressVote BMD, VR Systems EViD EPB, Enhanced Voting MyBallot RBMS Server-Side
27  MI-3    -1.07   -5.92  -4.85    Kent         270k   Dominion ImageCast Precinct HF OS & Central BF OS, ImageCast X BMD (accessibility), State of Michigan MI BoE Electronic Pollbook EPB
                                    Calhoun       65k   Dominion ImageCast Precinct HF OS & Central BF OS, ImageCast X BMD (accessibility), State of Michigan MI BoE Electronic Pollbook EPB
28  TX-22   -3.64   -6.93  -3.29    Fort Bend    145k   ES&S DS200 HF OS & DS450 BF OS, ExpressVote BMD*, ExpressTouch DRE-Touchscreen, Votec VoteSafe EPB
                                    Brazoria      88k   Hart InterCivic Verity Touch DRE-Touchscreen, Verity Touch Writer BMD & Ballot Now BF OS, Robis AskED ePollbook EPB, Democracy Live OmniBallot Online RBMS Server-Side
                                    Harris        43k   Hart InterCivic eSlate DRE-Dial, Hart InterCivic Ballot Now BF OS, ContentActive Electronic Pollbook EPB
29  AZ-6    -1.22   -4.35  -3.13    Maricopa     417k   Dominion ImageCast Precinct HF OS & Central BF OS, ImageCast X BMD (accessibility), Robis AskED ePollbook EPB
30  TX-21   -3.81   -6.60  -2.80    Bexar        141k   ES&S DS200,DS450,DS850 OS, ExpressVote BMD*, ExpressTouch DRE (curbside), Votec EPB
                                    Comal         71k   Hart InterCivic Verity Touch DRE-Touchscreen, Verity Central BF OS, KNOWiNK Poll Pad EPB
31  NE-2    -1.77   -4.56  -2.79    Douglas      274k   ES&S DS850 BF OS, ES&S ExpressVote BMD, Paper Poll Book
                                    Sarpy         63k   ES&S DS450 BF OS, ES&S ExpressVote BMD, Paper Poll Book
32  MO-2    -3.86   -6.37  -2.51    St. Louis    348k   Hart InterCivic Verity Scan HF OS & Verity Central BF OS, Verity Touch Writer BMD, KNOWiNK Poll Pad EPB, Missouri SoS Movotes Internet Voting System
                                    St. Charles   80k   Unisyn Voting Solutions OpenElect OVO HF OS, OpenElect OVI BMD, KNOWiNK Poll Pad EPB, Missouri SoS Movotes Internet Voting System
                                    Jefferson     22k   Unisyn Voting Solutions OpenElect OVO HF OS & OpenElect OVCS BF OS, OpenElect Freedom Vote Tablet BMD, Tenex Precinct Central EPB, Missouri SoS Movotes Internet Voting System
33  MN-1    -2.08   -3.07  -1.00    Olmsted       90k   ES&S DS200 HF OS & DS850 BF OS, AutoMARK BMD, KNOWiNK Poll Pad EPB
                                    Blue Earth    35k   ES&S DS200 HF OS & DS450 BF OS, Democracy Live OmniBallot Tablet BMD, KNOWiNK Poll Pad EPB
                                    Winona        27k.. ES&S DS200 HF OS, AutoMARK BMD, KNOWiNK Poll Pad EPB
34  TX-10  -11.81   -7.13   4.68    Harris        43k   Hart InterCivic eSlate DRE-Dial, Hart InterCivic Ballot Now BF OS, ContentActive Electronic Pollbook EPB
                                    Travis       144k   ES&S DS200 HF OS & DS450 BF OS, ExpressVote BMD*, ExpressTouch DRE-Touchscreen, Tenex Precinct Central EPB, Democracy Live OmniBallot Online RBMS Server-Side
Key: BMD = Ballot Marking Device (BMD* = Ballot Marking Device used for all voters)
     DRE = Direct-Recording Electronic voting machine
     EPB = Electronic Poll Book
     OS  = Optical Scanner (HF OS = Hand-Fed Optical Scanner, BF OS = Batch-Fed Optical Scanner)
     RBMS CS = Remote Ballot Marking System: Client-Side (for overseas and military voters and voters with disabilities)
     RBMS SS = Remote Ballot Marking System: Server-Side (for overseas and military voters only)
     ES&S DS200 are HF OS (Hand-Fed Optical Scanners)
     ES&S DS450 & DS850 are BF OS (Batch-Fed Optical Scanners) used for Mail/Absentee Ballots
     ES&S DS200 and similar equipment are highlighted in red due to security questions raised here and here.
     BMDs (Ballot Marking Devices) being used by all voters are highlighed in orange due to security questions raised here.
     DREs (Direct-Recording Electronic devices) are highlighted in violet due to security questions raised here.

Source: Polling Place Equipment: Verified Voting (select state and click Display button)
        Election Results in Selected States: GA, NJ, NM, NY, OK, UT