Checking the Shift Between Two Races via the Output Tab
On November 13, 2020, The Texas Tribune posted an article titled "Donald Trump made inroads in South Texas this year. These voters explain why." The article begins by describing a surprising amount of support for Trump in Starr County which sits on the Texas-Mexico border. It then lists the following statistics:
Ten days later, when the election results came in, the rest of Texas was just as surprised at what happened in Starr County. After losing the county by 60 percentage points to Hillary Clinton, President Donald Trump lost it by just 5% to Joe Biden.
In neighboring Zapata County, which Clinton won by 33 percentage points in 2016, voters didn't just swing more to the right - the county flipped all the way red.
It is possible to check these numbers in the Shiny application at https://econdata.shinyapps.io/voting_stats/. Going to that URL and selecting TX for "State abbr", President for both select lists under "Races, x & y axes", 2016 for "Year, x-axis, and 2020 for "Year, y-axis will display the following screen:
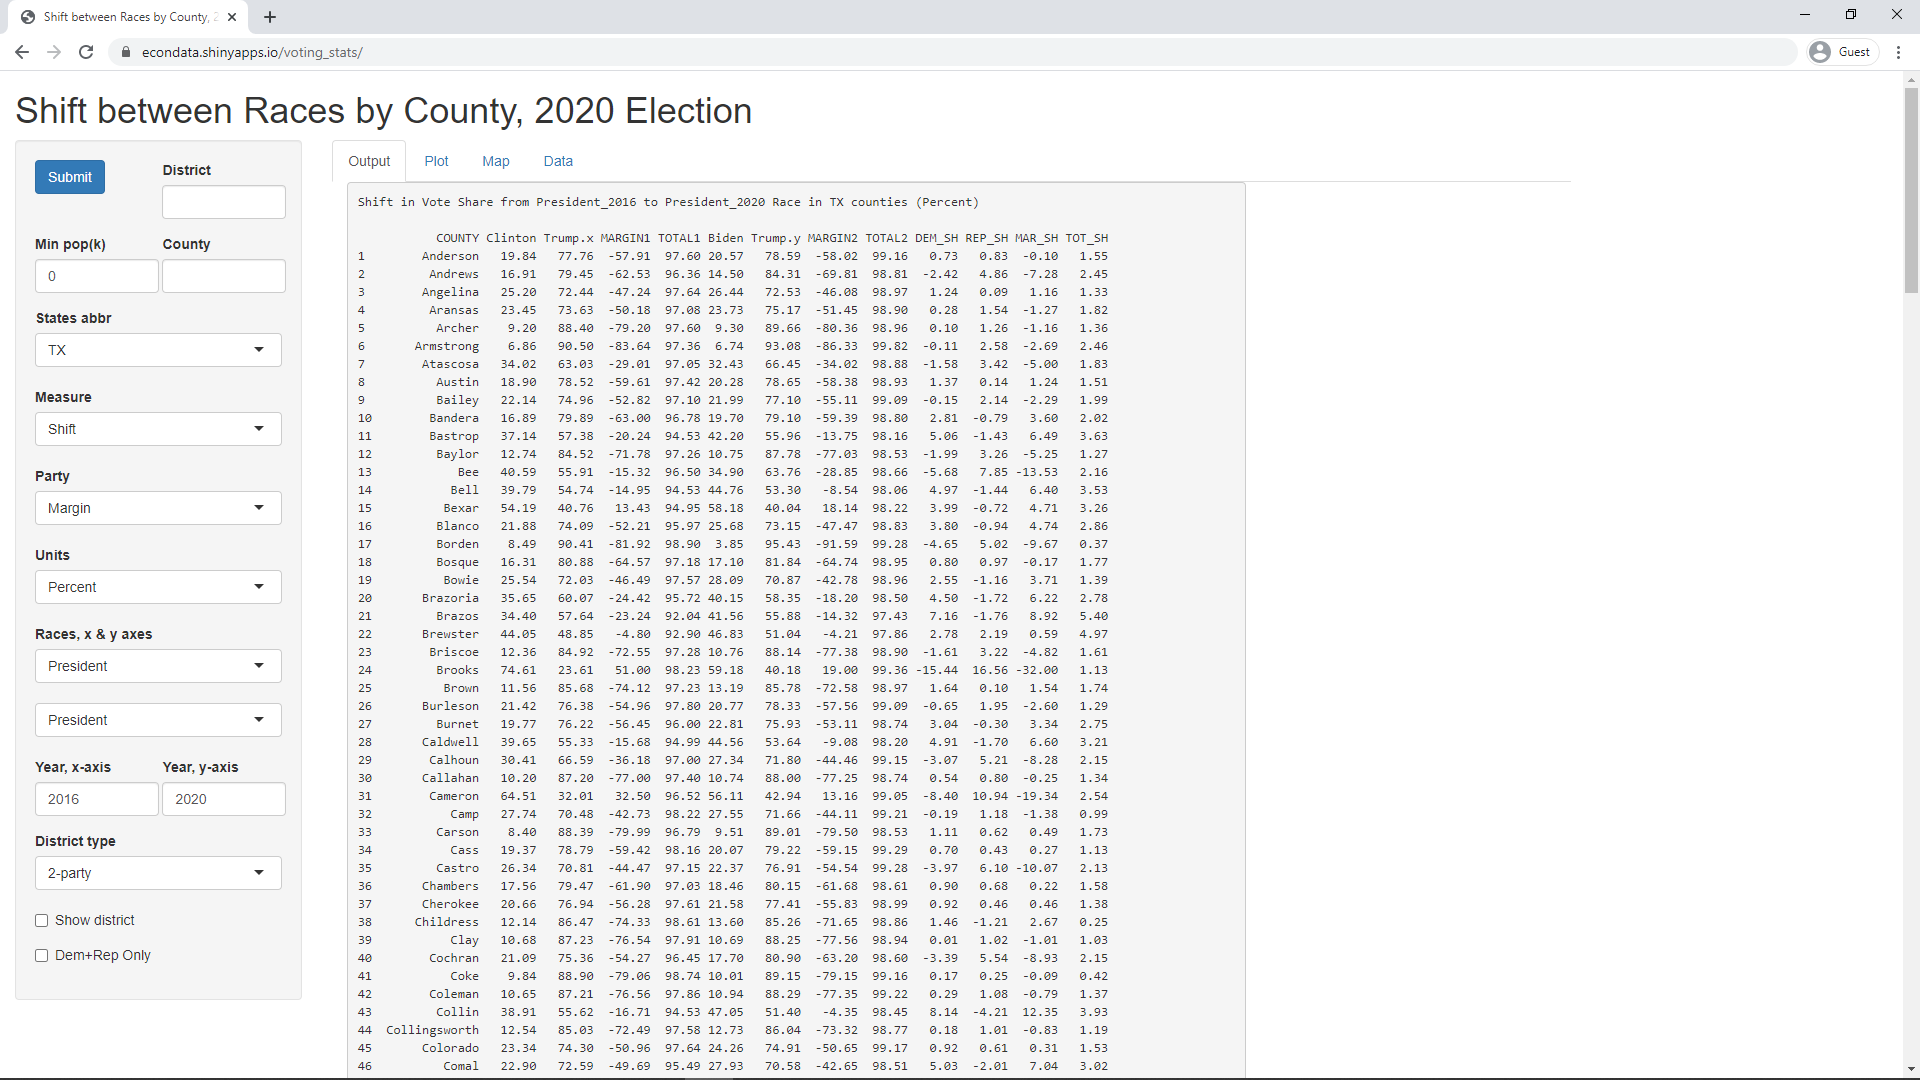
Scrolling down the page, following are the lines for Starr and Zapata counties, along with the total state:
Shift in Vote Share from President_2016 to President_2020 Race in TX counties (Percent)

           COUNTY Clinton Trump.x MARGIN1 TOTAL1 Biden Trump.y MARGIN2 TOTAL2 DEM_SH REP_SH MAR_SH TOT_SH
214         Starr   79.12   18.94   60.18  98.07 52.06   47.06    5.00  99.12 -27.07  28.11 -55.18   1.05
253        Zapata   65.66   32.75   32.91  98.41 47.13   52.48   -5.34  99.61 -18.52  19.73 -38.25   1.20
255         TOTAL   43.24   52.23   -9.00  95.47 46.48   52.06   -5.58  98.54   3.24  -0.18   3.42   3.07
As can be seen, the article is correct in that Clinton won Starr County by 60.18% (MARGIN1) in 2016 but Biden won it by just 5% (MARGIN2) in 2016. Also, Clinton won Zapata County by 32.91% in 2016 but Biden lost it by 5.34% in 2020. Those are shifts of 55.18% and 38.25% in those two counties.
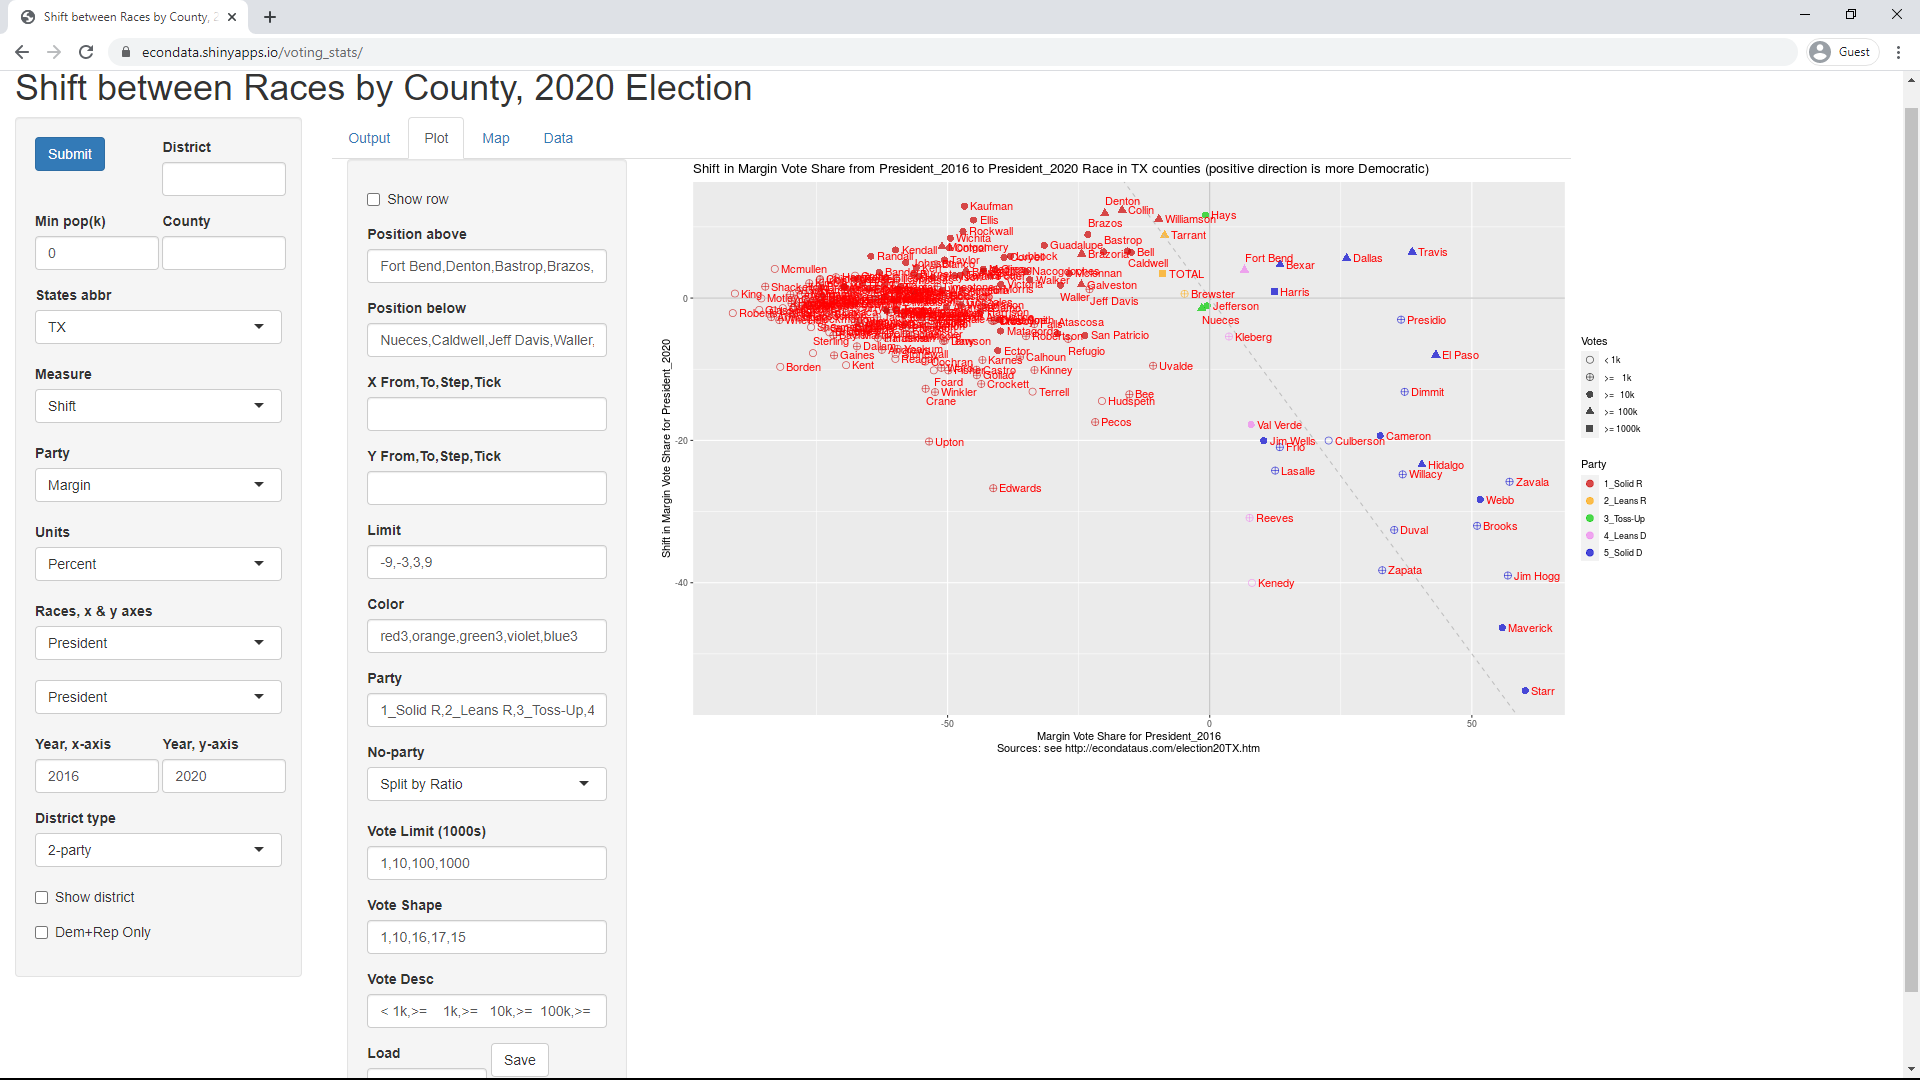
Selecting the Plot tab will display the following screen:
As can be seen, the plot shows the shifts of 55% and 38% in Starr and Zapata Counties. It also shows large shifts in Jim Hogg, Kenedy, and Maverick Counties. These shifts are all negative and are often called "red shifts" because they favor Republicans (as opposed to "blue shifts" which favor Democrats). As the lower legend to the right of the plot shows, red dots mark counties that are "Solid Republican" and blue dots mark counties that are "Solid Democratic". The upper legend shows symbols for counties according to the total number of votes in each county. Following is a short explanation for all of the inputs on this page:
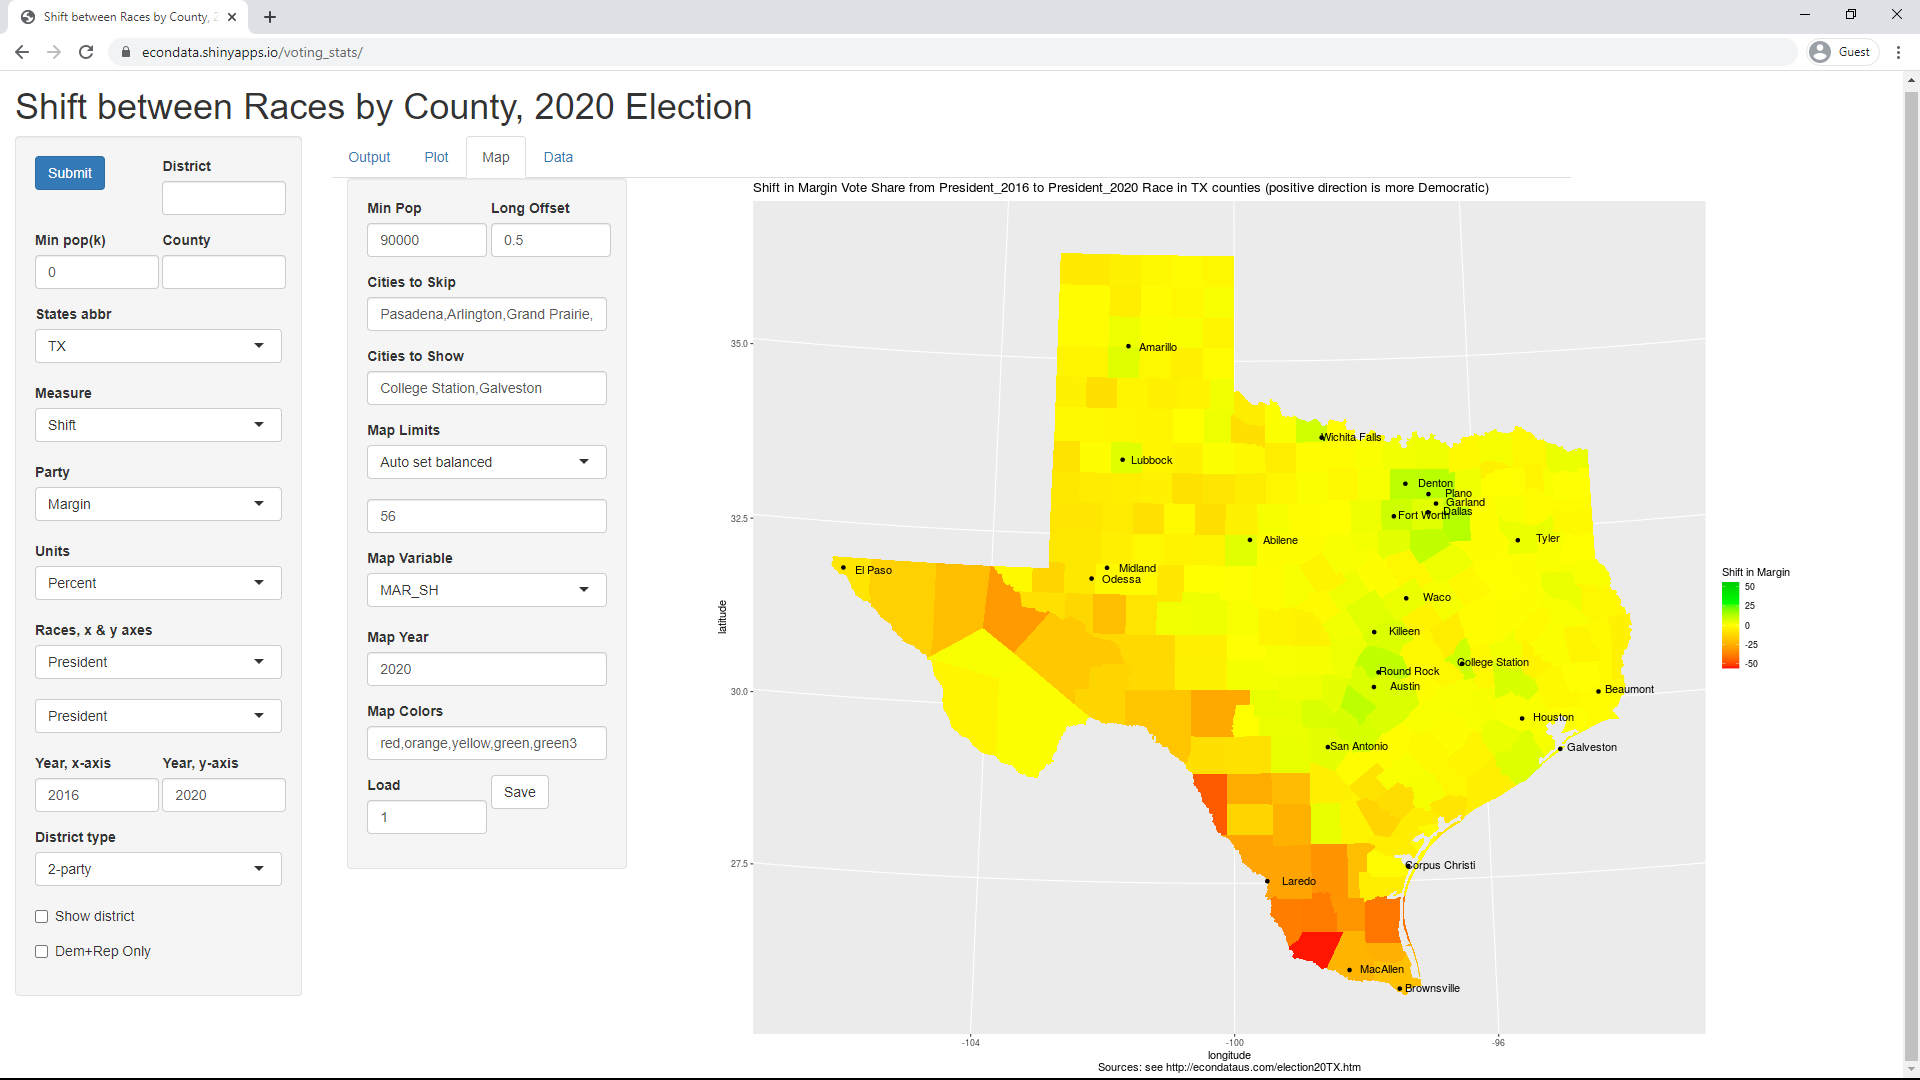
One limitation of the plot is that it doesn't show the relative location of the counties. Selecting the Map tab will display the following screen:
This map does clearly show the red shift along the counties on the Texas-Mexico border. Starr County is the red one in south Texas, just west of McAllen and Zapata County borders Starr County on the northwest, also along the border. The map also shows the mild blue shift in the counties containing and around Dallas, Austin, San Antonio, and a few other cities. Following is a short explanation for all of the inputs on this page:
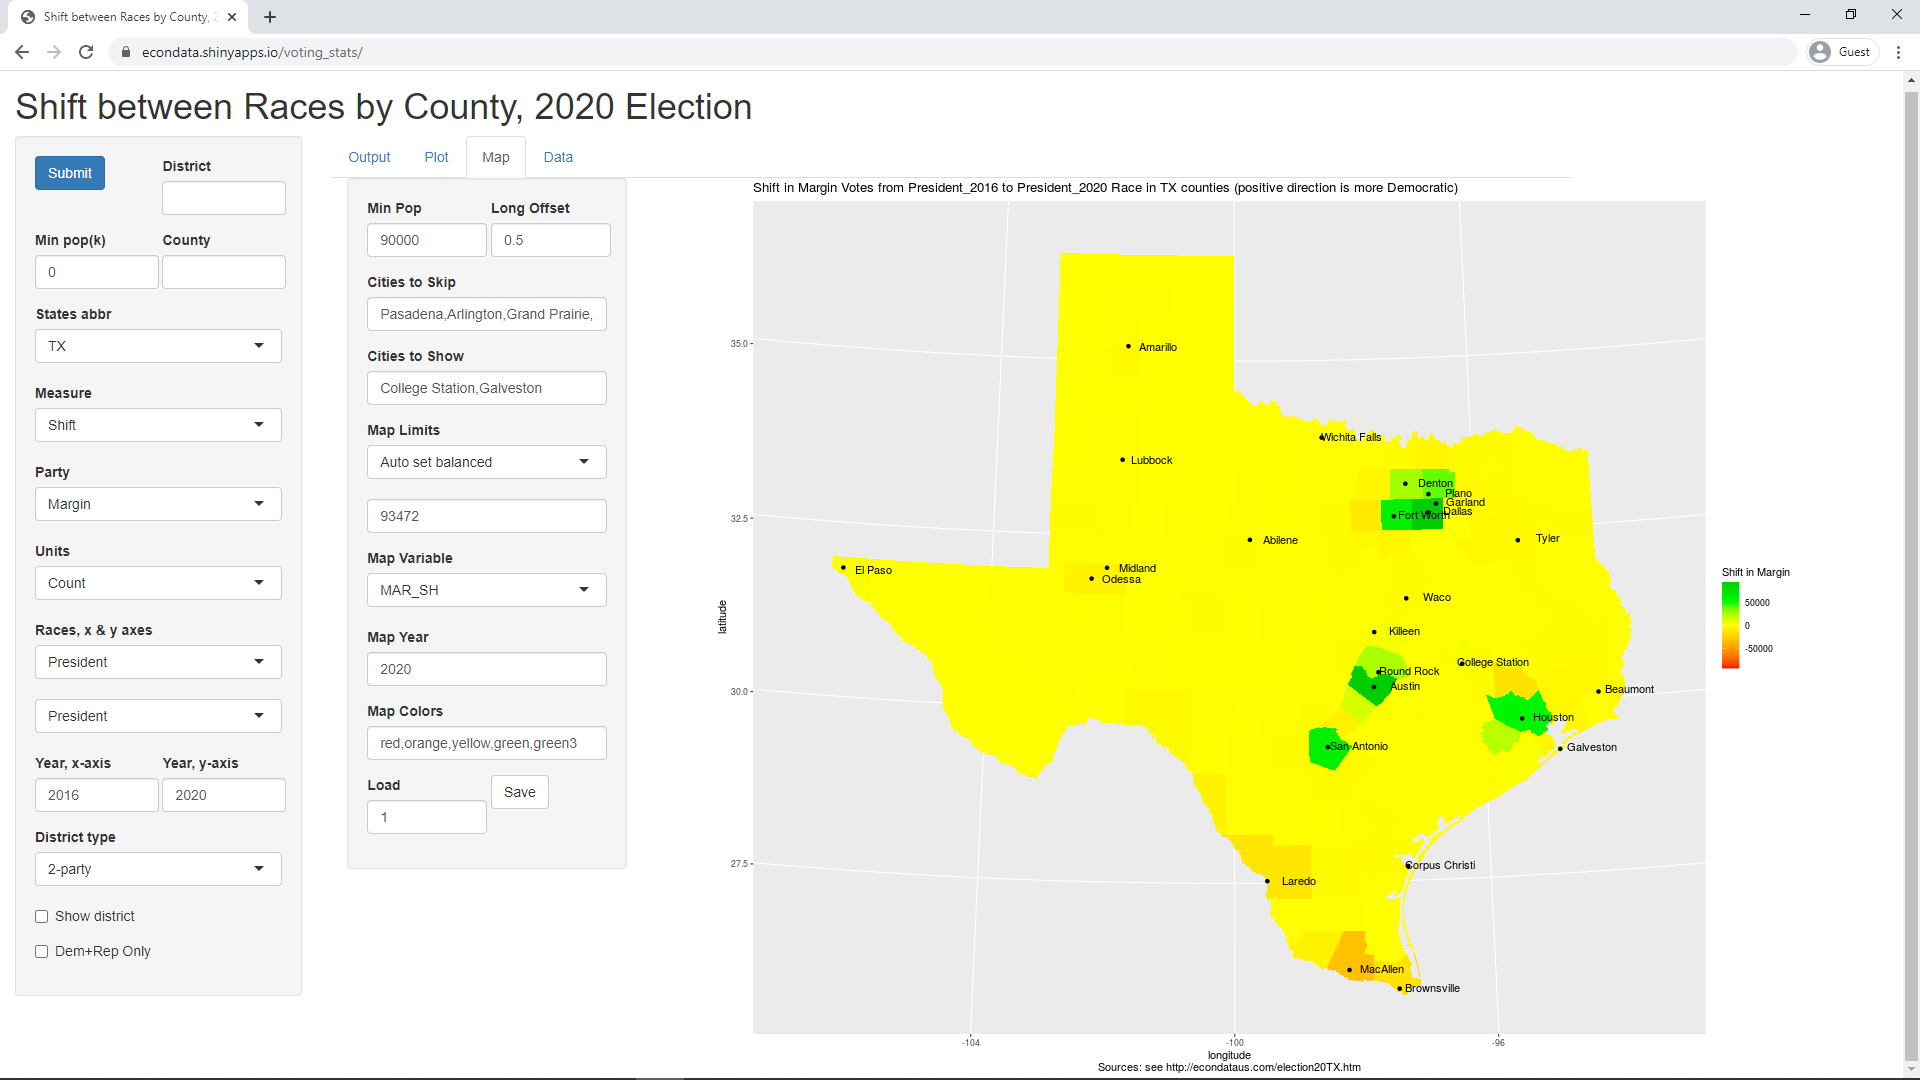
The map above implies that the effect of the red shift on the Texas-Mexico border is greater than the effect on the major cities. But it should be noted that the map shows the margins in percent. The percents are important in that they allow one to measure the relative shift regardless of population. However, it is the shift in votes that will most effect the outcome of the election. Simply changing the input "Units" in the leftmost panel of inputs from "Percent" to "Count" will display the following screen:
This shows that the largest shifts in actual votes occurred in the counties containing and nearby Dallas, Houston, Austin, and San Antonio. The county with the largest red shift in votes was Hidalgo County which contains McAllen, Texas.
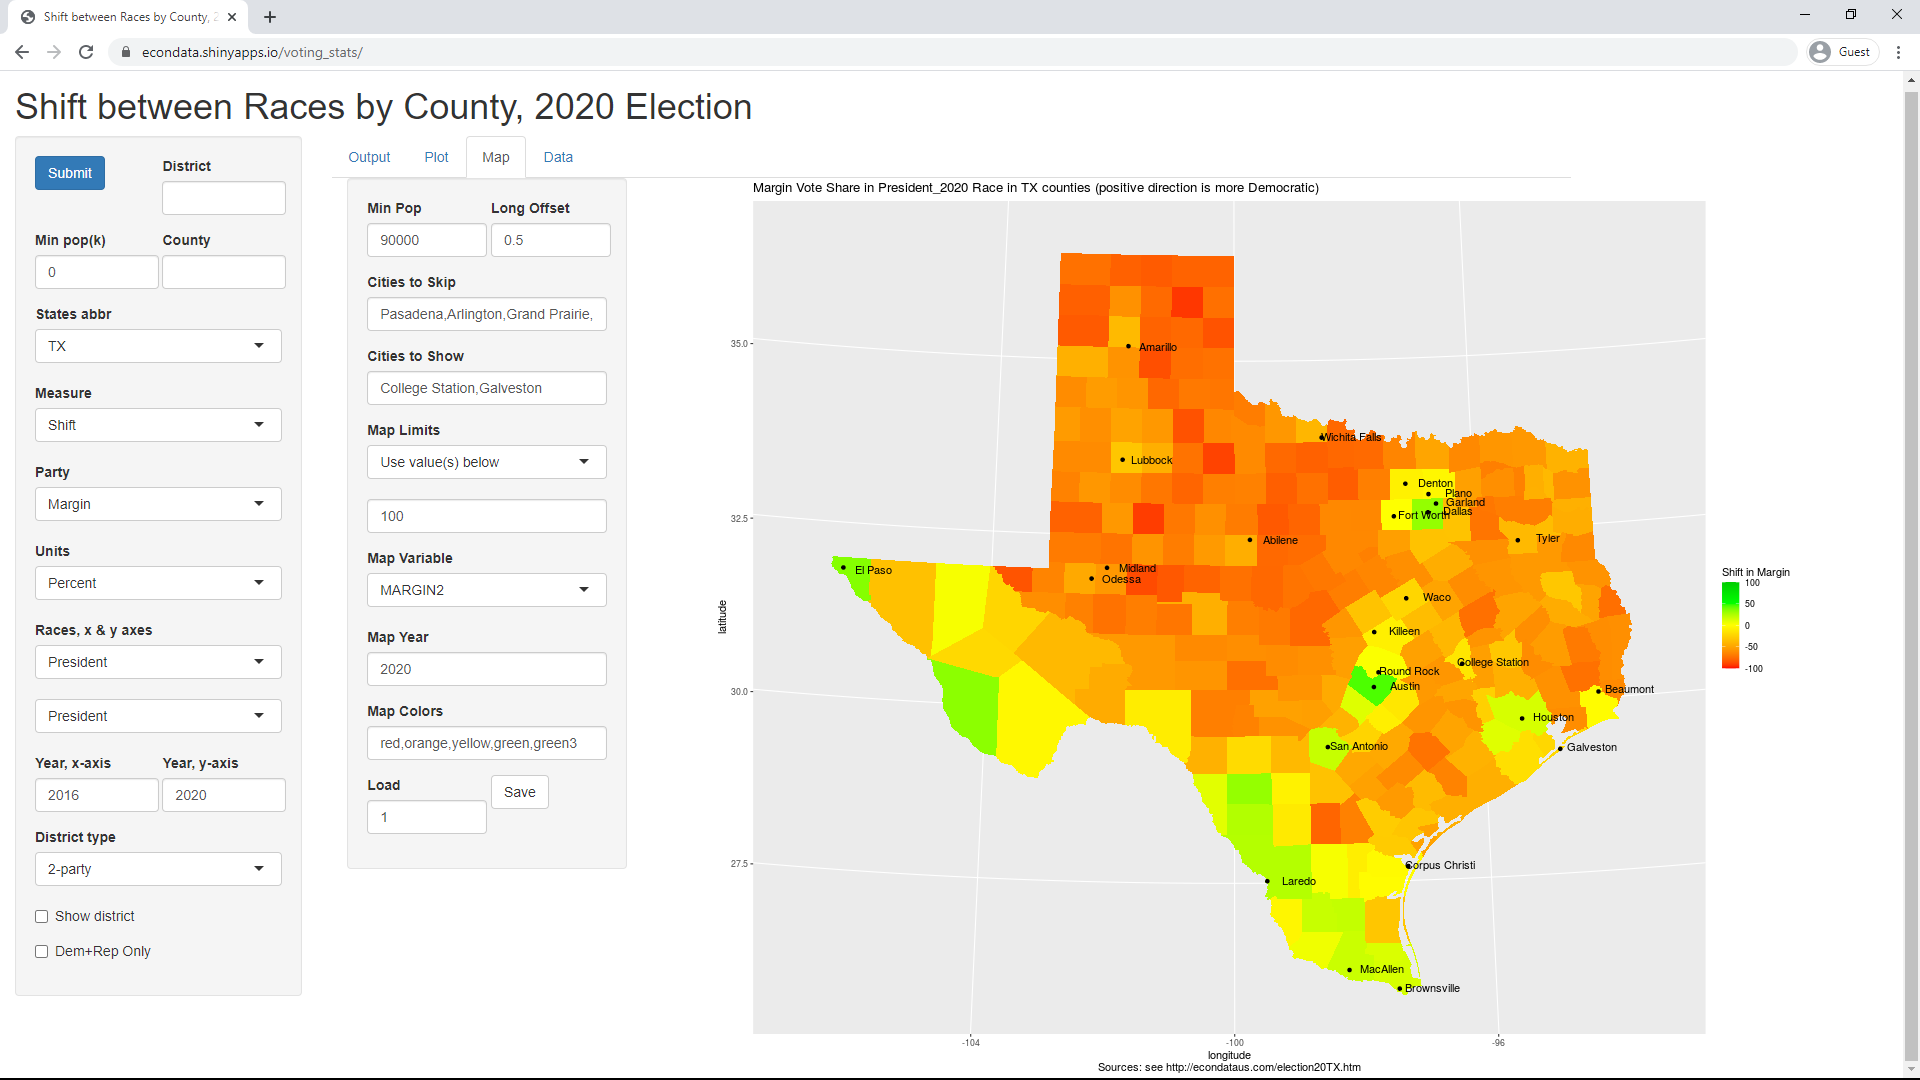
One more thing that's important to note is that the above maps show the shift in vote margins, not whether the current margin is Democratic or Republican. Changing the "Units" input back to "Percent" in the leftmost input panel and setting "Map Variable" to "MARGIN2" will display the following screen:
As can be seen, the counties containing Dallas and Austin are strongly Democratic, as least in voting for President in the 2020 election. The counties containing Houston and San Antonio are Democratic but less so as are most of the counties along the southern Texas-Mexico border.
Further on, the article states the following:
U.S. Rep. Vicente Gonzalez, D-McAllen, won reelection by just three points after winning his last reelection in 2018 by more than 20 percentage points. He said his support for law enforcement and oil and gas did not help him in this month's election.
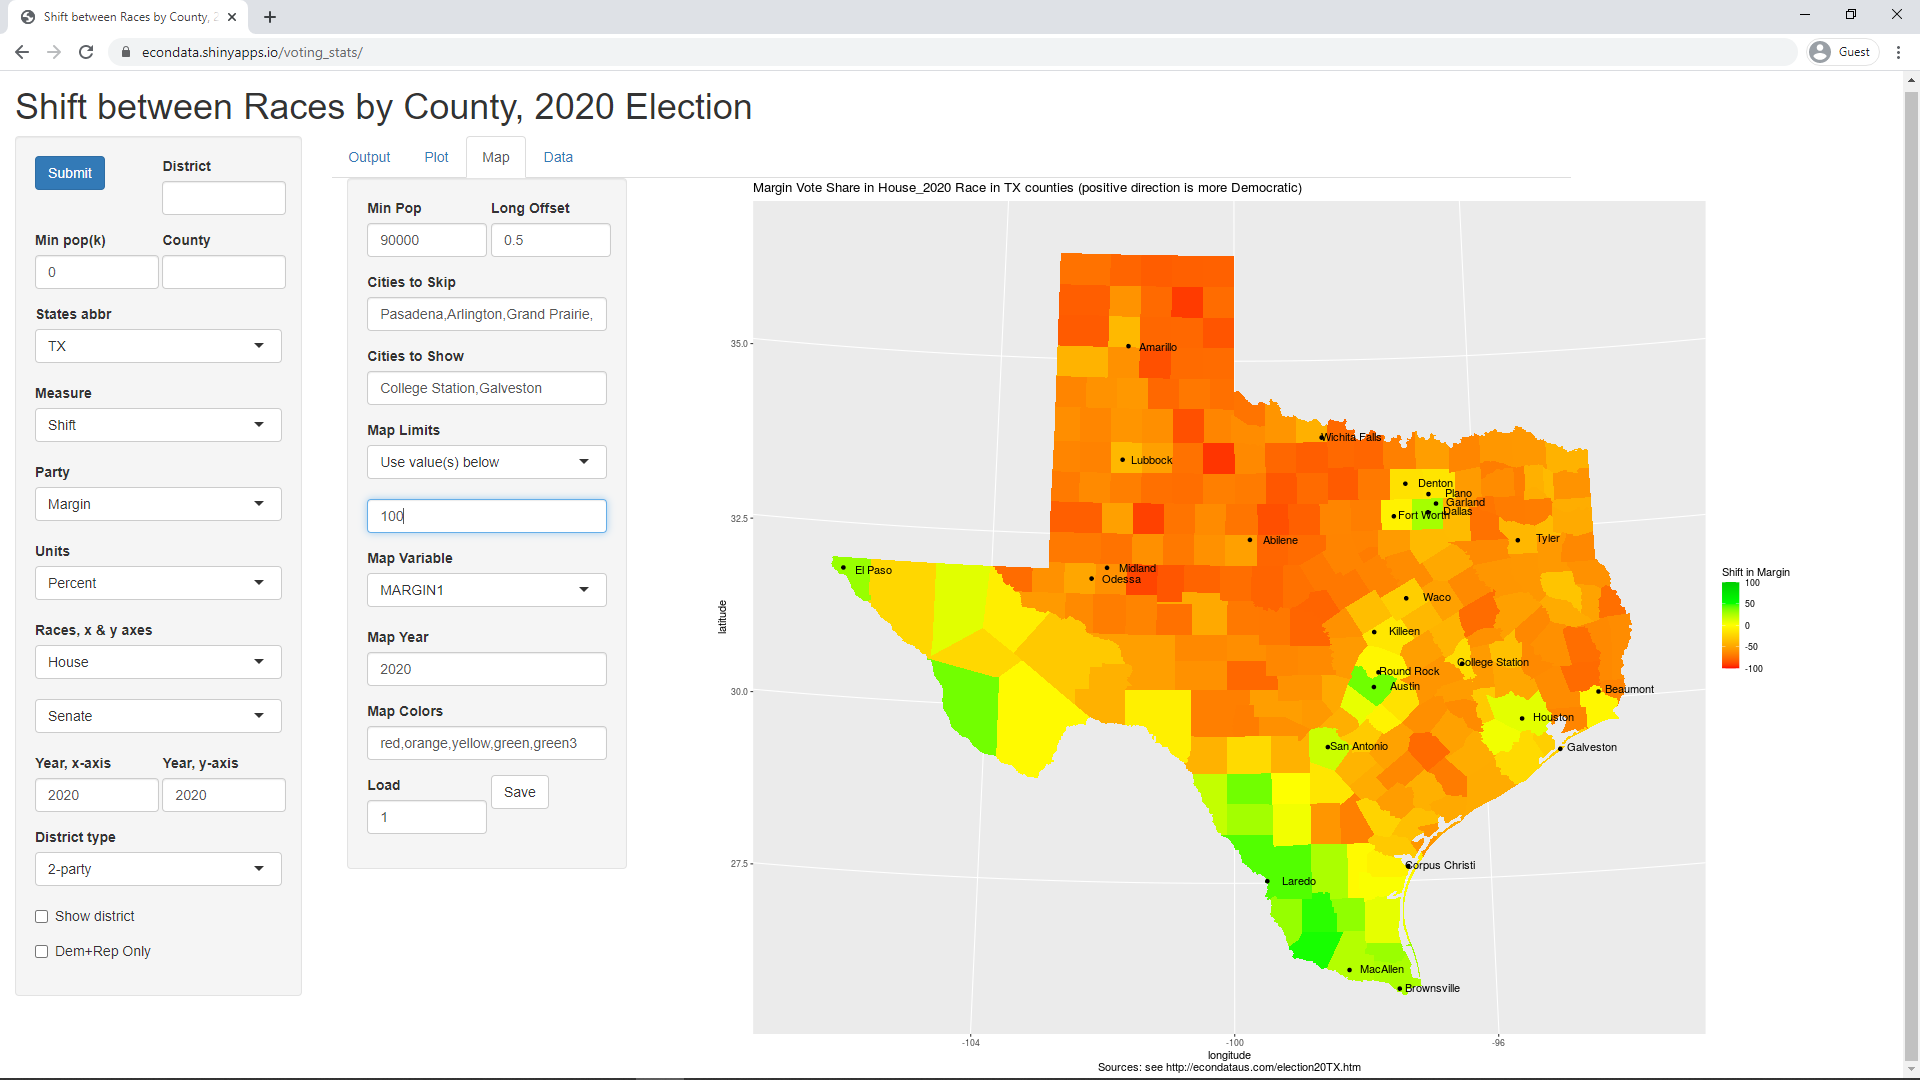
One can examine the margins in the House of Representatives by changing the "Races, x & y axes" input to "House" and "Senate" in the leftmost input panel and setting the "Map Variable" to "MARGIN1" in the other input panel. This will display the following screen:
As can be seen, the county containing McAllen (Hidalgo County) looks to be far more Democratic than the three points mentioned in the excerpt above. To figure out the discrepancy, it helps to look at the following map of Texas districts from an article titled A Brief History of Texas Gerrymandering:
In regards to this map, the article stated the following:
Soon after the original 2010 redistricting plan was redrawn in 2011, the U.S. Supreme Court struck down the preclearance law in Shelby v. Holder in 2013, giving Texas a new unchecked power in creating voting laws and passing redistricting plans. The day after the preclearance safeguard was removed, a modified redistricting plan was signed into law. An analysis by AP showed that the plan helped Texas Republicans win more U.S. House seats through redistricting than any other state.
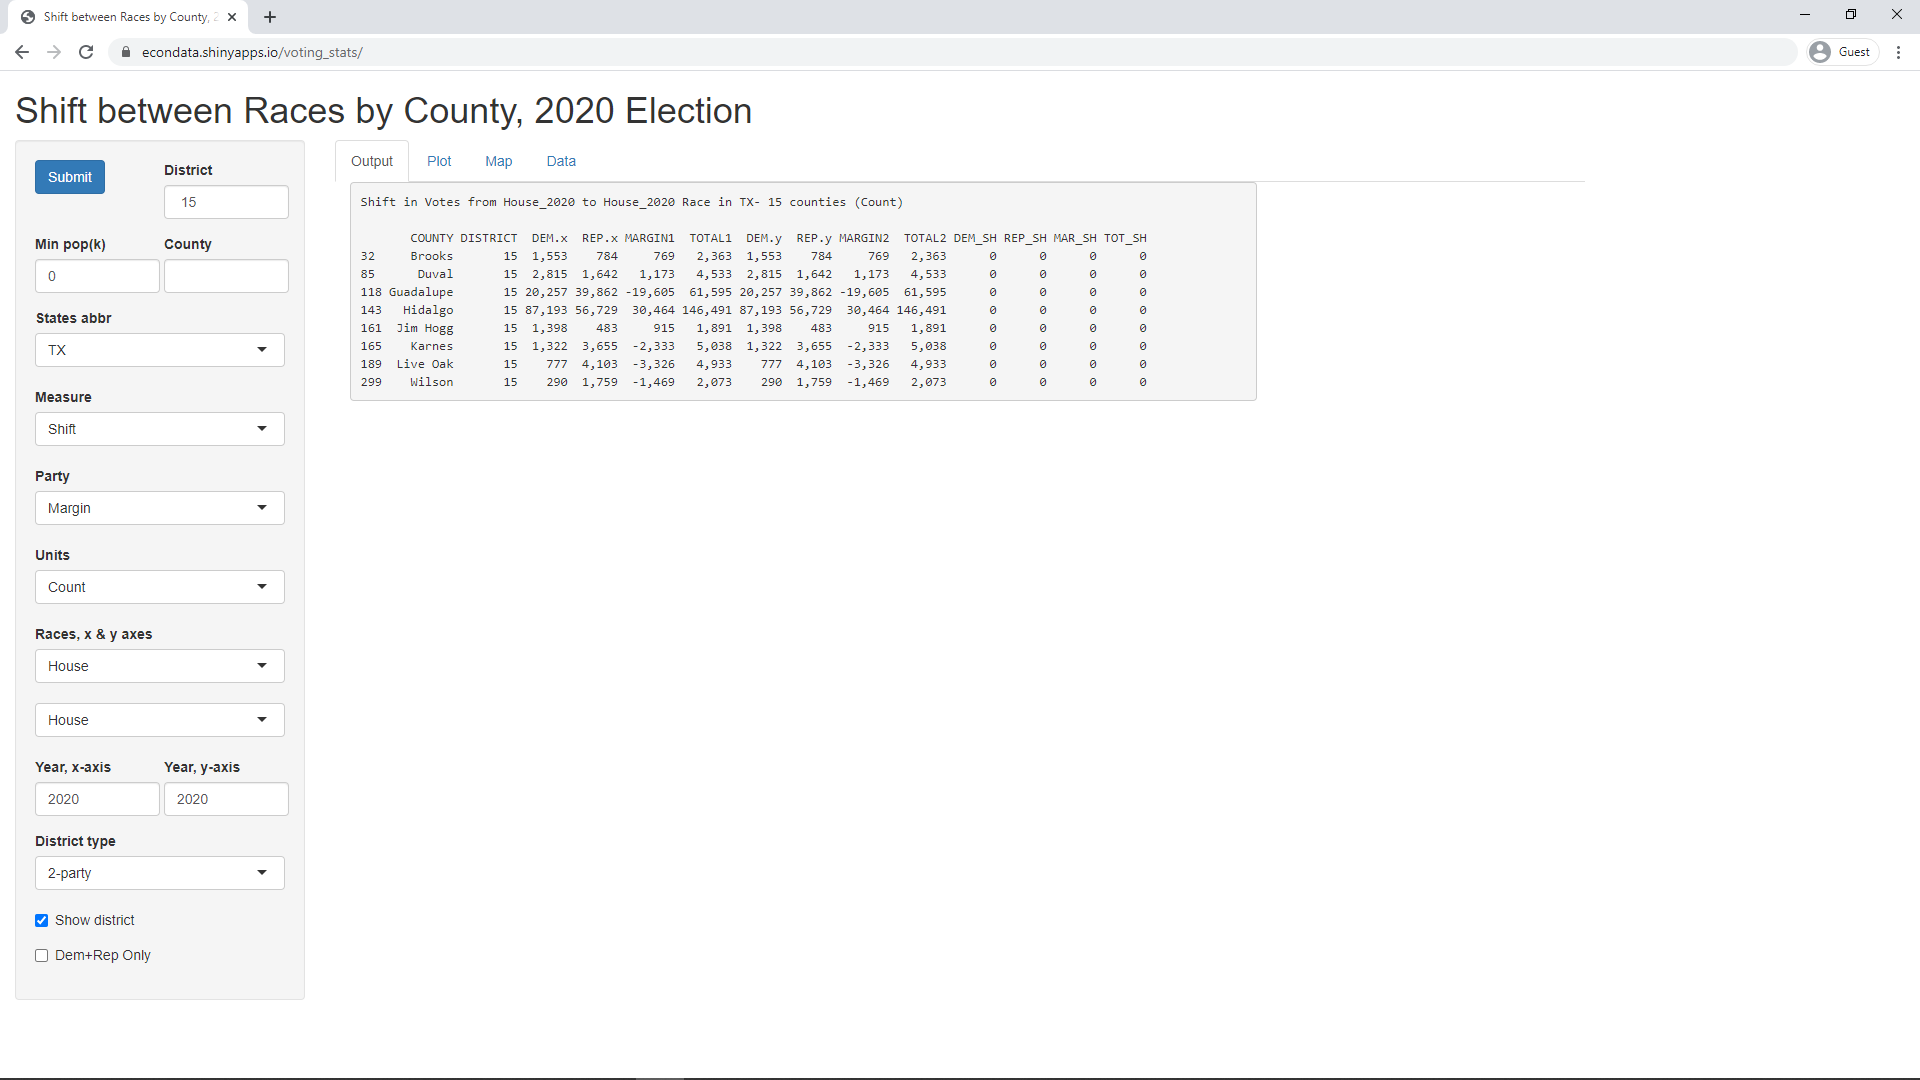
In any case, the map shows that Rep. Gonzalez's district 15 extends from Hidalgo County clear up to Guadalupe County just outside San Antonio. It's possible to get the votes per county with this app by selecting the Output tab, setting "Units" to "Count", setting both inputs following "Races, x & y axes" to "House", setting the "Year, x-axis" and "Year, y-axis" to 2020, checking the checkbox "Show district", and setting "District" (at the top) to " 15". For some reason, you need to enter a space before the " 15" for it to work at present. This will display the following screen:
As can be seen, the great majority of votes are in Hidalgo and Guadalupe counties. Gonzalez won by 30,464 votes in Hidalgo but lost by 20,257 votes in Guadalupe. Setting the "Units" back to "Percent" displays the following table:
According to many, another factor is voter suppression. An October 3, 2020 article titled "'Racist voter suppression': Texas laws keep Latinos from the ballot box, groups say" states the following:
"Texas has a long history; it’s the state that has the most pronounced, overt, racist voter suppression tactics that we know of," said Lydia Camarillo, president of the Southwest Voter Registration Education Project, formed in 1974 when Mexican Americans still were being kept from voting.
Similarly, a September 18, 2020 article titled "Texas is a 'voter suppression' state and one of the hardest places to vote. Will it help Trump win?" states the following:
Across the United States, the coronavirus pandemic has threatened the democratic process ahead of the presidential election. But the situation is even more acute in Texas, where Republicans have long devised a tortuous system that actively disadvantages minority communities who would generally lean Democratic. Long lines, voter intimidation, voting machine malfunctions and other issues afflicted almost 278,000 Texans during the midterm election in 2018, according to the Texas Civil Rights Project.
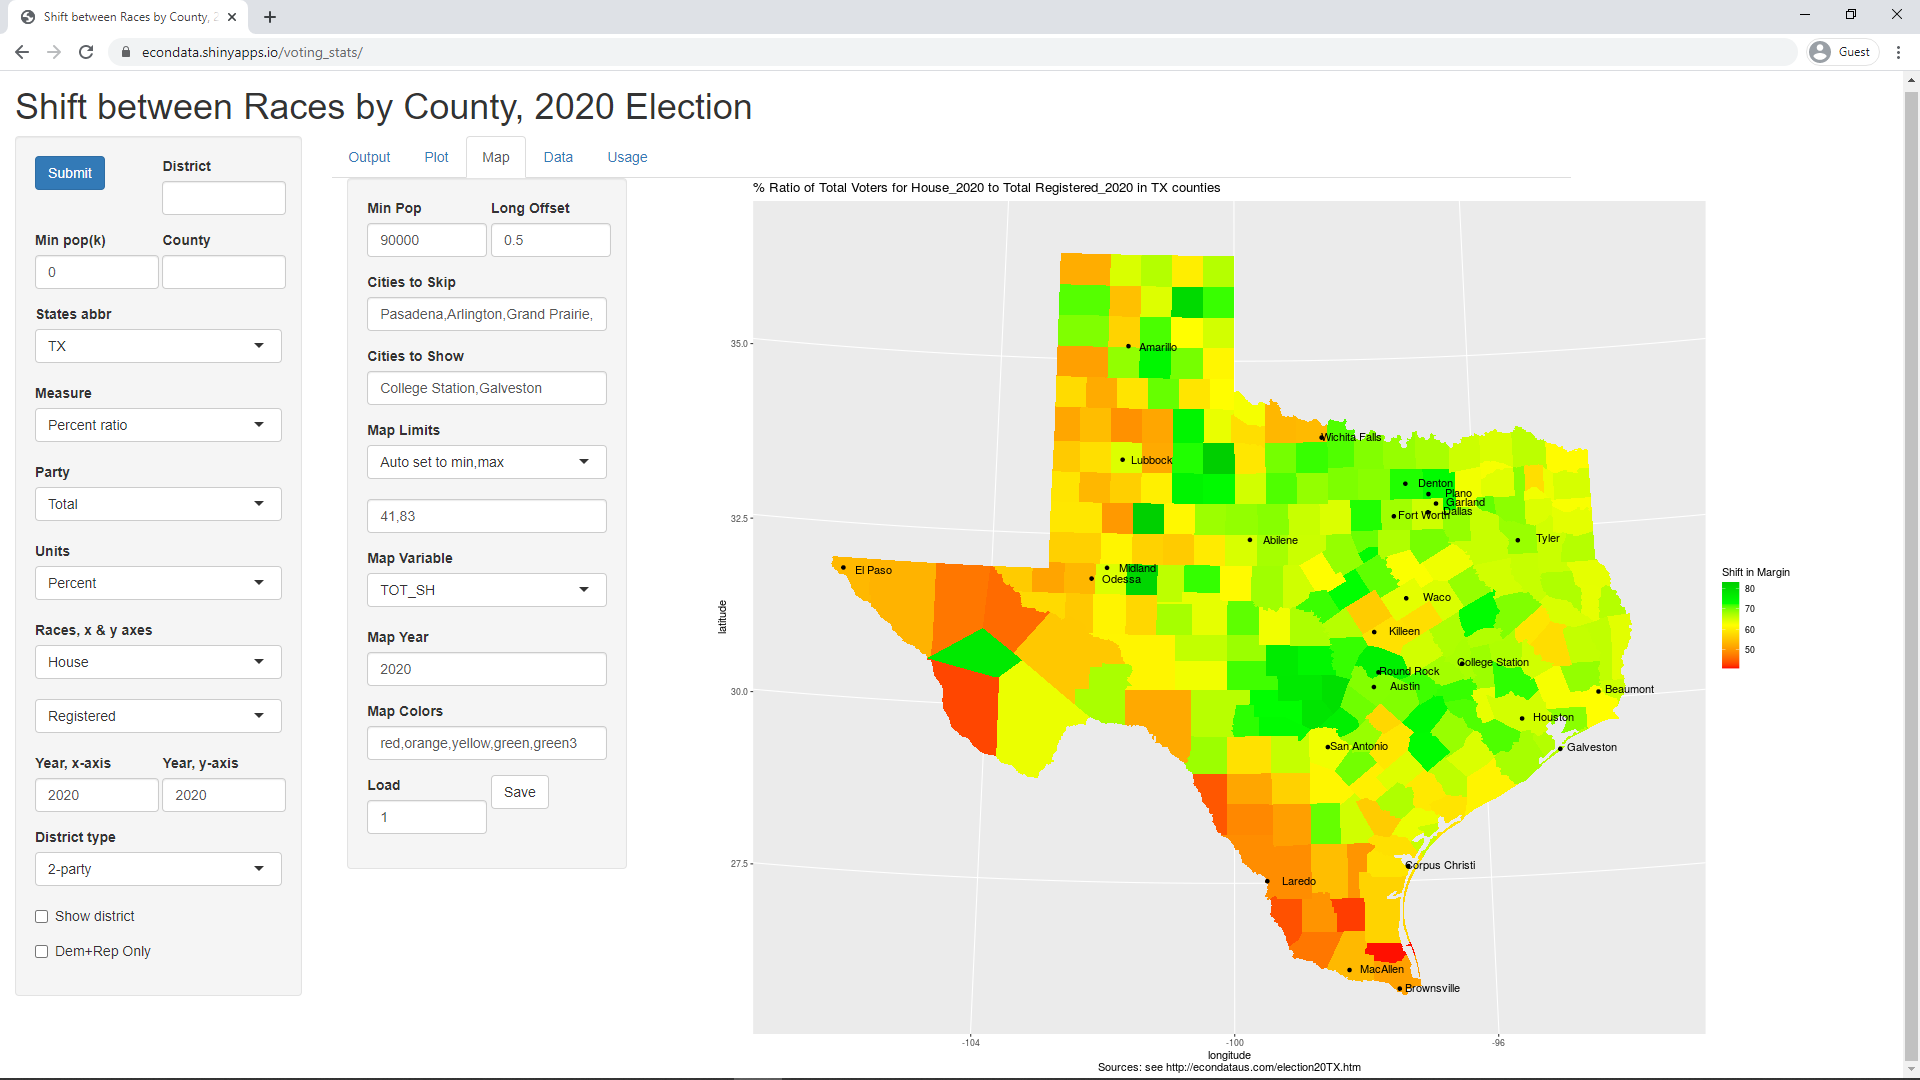
It's possible to look at the voter turnout numbers for Texas by setting "Measure" to "Percent ratio", "Party" to Total, "Units" to Percent, and "Races, x & y axes" to House and Registered in the leftmost input panel. On the Map Tab, setting "Map Limits" to "Auto set to min,max" and Map Variable to TOT_SH (for Total Shift) will display the following screen:
The "41,83" in the text box below the "Auto set to min,max" input indicates that this was the range of the voter turnout in Texas counties in the 2020 House races. As can be seen, the lower turnout was in south Texas and portions of west Texas. It's possible to look at a plot of this data on the Plot tab and the actual numbers on the Output tab.
This application is under continuing development. To see what states it currently has data for, select the Data tab. Currently, it will display the following table:
Getting a Plot of the Shift via the Plot Tab
Input                   Description
----------------------  -----------
Show row                Show the row number after the county label (used to help identify labels that cannot be read).
Position above          Labels to locate above its symbol (to help avoid overwriting of labels).
Position below          Labels to locate below its symbol (to help avoid overwriting of labels).
X From, To, Step, Tick  From, To, Step, and Tick values to use on the x-axis (Step and Tick are optional).
Y From, To, Step, Tick  From, To, Step, and Tick values to use on the y-axis (Step and Tick are optional).
Limit                   Limits to use for party symbols in plot and lower legend.
Color                   Colors to use for party symbols in plot and lower legend.
Party                   Labels to use for party symbols in lower legend.
No-party                Specifies how no-party registrations are assumed to vote when calculating registration statistics by party.
Vote Limit (1000s)      Limits to use for vote symbols in plot and upper legend (in 1000s).
Vote Shape              Shapes to use for vote symbols in plot and upper legend (see this link.
Vote Desc               Labels to use for vote symbols in plot and upper legend.
Load                    Load the inputs above with the inputs saved under given number.
Save                    Save current inputs under next available number (will not overwrite).
It should be noted that the above plot was loaded with the default inputs saved under the number 1. In any case, this plot shows that the majority of counties in Texas are Solid Republican and did not shift much between 2016 and 2020 on average. Many of the blue counties shifted strongly red (Republican). However, the heavily populated counties of Dallas, Travis (Austin), and Bexar (San Antonio) shifted blue by 4.71 to 6.48 percent and Harris County (Houston) shifted blue by about 0.92 percent.
Getting a Map of the Shift via the Map Tab
Input           Description
--------------  -----------
Min Pop         Minimum population of cities to label (setting this to 1 and clearing "Cities to Skip" will show all available cities)
Long Offset     Longitude offset to start of label. Increasing this will move all labels to the right.
Cities to Skip  Specifies the names of cities to skip even though they have above the minimum population specified by "Min Pop".
Cities to Show  Specifies the names of cities to show even though they have below the minimum population specified by "Min Pop".
Map Limits      Species "Use value(s) below", "Auto set to min,max", "Auto set balanced" for the limits used in the heatmap. "Auto set balanced" is best if you want values close to zero to be the middle Map Color.
(limits)        Limit(s) used by "Use value(s) below" selection. If only one value, limits are set to "-abs(value),abs(value)". This input is set by the two auto selections so that they can be manually modified.
Map Variable    Map variable for display corresponding to variables on Output tab. Also included are DEM1_N, REP1_N, MAR1_N, and TOT1_N which correspond to the actual counts of the first four variable.
Map Year        This was previously used for labeling but is not currently used.
Map Colors      Colors used for the heatmap.
Load            Load the inputs above with the inputs saved under given number.
Save            Save current inputs under next available number (will not overwrite).
The package used to create these maps has a minor issue with the longitude offsets in that the current city labels are place further to the right when the city names are shorter. This is why the label "College Station" writes over the dot marking the city but label "Tyler" is a fair distance to the right of the dot marking Tyler. Hence, the value selected for "Long Offset" is currently a bit of a compromise.
Getting a Map of the Margin of a Single Race via the Map Tab
Getting Data about House Races, including District Information
Shift in Vote Share from House_2020 to House_2020 Race in TX- 15 counties (Percent)

       COUNTY DISTRICT DEM.x REP.x MARGIN1 TOTAL1 DEM.y REP.y MARGIN2 TOTAL2 DEM_SH REP_SH MAR_SH TOT_SH
32     Brooks       15 65.72 33.18   32.54  98.90 65.72 33.18   32.54  98.90      0      0      0      0
85      Duval       15 62.10 36.22   25.88  98.32 62.10 36.22   25.88  98.32      0      0      0      0
118 Guadalupe       15 32.89 64.72  -31.83  97.60 32.89 64.72  -31.83  97.60      0      0      0      0
143   Hidalgo       15 59.52 38.73   20.80  98.25 59.52 38.73   20.80  98.25      0      0      0      0
161  Jim Hogg       15 73.93 25.54   48.39  99.47 73.93 25.54   48.39  99.47      0      0      0      0
165    Karnes       15 26.24 72.55  -46.31  98.79 26.24 72.55  -46.31  98.79      0      0      0      0
189  Live Oak       15 15.75 83.17  -67.42  98.93 15.75 83.17  -67.42  98.93      0      0      0      0
299    Wilson       15 13.99 84.85  -70.86  98.84 13.99 84.85  -70.86  98.84      0      0      0      0
Hence, Gonzalez won by a 20.8% margin in Hidalgo County but lost by a 31.83% margin in Guadalupe County. According to the numbers from the Texas Secretary of State, Gonzalez won by a 45.12% margin in Hidalgo County but lost by a 29.46% margin in Guadalupe County in 2018. Hence, Gonzales' winning margin did go down somewhat in Hidalgo County but still remained well positive at 20.8 percent. According to dataus.io, "92.4% of the people in Hidalgo County, TX are hispanic (800k people)" but according to the same source, "37.7% of the people in Guadalupe County, TX are hispanic (58.5k people)". Both numbers were for 2018. Hence, it seems a mistake to place too much blame for Gonzales' narrow win on changes in the Hispanic voter. The fact that District 15 includes a large number of non-Hispanic voters far from the Texas-Mexico border also plays a role.
Getting a Map of the Voter Turnout of a Race via the Map Tab
Getting the States and Races Available via the Data Tab
  Year       Race AZ  CA FL  GA IA  KY ME MI MT  NC PA SC  TX
1 2020  President 15  58 67 160 99 120 17 83 56 100 67 46 254
2 2020     Senate 15   0  0 160 99 120 17 83 56 100  0 46 254
3 2020      House 29 125 96   0 99   0  0  0 56 112  0 59 309
4 2020 Registered 15  58  0   0 99 120  0  0  0   0 67  0 254
5 2018     Senate  0   0  0   0  0   0  0  0 56   0  0  0 254
6 2018      House  0 178 94   0  0   0  0  0  0   0  0  0   0
7 2016  President  0   0  0   0  0   0  0  0  0   0  0  0 254
8    0  Map_Parms  9   9  0   0  0   0  0  0  0   0  0  0  18
9    0 Plot_Parms  0  12  0   0  0   0  0  0  0   0  0  0  24
As can be seen, the app currently has data for Arizona, California, Florida, Georgia, Iowa, Kentucky, Maine, Michigan, Montana, North Carolina, Pennsylvania, South Carolina, and Texas. All of them contain the 2020 data for the Presidential and Senate races except for California, Florida, and Pennsylvania which had no Senate races. Most of them have data for House races and some have data for prior years. Also, several have data for number of registered voters. The numbers for all of these items are the number of rows in the file minus 2 lines for the header. The last two items are input parameters that have been stored off for the Plot and Map tabs. The numbers for them is the number of rows minus 1 line for the header. Texas has twice as large a number as California because the latter has one saved version and the latter has two.
If anyone should run into any issues or have any suggestions for additional features, feel free to let me know via the Contact box at the bottom of this page.
2020 U.S. Election
2016 U.S. Election Links
Polling Election Data
Comparing Polling and Election Results via R Shiny
Red Shifts for 2020 Election Cycle, November 18, 2020
Precinct Election Data
Analysis of Reported Voting Areas via R Shiny
Precinct Results in Iowa through 2020
Precinct Results in Maine through 2020
Precinct Results in North Carolina through 2020
Precinct Results in Texas through 2020
County Election Data
Exploring Federal Election Results by County via R Shiny
County Results in Arizona in 2020
County Results in California in 2020
County Results in Florida in 2020
County Results in Iowa in 2020
County Results in Kentucky in 2020
County Results in Maine in 2020
County Results in Montana in 2020
County Results in Pennsylvania in 2020
County Results in South Carolina in 2020
County Results in Texas in 2020