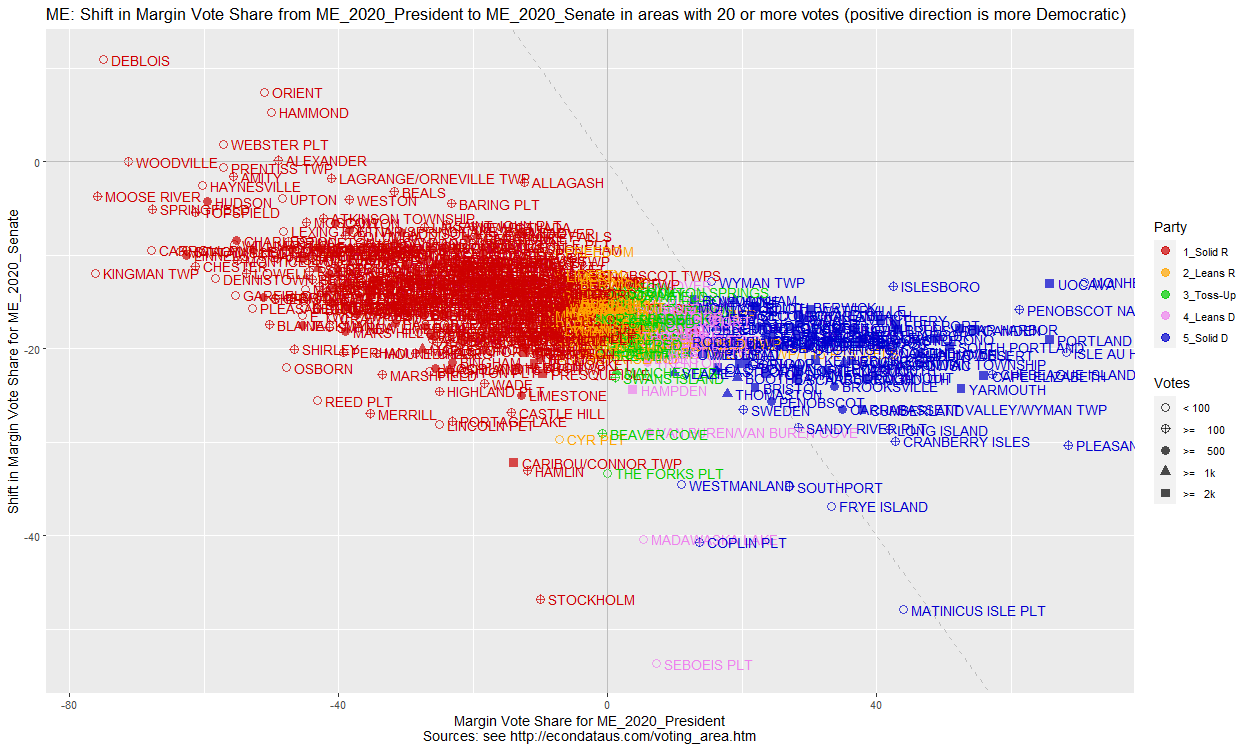
Comparing the 2020 Presidential and the 2020 Senate Races in Maine (percent)
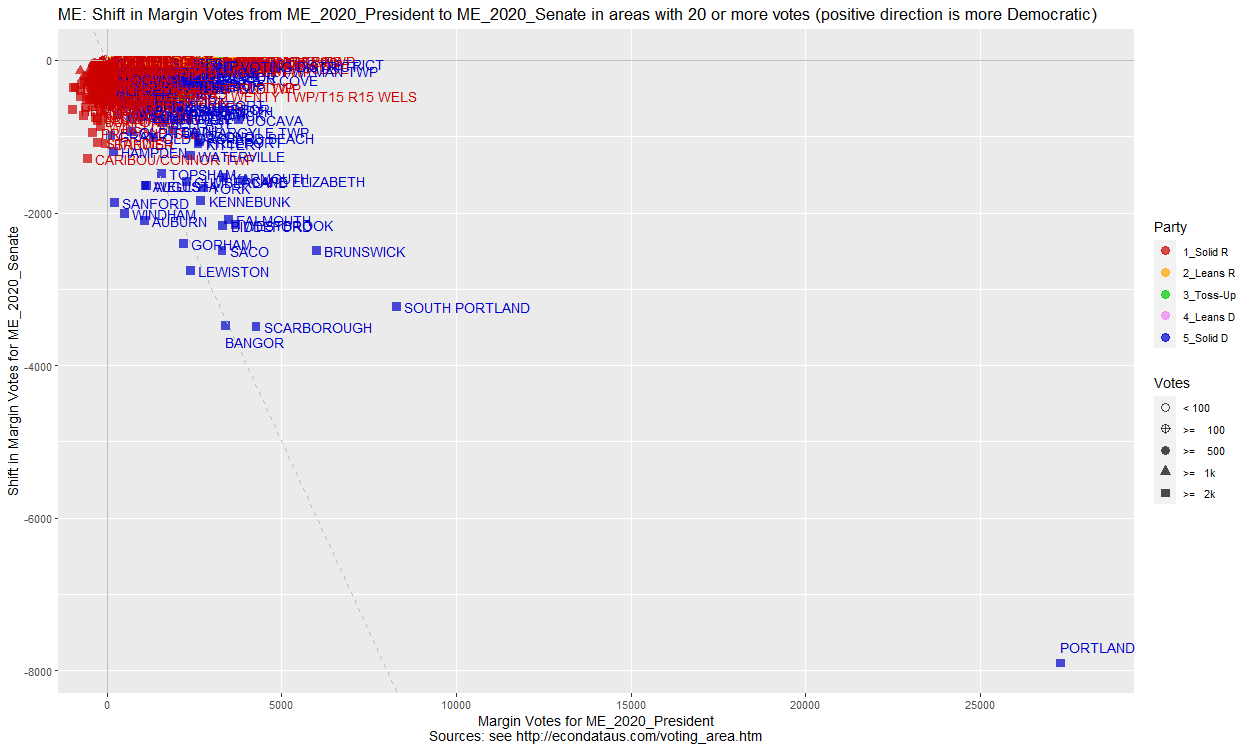
Comparing the 2020 Presidential and the 2020 Senate Races in Maine (count)
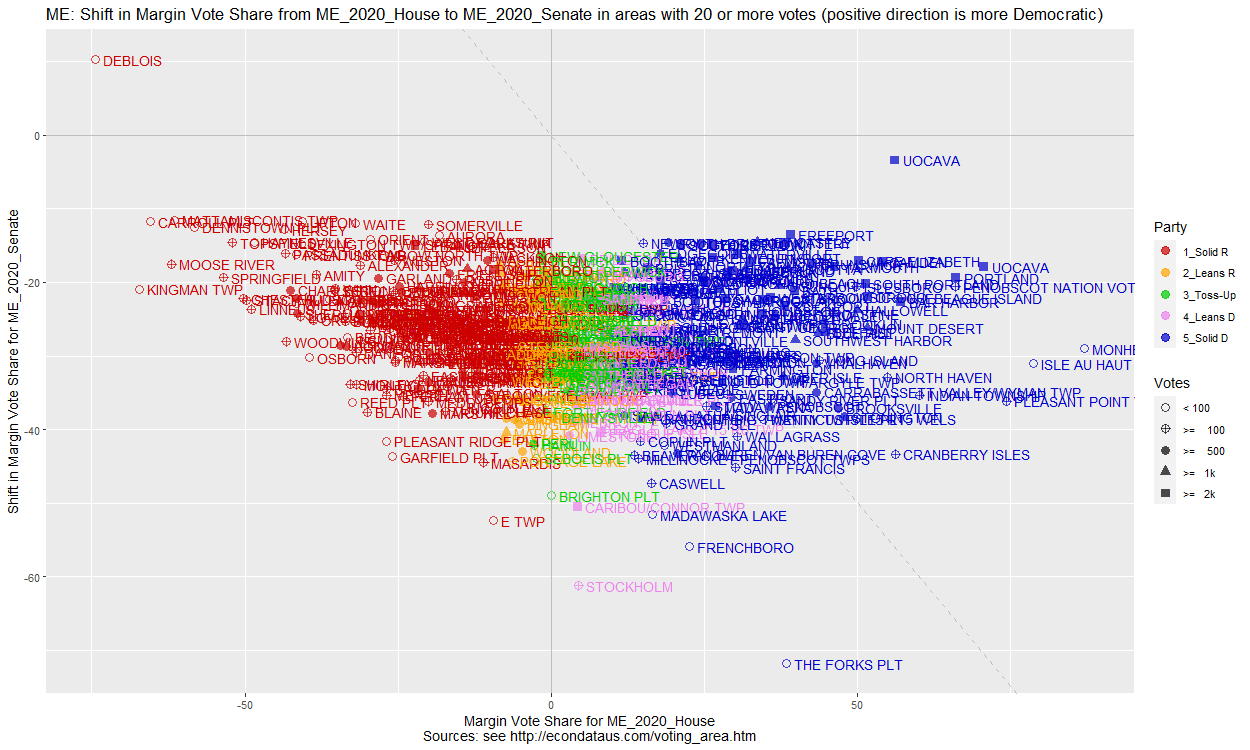
Comparing the 2020 House and the 2020 Senate Races in Maine (percent)
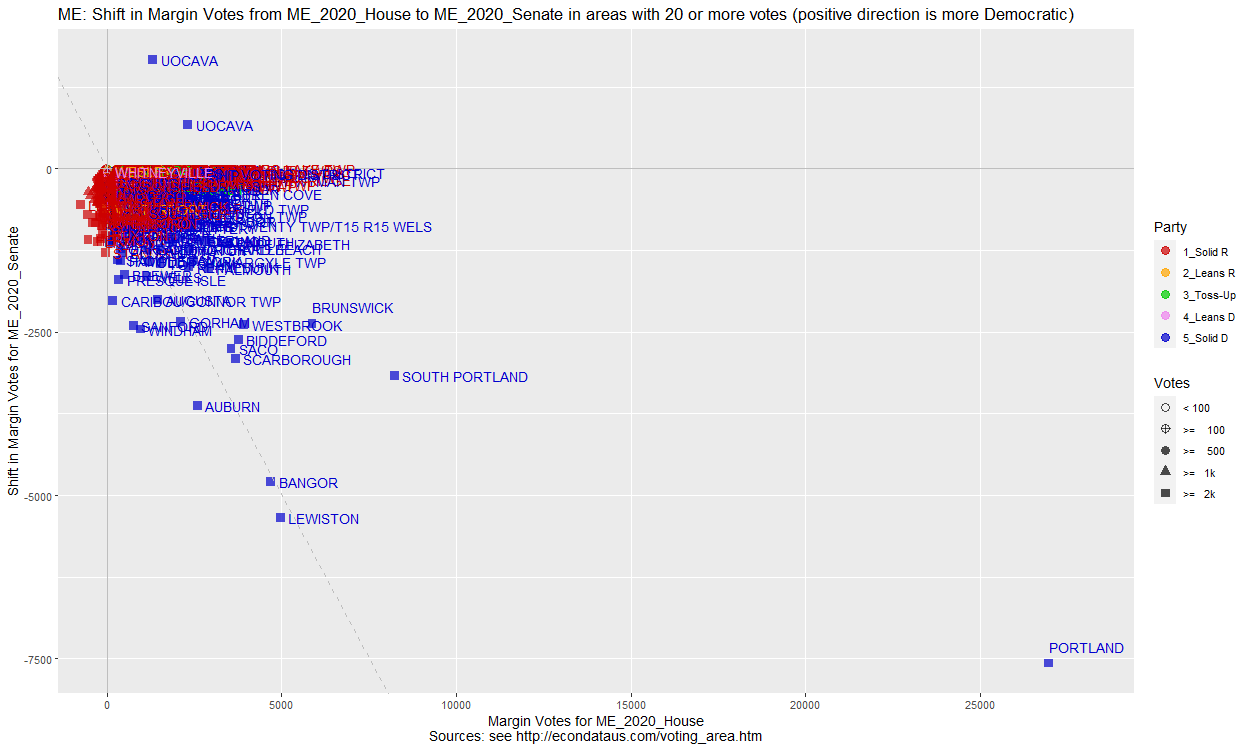
Comparing the 2020 House and the 2020 Senate Races in Maine (count)
Total Vote Count and Vote Margin Percent by Voting Area in Maine
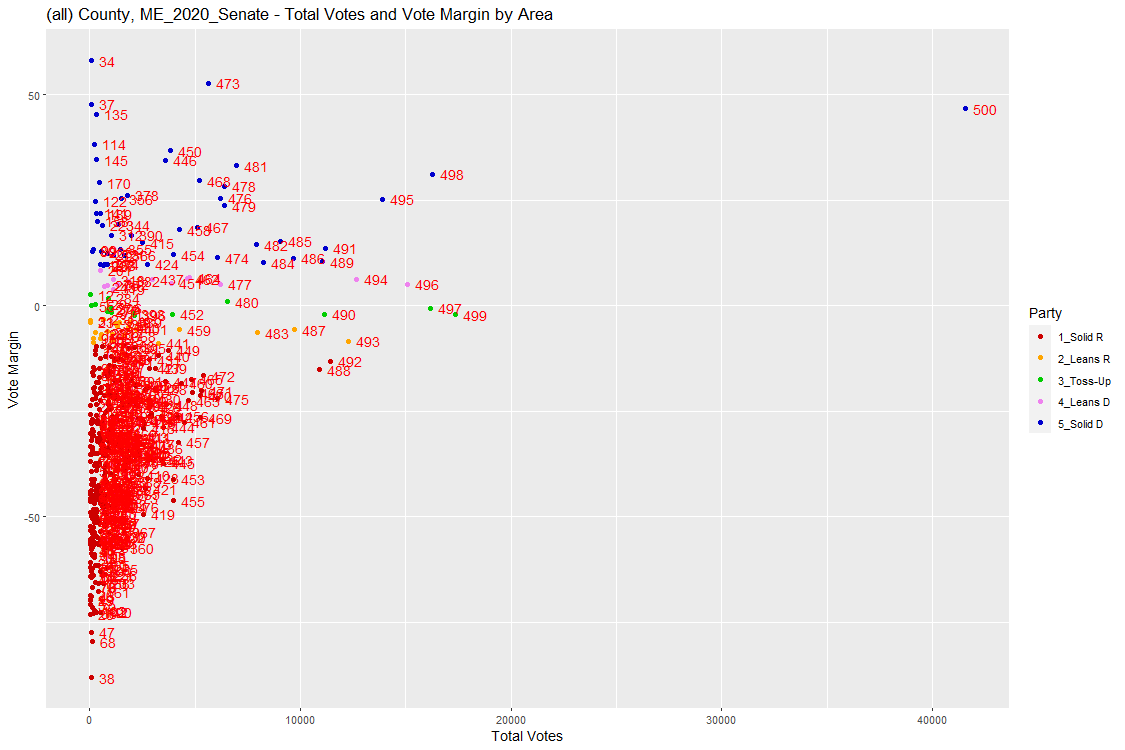
    COUNTY                                  AREA   TOTAL  Gideon Collins   Linn Savage Others DEM_CVT REP_CVT
450    FRA                            Farmington   3,907   1,752   1,830     73    252      0   34.85   58.83
451    PEN                                Hermon   3,958   1,080   2,707     62     99     10   34.78   58.92
452    KNO                              Rockland   3,962   2,030   1,550     80    300      2   34.93   58.73
453    ARO                    Caribou/Connor Twp   3,999     978   2,824     74    123      0   34.83   58.84
454    SOM                             Skowhegan   4,172   1,338   2,427     72    335      0   34.81   58.84
455    ARO                          Presque Isle   4,224   1,319   2,682     78    145      0   34.77   58.88
456    WAL                               Belfast   4,252   2,309   1,541     47    352      3   34.96   58.66
457    PEN                   Old Town/Argyle Twp   4,262   1,849   2,090     71    249      3   35.04   58.57
458    YOR                               Berwick   4,353   1,649   2,448    102    154      0   35.07   58.55
459    YOR                             Waterboro   4,483   1,469   2,707    110    197      0   35.05   58.57
460    YOR                         South Berwick   4,628   2,330   2,036     98    163      1   35.20   58.42
461    KEN                               Winslow   4,681   1,668   2,719     89    205      0   35.21   58.42
462    YOR                                 Eliot   4,717   2,393   2,082     85    157      0   35.36   58.27
463    HAN                             Ellsworth   4,837   1,809   2,650    136    240      2   35.38   58.24
464    PEN                               Hampden   4,886   1,812   2,820     65    182      7   35.40   58.23
465    SAG                                  Bath   5,135   2,805   1,851     79    400      0   35.61   58.00
466    PEN                                 Orono   5,208   3,147   1,603     99    356      3   35.87   57.71
467    AND                                Lisbon   5,251   1,743   3,133    122    253      0   35.84   57.73
468    PEN                                Brewer   5,273   1,933   3,059     85    187      9   35.85   57.73
469    YOR                                Buxton   5,291   1,935   3,000    100    251      5   35.86   57.72
470    CUM                                  Gray   5,388   2,075   2,967     89    257      0   35.89   57.69
471  STATE                                UOCAVA   5,648   4,068   1,089    113    363     15   36.28   57.27
472    CUM                            Cumberland   6,045   3,222   2,538     35    247      3   36.48   57.09
473    CUM                              Standish   6,075   2,207   3,541     93    233      1   36.48   57.11
474    CUM                              Freeport   6,192   3,718   2,141     47    285      1   36.75   56.84
475    YOR                     Old Orchard Beach   6,212   3,083   2,764    109    255      1   36.90   56.70
476    CUM                              Yarmouth   6,384   3,943   2,136     36    265      4   37.19   56.43
477    YOR                               Kittery   6,391   3,781   2,264    111    235      0   37.45   56.19
478    SAG                               Topsham   6,553   3,095   3,029     85    344      0   37.56   56.07
479    CUM                        Cape Elizabeth   6,970   4,462   2,155     38    315      0   37.89   55.76
480    KEN                            Waterville   7,897   4,210   3,071    153    460      3   38.10   55.53
481    YOR                                 Wells   7,968   3,564   4,073     88    243      0   38.19   55.47
482    YOR                             Kennebunk   8,255   4,339   3,493     92    330      1   38.39   55.28
483    CUM                              Falmouth   9,057   5,040   3,657     49    308      3   38.65   55.06
484    YOR                                  York   9,680   5,191   4,104    127    255      3   38.89   54.86
485    KEN                               Augusta   9,732   4,251   4,803    207    468      3   38.97   54.77
486    YOR                               Sanford  10,889   4,228   5,882    258    520      1   38.96   54.76
487    YOR                             Biddeford  11,055   5,655   4,508    186    703      3   39.17   54.51
488    CUM                                Gorham  11,146   5,138   5,361    159    486      2   39.29   54.40
489    CUM                             Westbrook  11,170   5,903   4,381    170    714      2   39.52   54.15
490    CUM                               Windham  11,446   4,617   6,122    184    522      1   39.54   54.14
491    AND                                Auburn  12,285   5,213   6,242    250    578      2   39.59   54.08
492    YOR                                  Saco  12,649   6,333   5,536    205    575      0   39.78   53.89
493    CUM                             Brunswick  13,905   8,188   4,685    178    850      4   40.15   53.50
494    CUM                           Scarborough  15,071   7,574   6,801    158    538      0   40.36   53.32
495    PEN                                Bangor  16,192   7,466   7,559    304    842     21   40.48   53.18
496    CUM                        South Portland  16,266  10,001   4,943    160  1,162      0   40.93   52.69
497    AND                              Lewiston  17,380   8,006   8,381    301    692      0   41.05   52.59
498    CUM                              Portland  41,569  28,053   8,659    335  4,510     12   42.39   50.98
499                                        TOTAL 819,183 347,223 417,645 13,508 40,579    228   42.39   50.98
Precinct Data Locations
If anyone should run into any issues or have any suggestions for additional features, feel free to let me know via the Contact box at the bottom of this page.
2020 U.S. Election
Polling Election Data
Comparing Polling and Election Results via R Shiny
Red Shifts for 2020 Election Cycle, November 18, 2020
Precinct Election Data
Analysis of Reported Voting Areas via R Shiny
Analysis of Reported Voting Areas in Florida via R Shiny
Analysis of the Distribution of Precinct Margins by County via R Shiny
Precinct Results in Florida through 2020
Precinct Results in Iowa through 2020
Precinct Results in Maine through 2020
Precinct Results in North Carolina through 2020
Precinct Results in South Carolina through 2020
Precinct Results in Texas through 2020
County Election Data
Exploring Federal Election Results by County via R Shiny
County Results in Arizona in 2020
County Results in California in 2020
County Results in Florida in 2020
County Results in Iowa in 2020
County Results in Kentucky in 2020
County Results in Maine in 2020
County Results in Montana in 2020
County Results in Pennsylvania in 2020
County Results in South Carolina in 2020
County Results in Texas in 2020