Description of the Cumulative Vote Tally (CVT)
There have been a number of analyses that have looked at the 2016 Presidential Race using something called Cumulative Vote Tally (CVT). I've linked to a number of them at this link. One titled An Electoral System in Crisis describes CVT as follows:
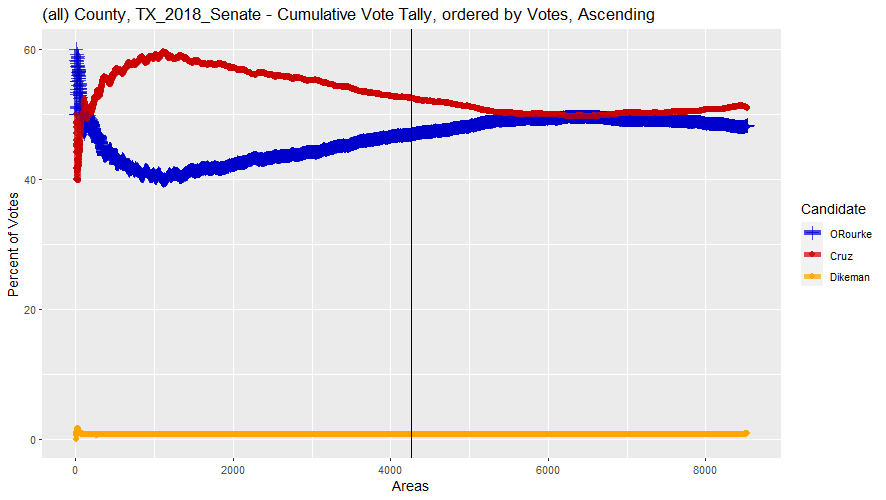
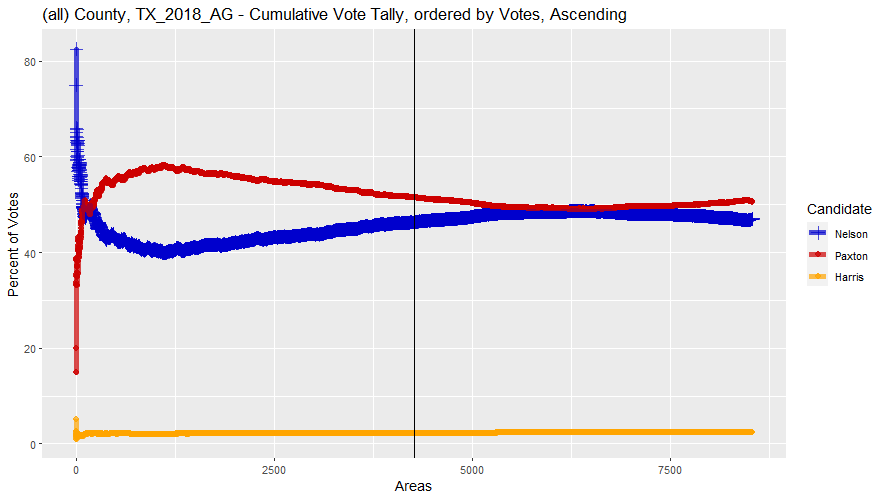
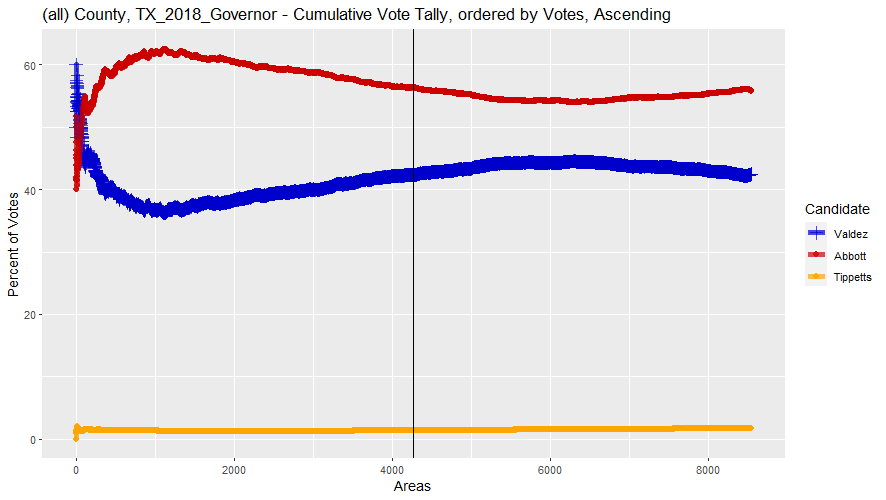
This method is called a CVS (Cumulative Vote Study) or CVT (Cumulative Vote Tally) graph. Precincts are organized from those with the least number of votes to those with the most vote. The statistical patterns that emerge are then examined to see if the candidates' percentages tend to stabilize as more and more of the votes are counted. That is the expected statistical pattern, because as a sample size grows, its average should get closer and closer to the average of the whole population.
The paper goes on to say the following about when this expected behavior does not occur:
When one candidate's percentages go up as the precincts get larger, there may be an explanation - such as an increase in registered Democrats or Republicans - or an increase in a particular demographic that supports that candidate. We try to look at contextual data, when it is available to see if there are reasons for the statistical pattern. If not, a pattern where one candidate gets more and more votes as the precincts get larger may be a red flag that the results have been manipulated.
Hence, the analyses is careful to say that CVT can provide a red flag but that the researcher should also look at contextual data. Another analysis was put out by a group named "Vote Sleuth" on their website at http://www.votesleuth.org/ adds the following regarding CVT:
The political leaning of a given voting precinct should not be strongly related to its size, except for the observation that very small precincts tend to be located in rural areas, which historically have voted more conservatively.
In general, as the vote count is tallied for a given county starting with the smallest precincts and moving to the larger ones, we would expect the percent of votes for a given candidate to quickly stabilize at or near the final outcome, unless for some reason there is a strong bias toward one candidate in larger precincts. A more thorough explanation of the reason for this is here.
The analysis then goes on to describe a simple metric named "deltaM":
We adopted a very simple metric - deltaM* - to describe how "flat" one of these sets of lines is. This estimates numerically the extent to which there is a change in vote margin as we move from adding only smaller precincts to adding larger precincts to the totals. We arrive at this margin by first identifying the median precinct size - where half the precincts are smaller and half the precincts are larger. We then add up the votes for the two candidates in all of the precincts below and including the median to see how different the vote outcome would be if we stopped counting votes after we added only the results from the smaller precincts. If the outcome for all precincts compared to that for only the smaller half of the precincts favors the Republican candidate, deltaM is positive. If the final outcome compared to the "smaller precincts only" outcome favors the Democratic candidate, deltaM is negative.
DeltaM represents the distance between the vote lines at the far right of the graph compared to the distance between the lines at the middle of the graph.
As an example of a county with a large deltaM, the analysis shows the following CVT graph of Milwaukee County, Wisconsin in the 2016 Presidential race:

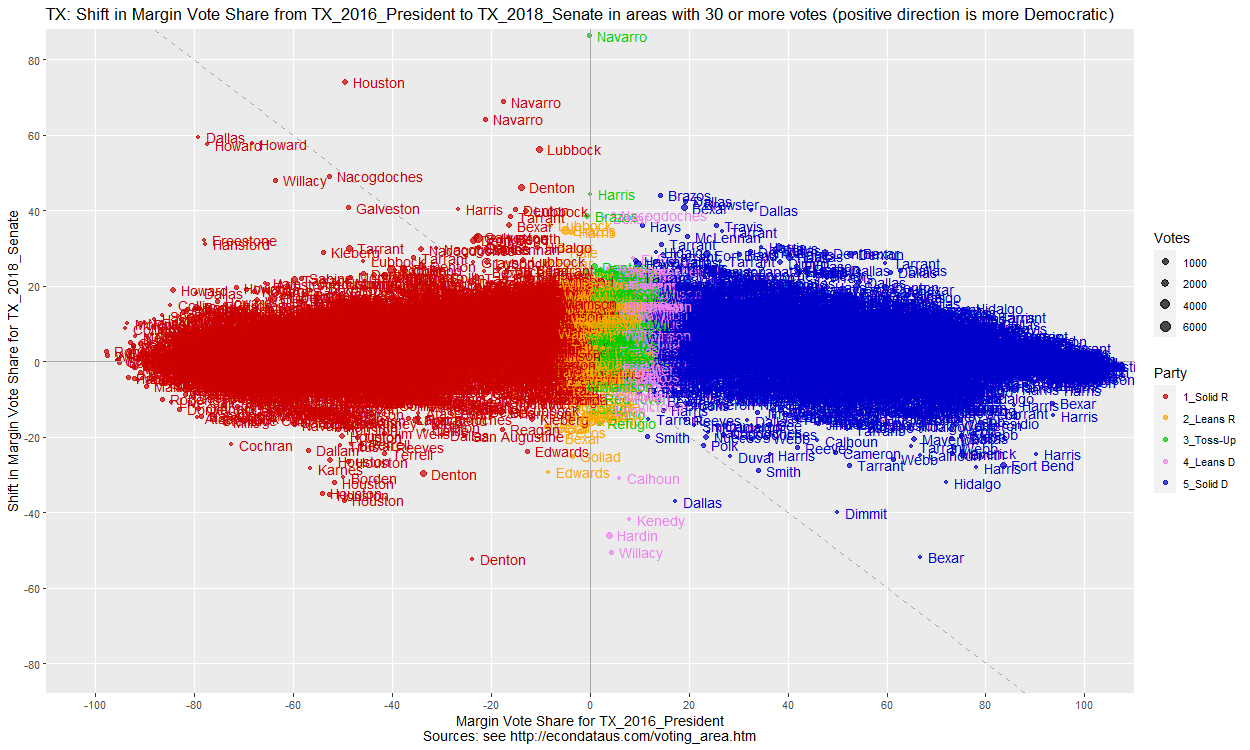
Looking at 2018 Races in Texas
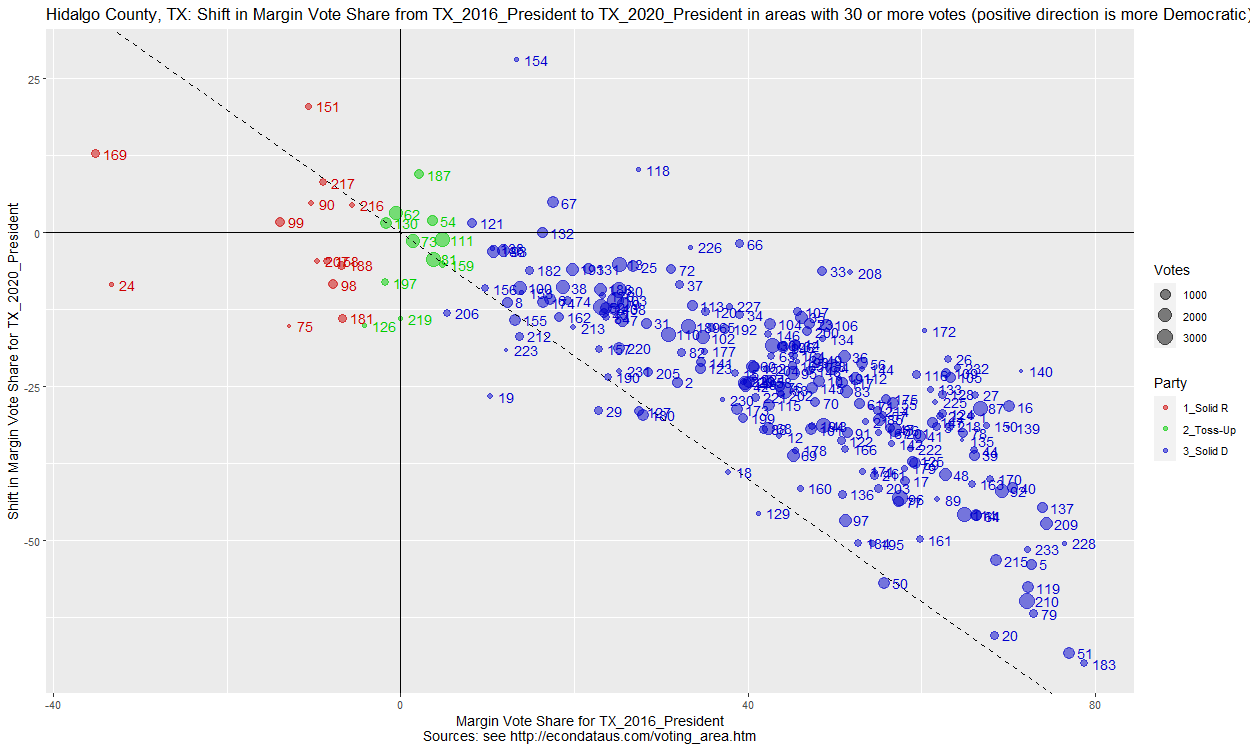
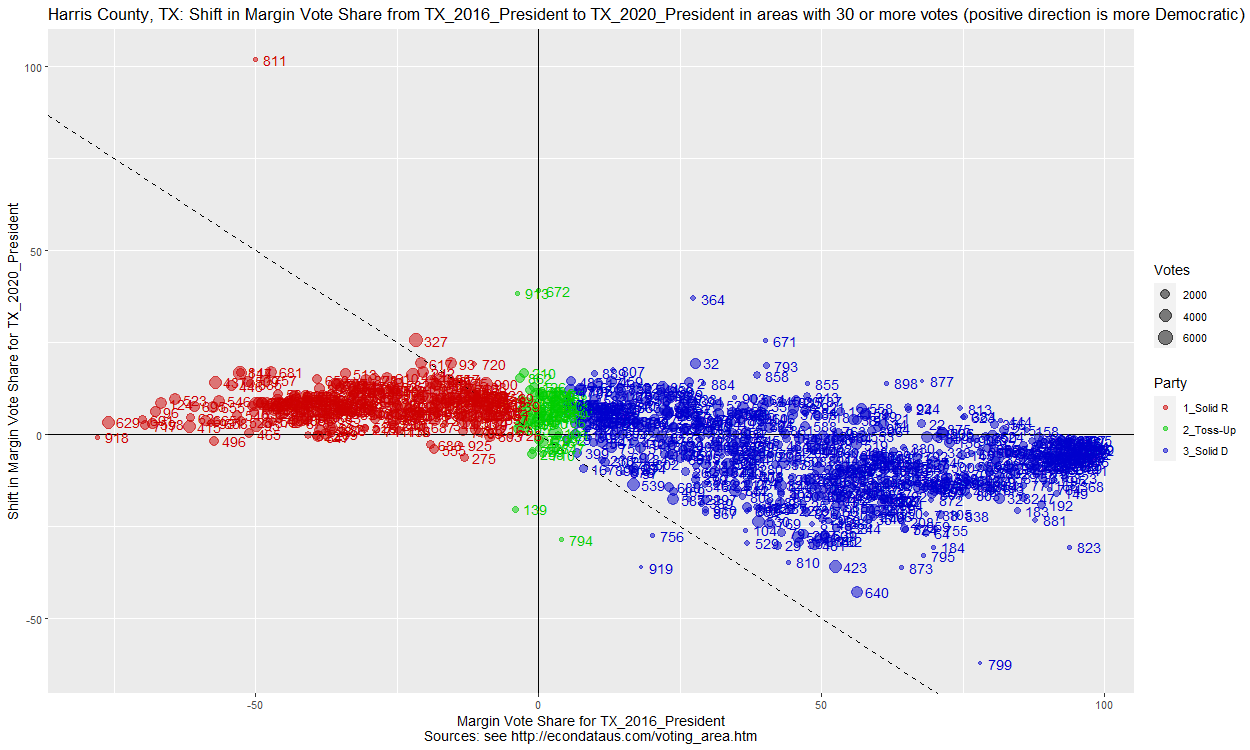
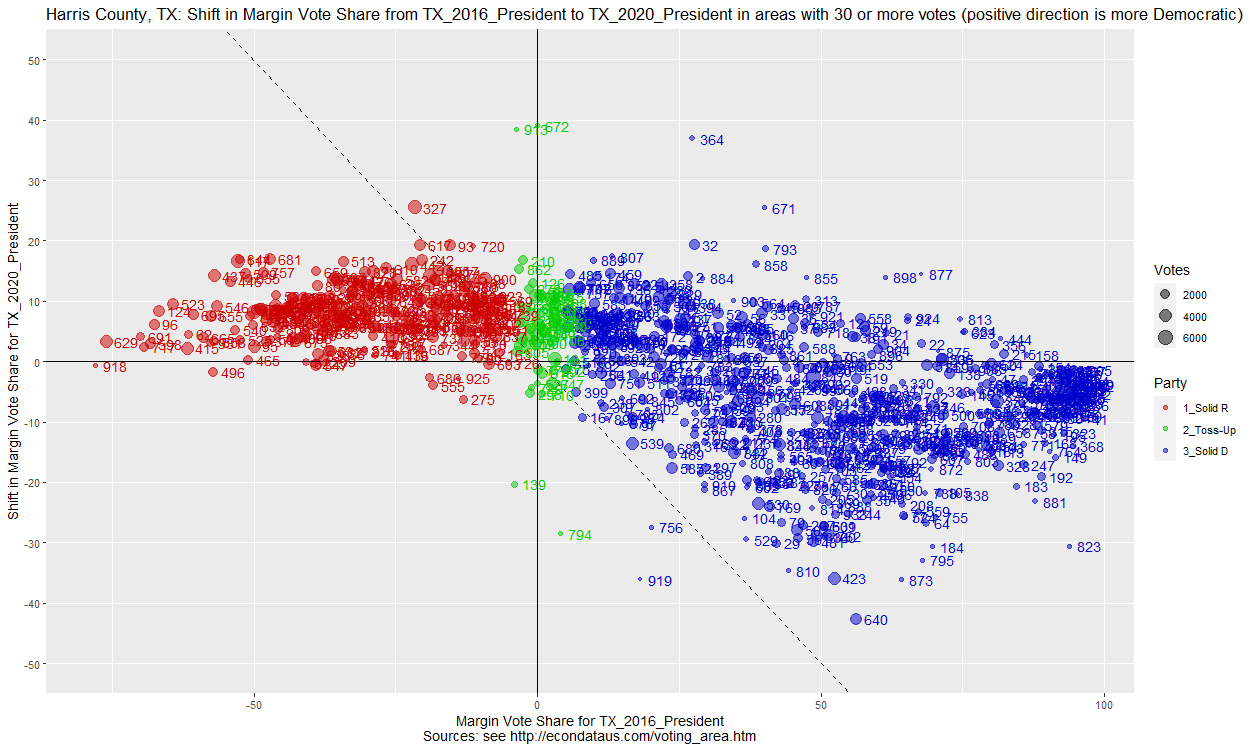
Comparing the 2016 and 2020 Presidential Races in Texas
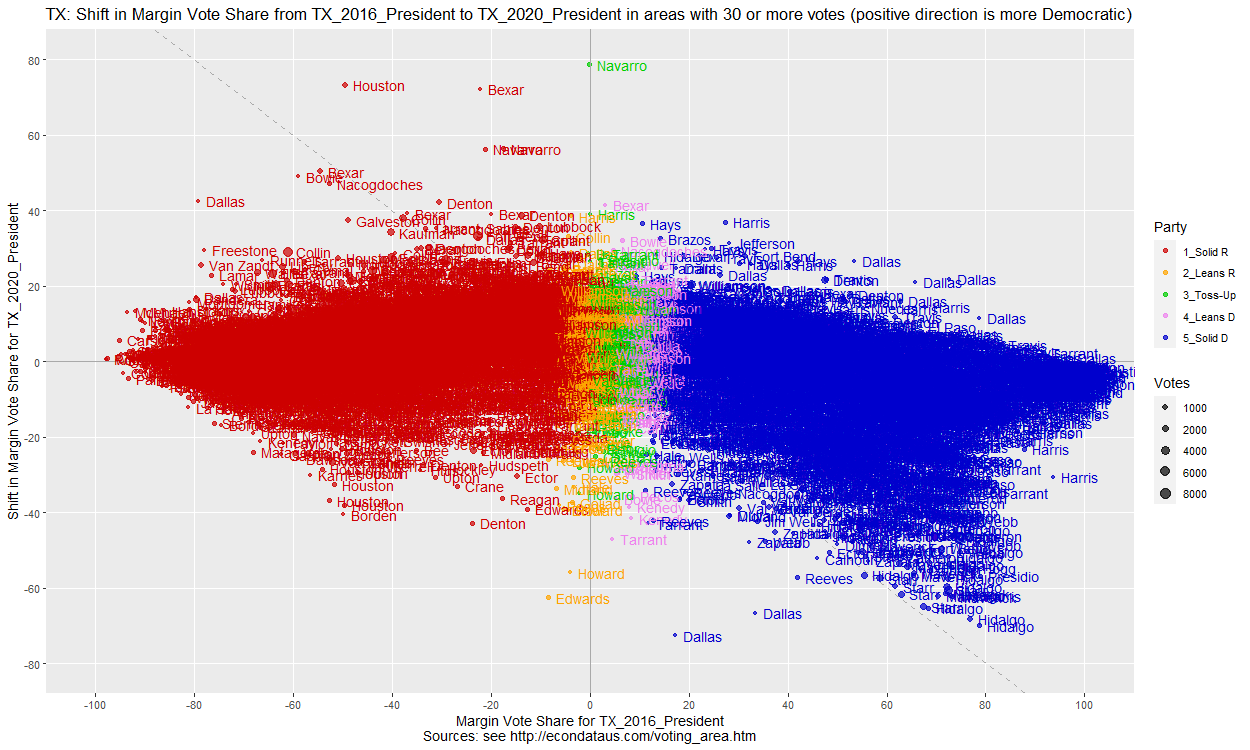
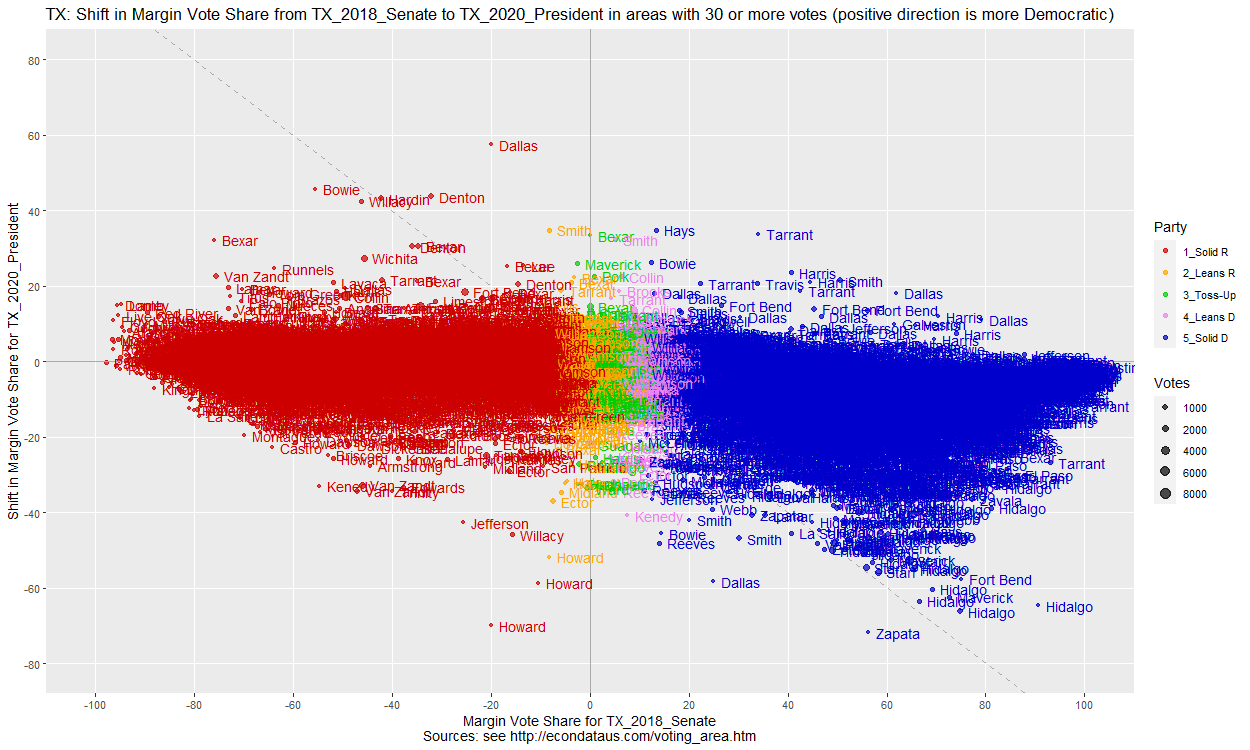
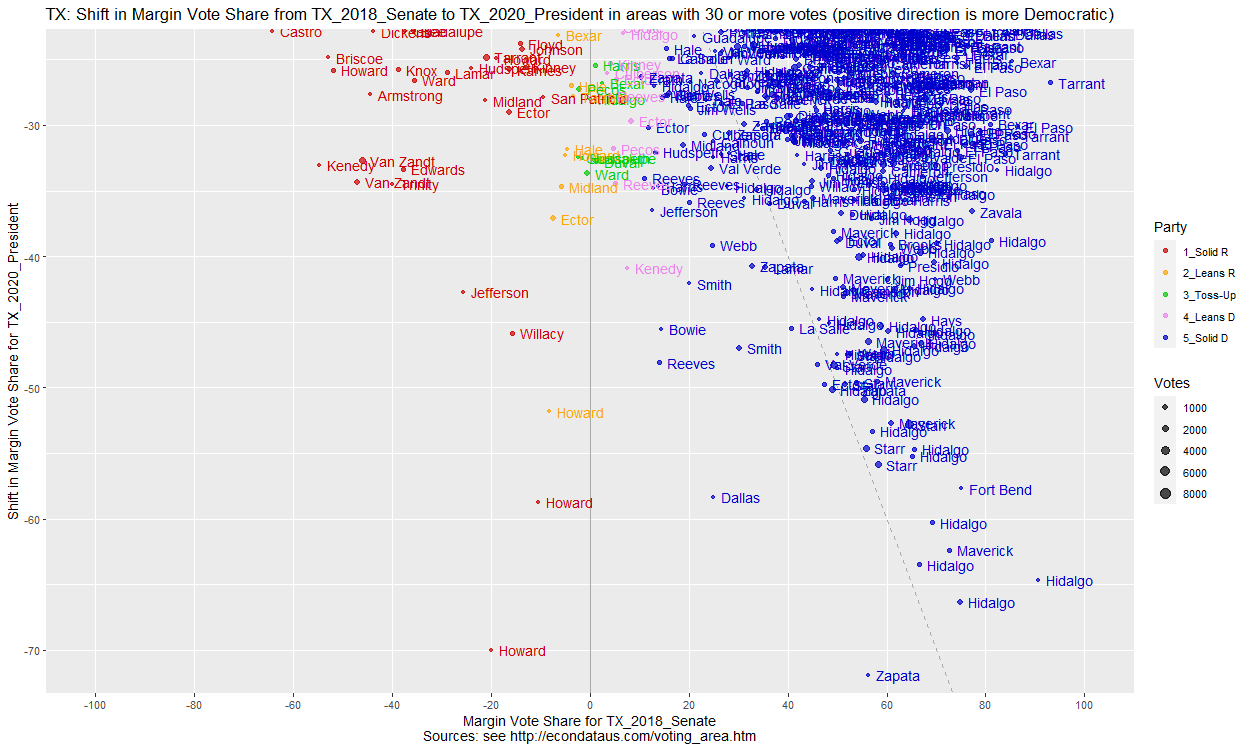
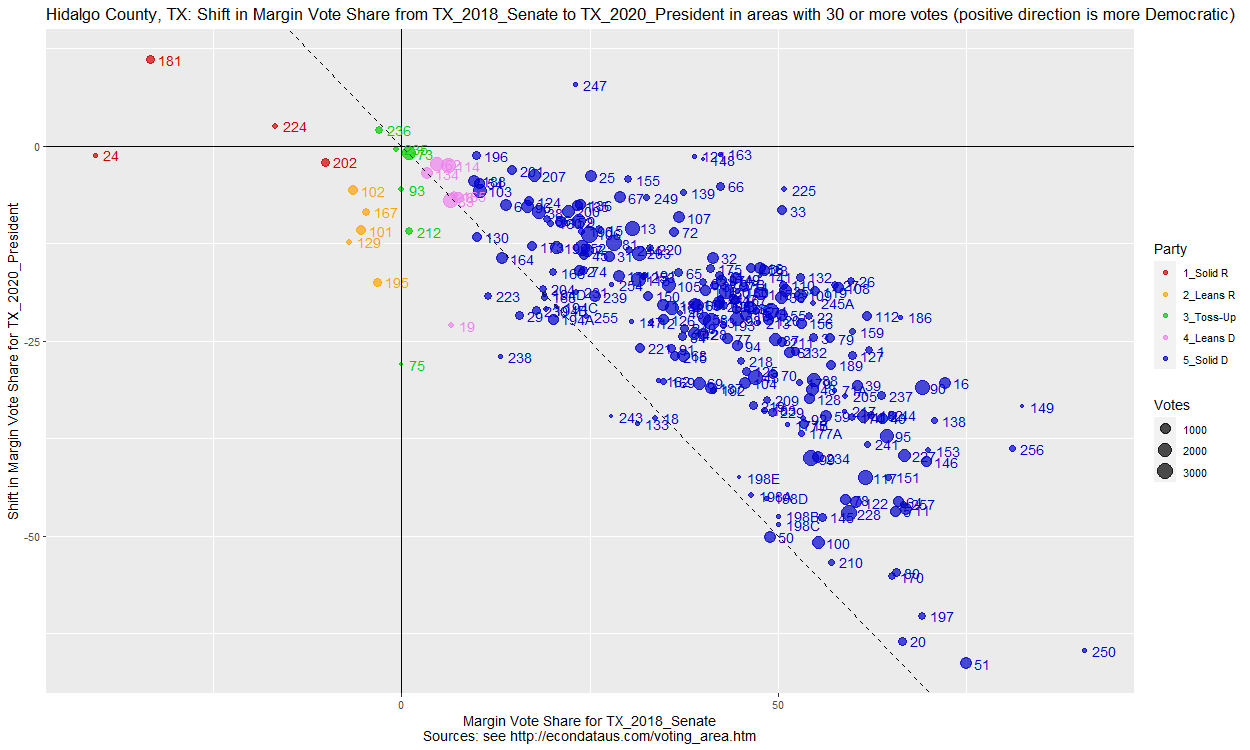
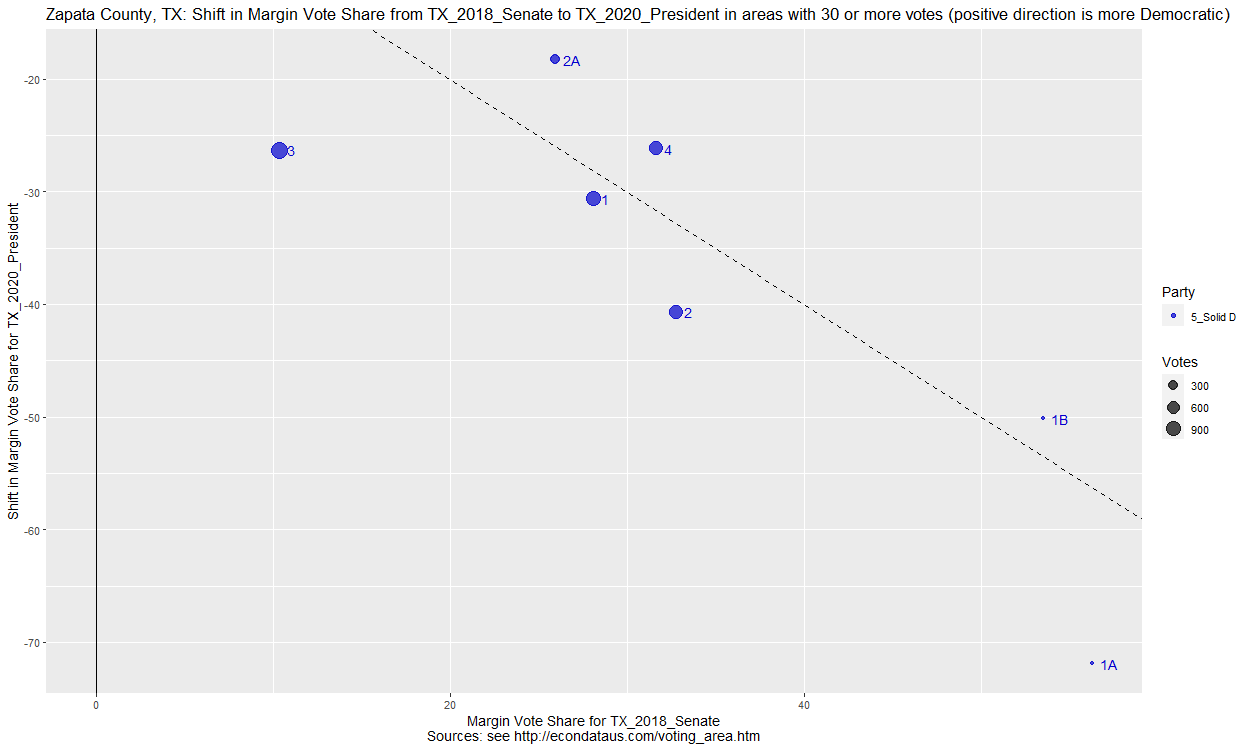
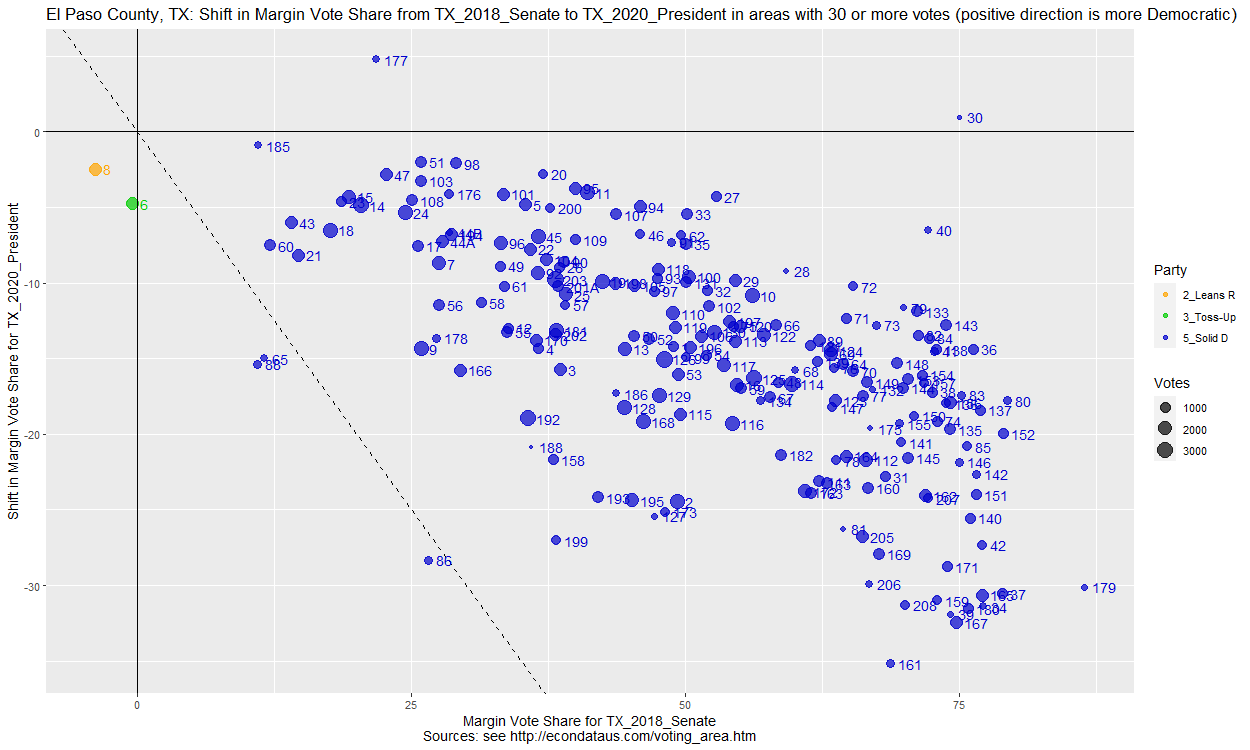
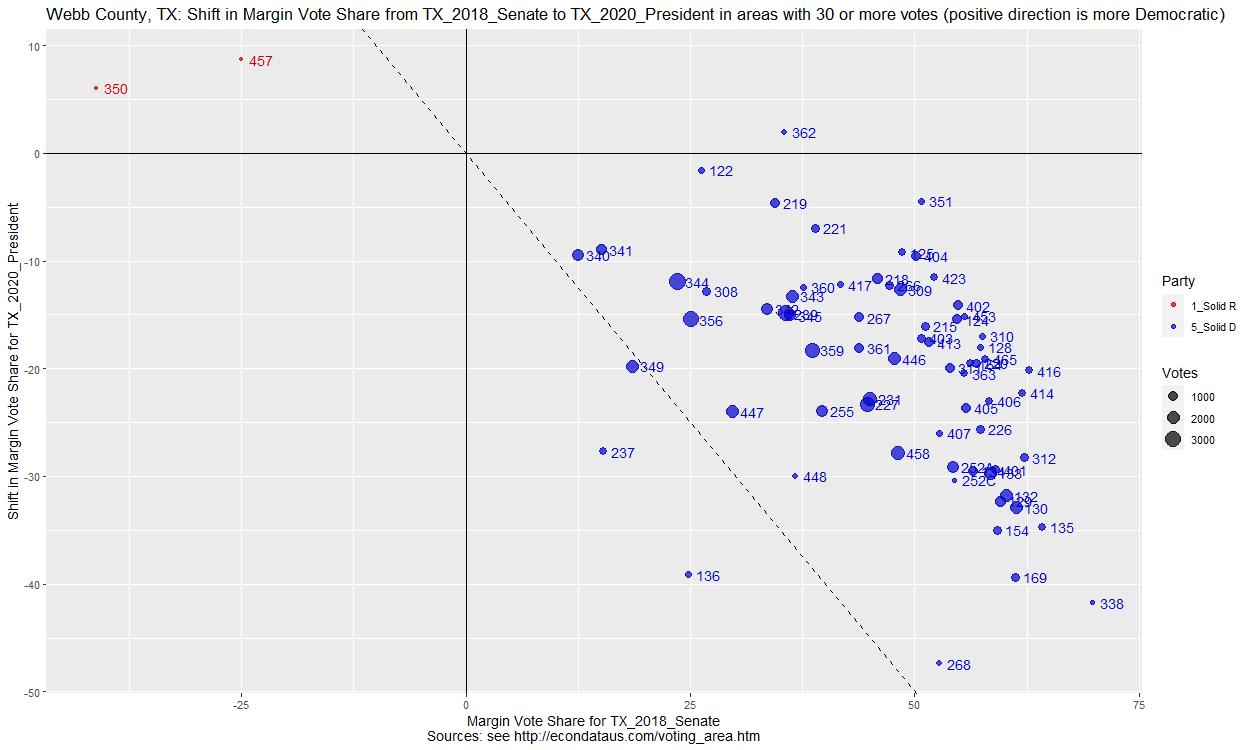
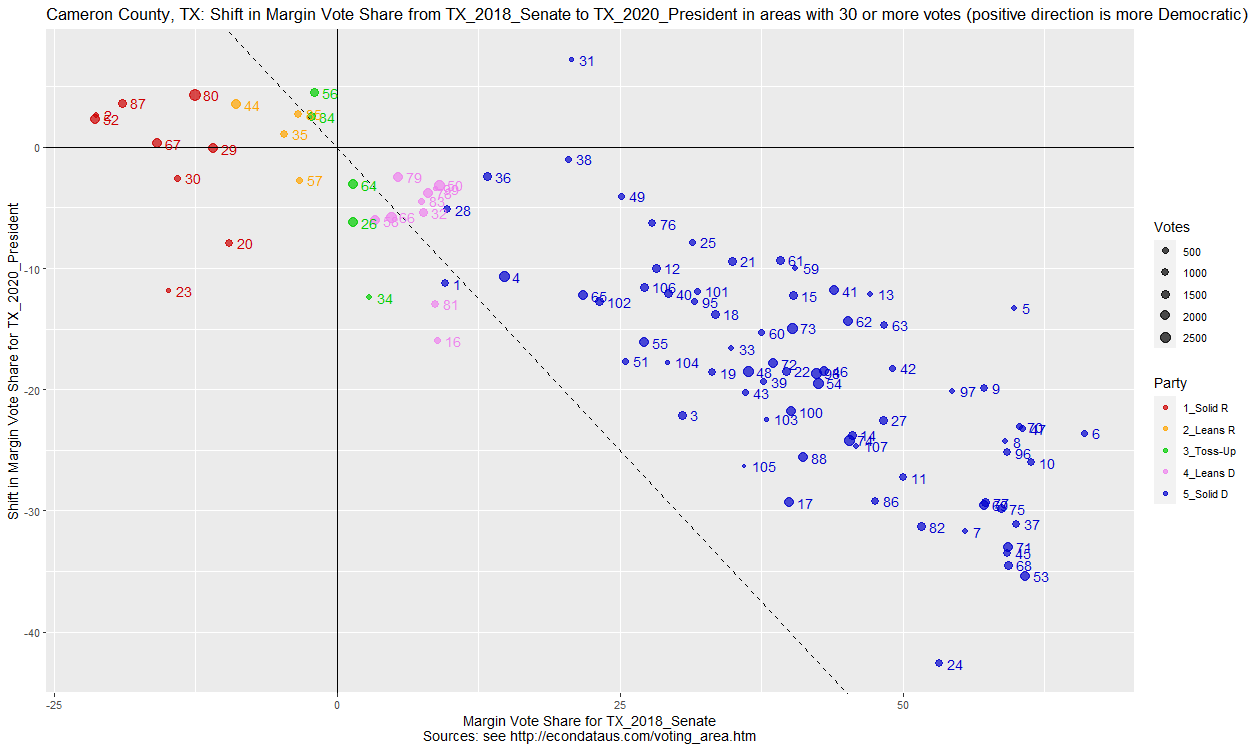
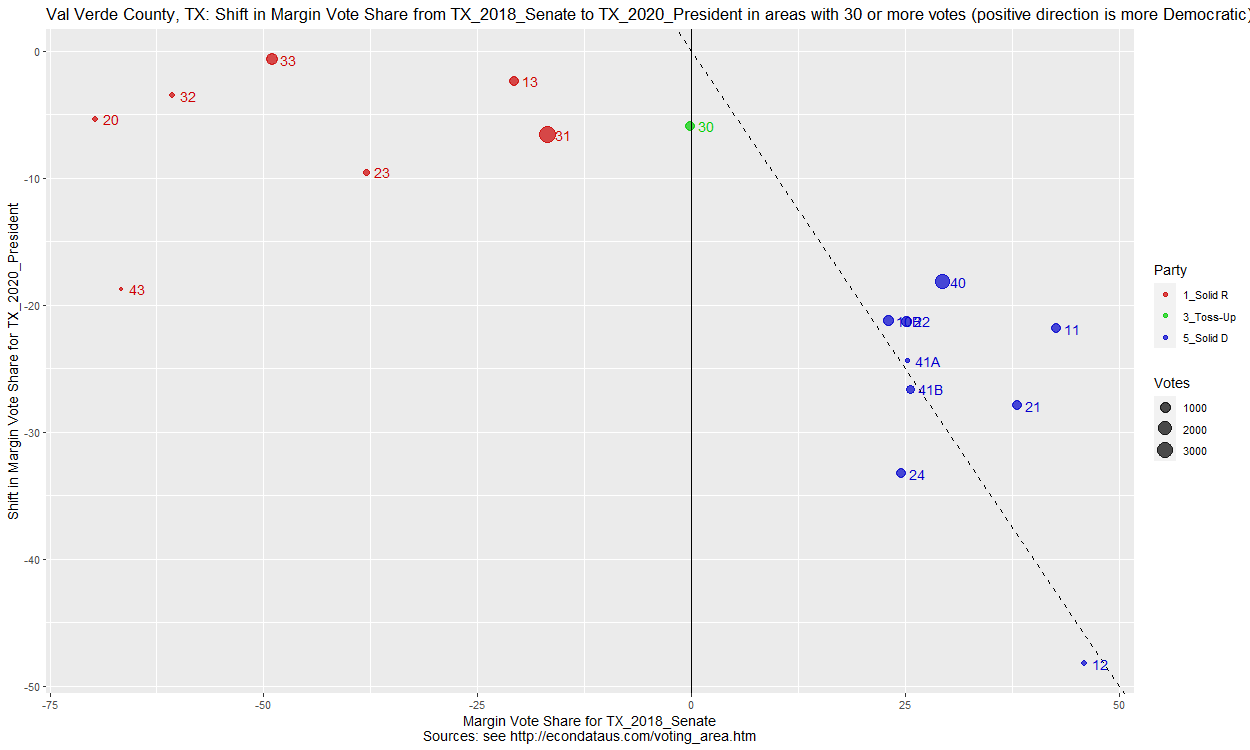
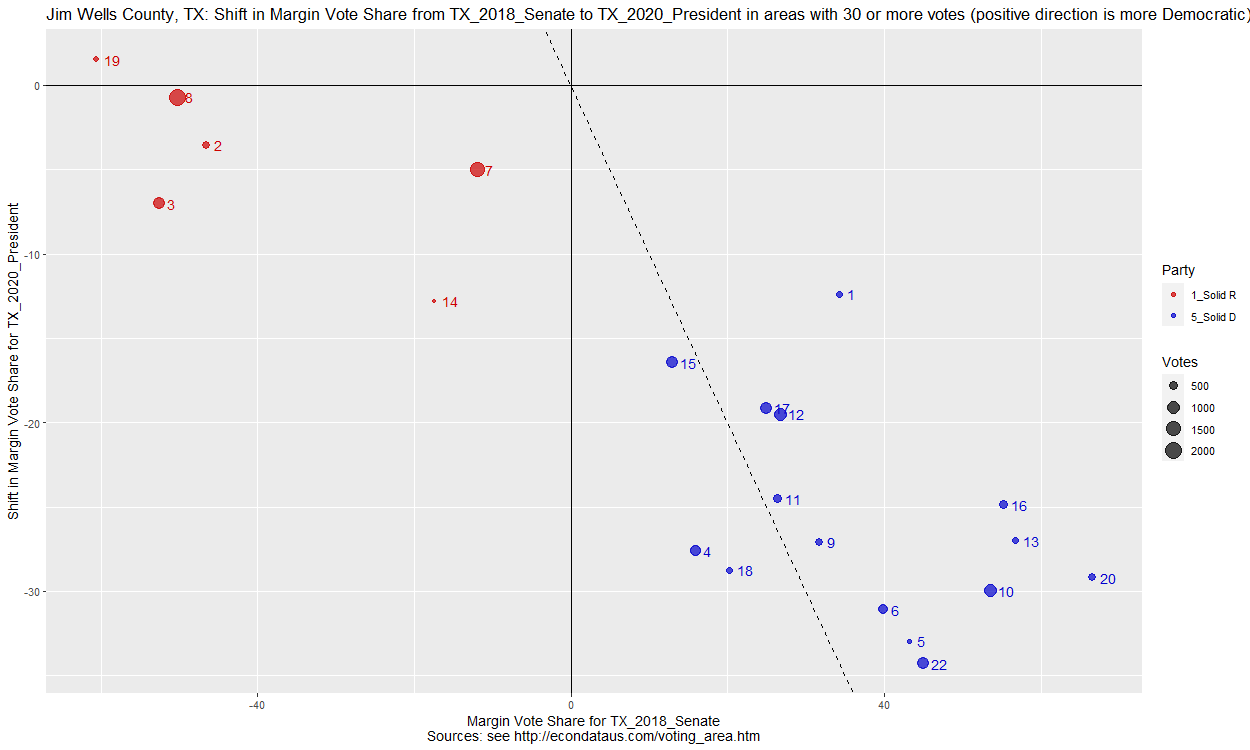
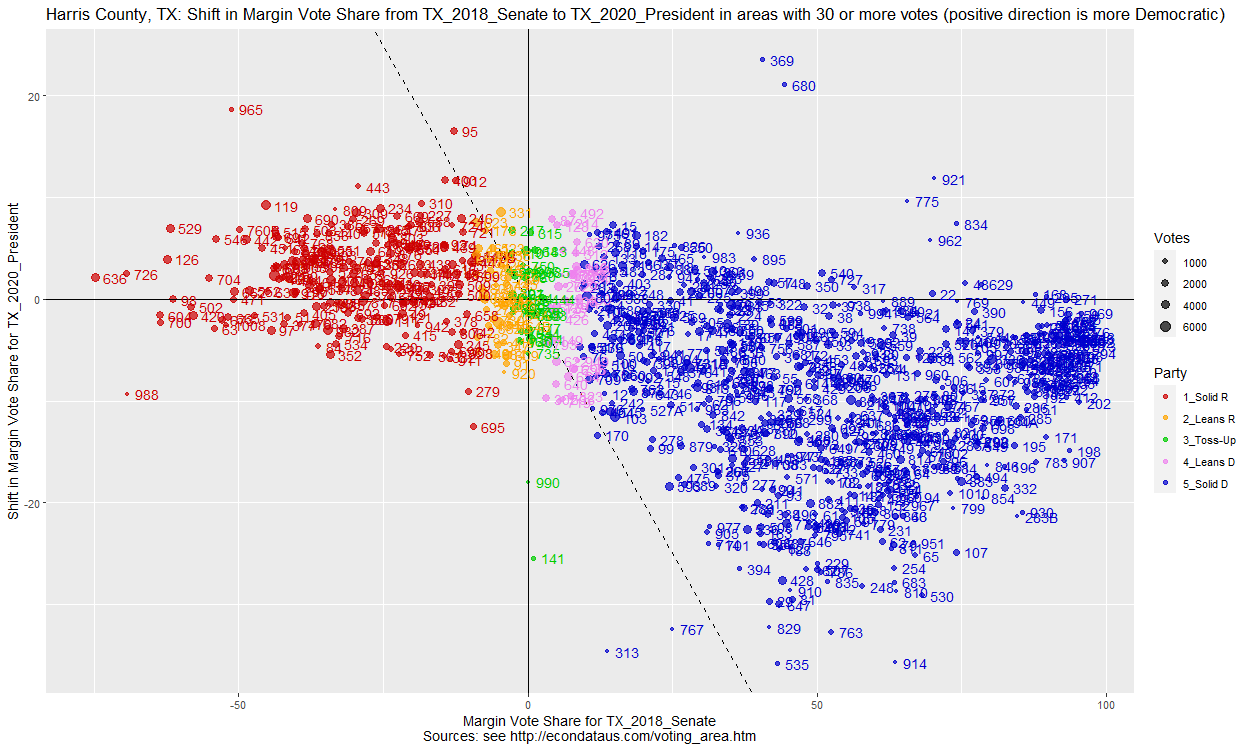
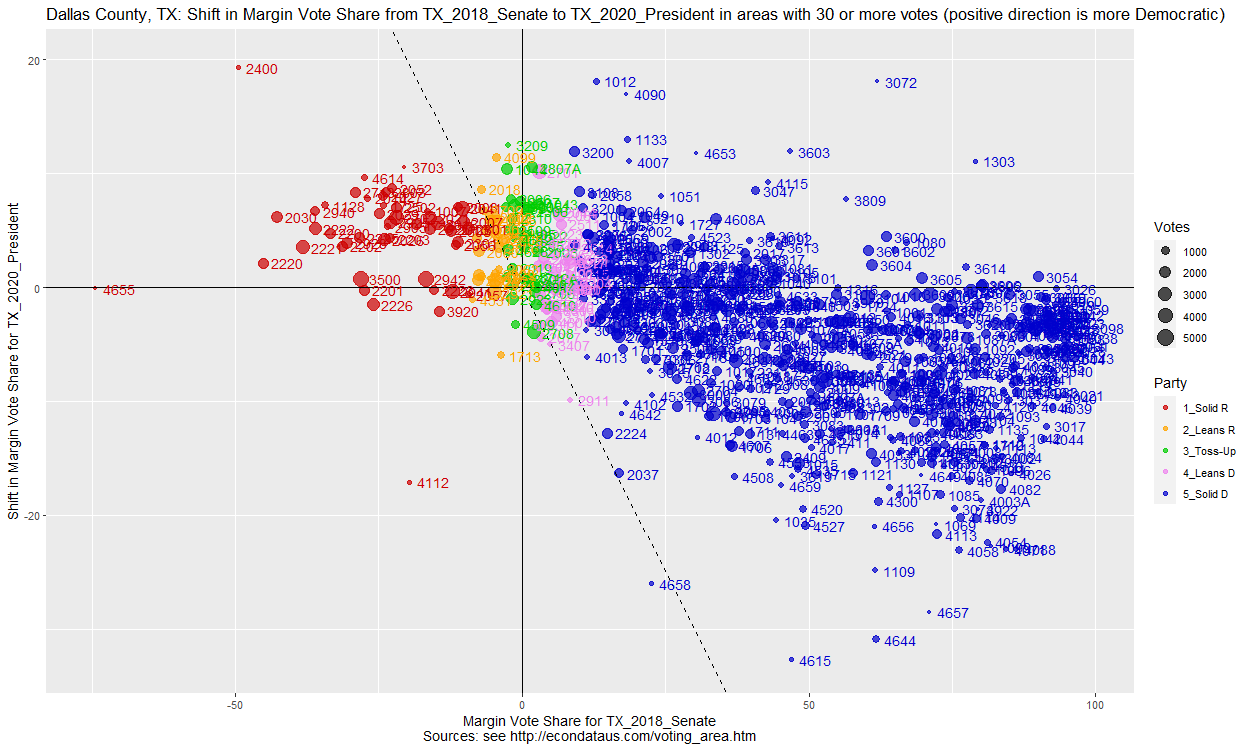
Comparing the 2018 Senate and the 2020 Presidential Races in Texas by County
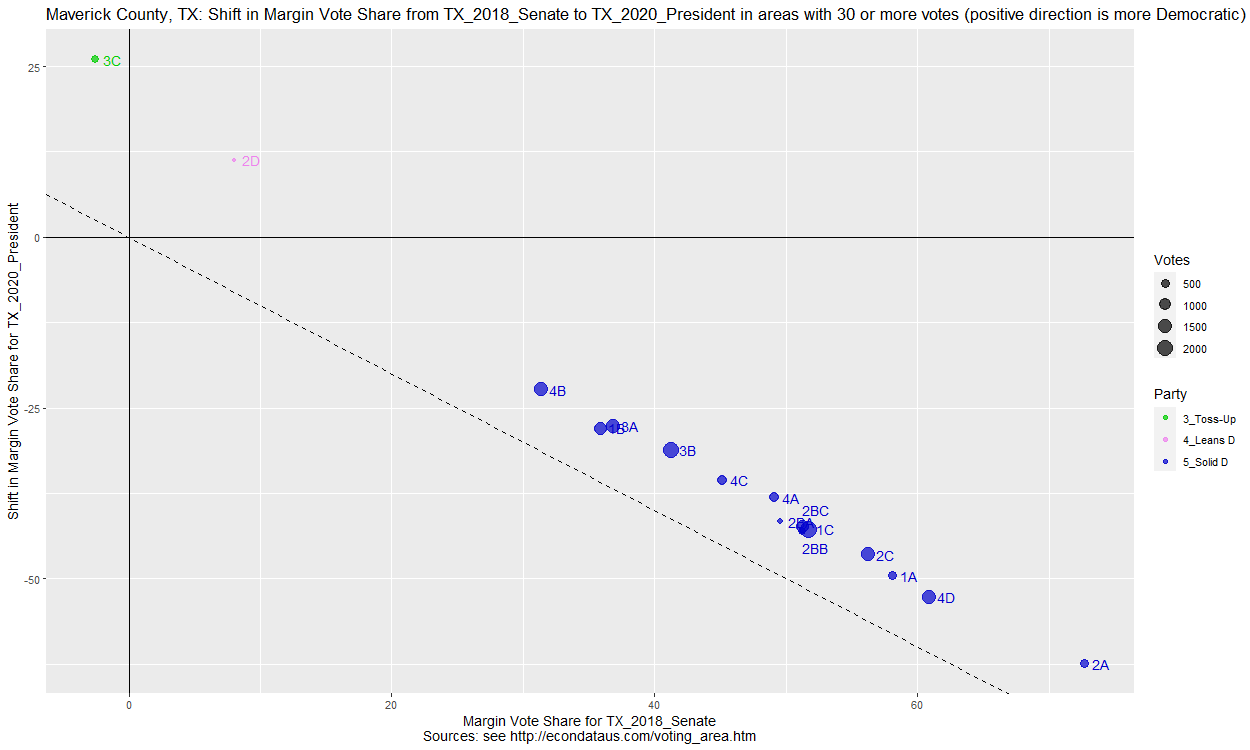
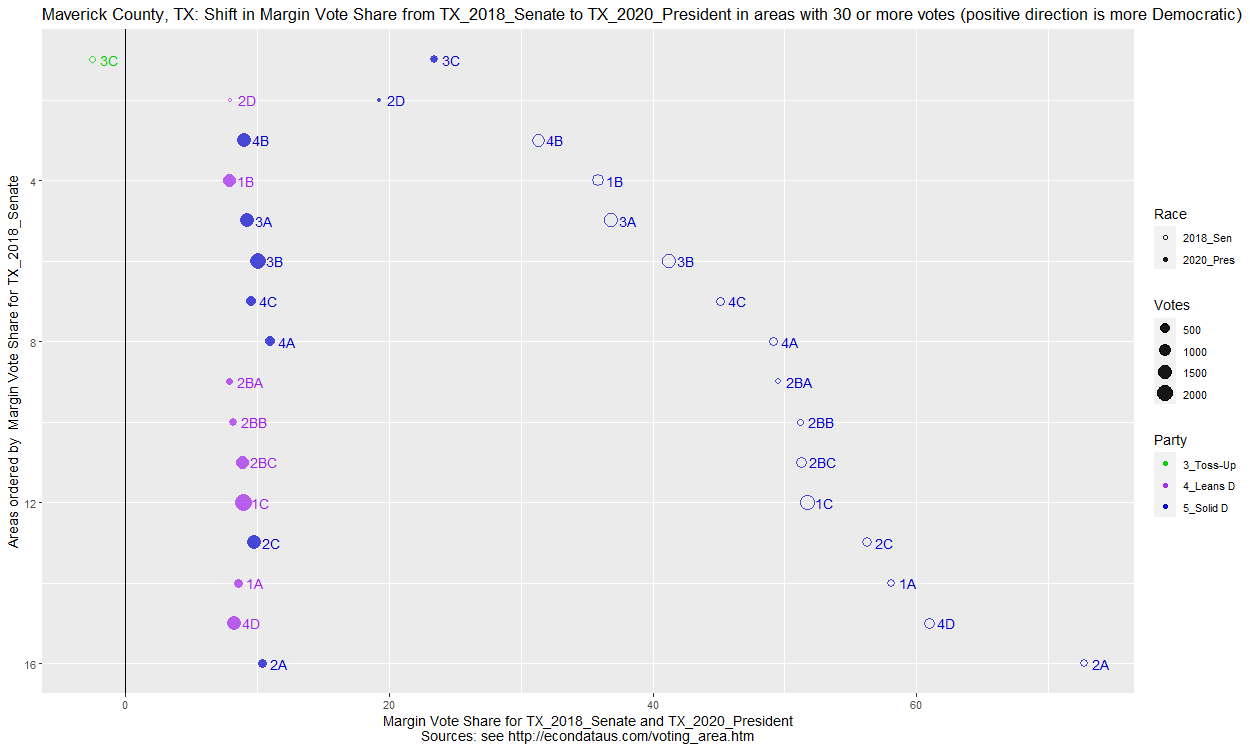
Comparing the 2018 Senate and 2020 Presidential Races in Maverick County, TX (percent)
     COUNTY     AREA ORourke  Cruz MARGIN1 TOTAL1 Biden Trump MARGIN2 TOTAL2 DEM_SH REP_SH MAR_SH TOT_SH TOT1_N
1  Maverick  323001A   78.85 20.79   58.06  99.64 54.16 45.59    8.56  99.75 -24.70  24.80 -49.50   0.11    279
2  Maverick  323001B   67.43 31.53   35.90  98.96 53.35 45.43    7.92  98.78 -14.08  13.90 -27.98  -0.17  1,053
3  Maverick  323001C   75.41 23.70   51.71  99.12 54.03 45.05    8.98  99.08 -21.38  21.35 -42.73  -0.03  1,582
4  Maverick  323002A   86.18 13.45   72.73  99.64 55.06 44.71   10.35  99.76 -31.12  31.25 -62.37   0.13    275
5  Maverick 323002BA   73.83 24.30   49.53  98.13 52.73 44.85    7.88  97.58 -21.10  20.55 -41.65  -0.56    107
6  Maverick 323002BB   75.36 24.15   51.21  99.52 53.94 45.74    8.20  99.68 -21.42  21.59 -43.01   0.17    207
7  Maverick 323002BC   75.09 23.82   51.27  98.91 53.94 45.04    8.90  98.98 -21.15  21.22 -42.37   0.06    827
8  Maverick  323002C   77.58 21.29   56.29  98.87 54.40 44.60    9.80  99.01 -23.18  23.31 -46.49   0.13    620
9  Maverick  323002D   54.00 46.00    8.00 100.00 59.65 40.35   19.30 100.00   5.65  -5.65  11.30   0.00     50
10 Maverick  323003A   67.92 31.03   36.88  98.95 54.27 45.05    9.23  99.32 -13.64  14.01 -27.65   0.37  1,334
11 Maverick  323003B   70.12 28.86   41.26  98.98 54.66 44.59   10.07  99.25 -15.47  15.73 -31.19   0.26  1,476
12 Maverick  323003C   48.52 51.05   -2.53  99.58 61.72 38.28   23.44 100.00  13.20 -12.77  25.97   0.42    237
13 Maverick  323004A   73.66 24.55   49.10  98.21 55.41 44.40   11.01  99.81 -18.25  19.85 -38.10   1.60    391
14 Maverick  323004B   65.30 33.96   31.34  99.26 53.99 44.97    9.02  98.97 -11.31  11.01 -22.32  -0.30  1,222
15 Maverick  323004C   72.56 27.44   45.12 100.00 54.63 45.05    9.58  99.69 -17.93  17.61 -35.54  -0.31    430
16 Maverick  323004D   80.03 19.10   60.93  99.13 53.40 45.15    8.25  98.55 -26.63  26.06 -52.68  -0.57    686
17    TOTAL    TOTAL   71.71 27.38   44.32  99.09 54.29 44.84    9.46  99.13 -17.41  17.45 -34.87   0.04 10,776
Comparing the 2018 Senate and 2020 Presidential Races in Maverick County, TX (counts)
     COUNTY     AREA ORourke  Cruz MARGIN1 TOTAL1 Biden Trump MARGIN2 TOTAL2 DEM_SH REP_SH MAR_SH TOT_SH
1  Maverick  323001A     220    58     162    279   215   181      34    397     -5    123   -128    118
2  Maverick  323001B     710   332     378  1,053   613   522      91  1,149    -97    190   -287     96
3  Maverick  323001C   1,193   375     818  1,582 1,240 1,034     206  2,295     47    659   -612    713
4  Maverick  323002A     237    37     200    275   234   190      44    425     -3    153   -156    150
5  Maverick 323002BA      79    26      53    107    87    74      13    165      8     48    -40     58
6  Maverick 323002BB     156    50     106    207   171   145      26    317     15     95    -80    110
7  Maverick 323002BC     621   197     424    827   685   572     113  1,270     64    375   -311    443
8  Maverick  323002C     481   132     349    620   766   628     138  1,408    285    496   -211    788
9  Maverick  323002D      27    23       4     50    34    23      11     57      7      0      7      7
10 Maverick  323003A     906   414     492  1,334   800   664     136  1,474   -106    250   -356    140
11 Maverick  323003B   1,035   426     609  1,476 1,162   948     214  2,126    127    522   -395    650
12 Maverick  323003C     115   121      -6    237   158    98      60    256     43    -23     66     19
13 Maverick  323004A     288    96     192    391   297   238      59    536      9    142   -133    145
14 Maverick  323004B     798   415     383  1,222   784   653     131  1,452    -14    238   -252    230
15 Maverick  323004C     312   118     194    430   348   287      61    637     36    169   -133    207
16 Maverick  323004D     549   131     418    686   738   624     114  1,382    189    493   -304    696
17    TOTAL    TOTAL   7,727 2,951   4,776 10,776 8,332 6,881   1,451 15,346    605  3,930 -3,325  4,570
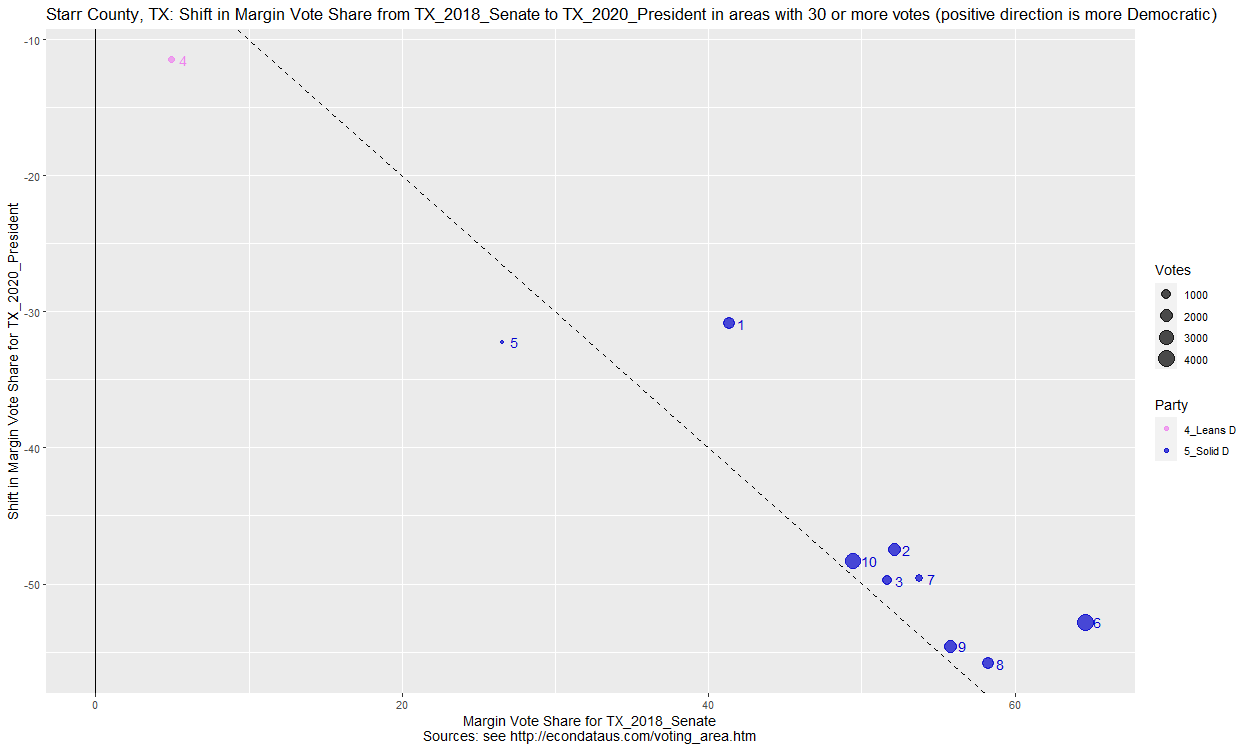
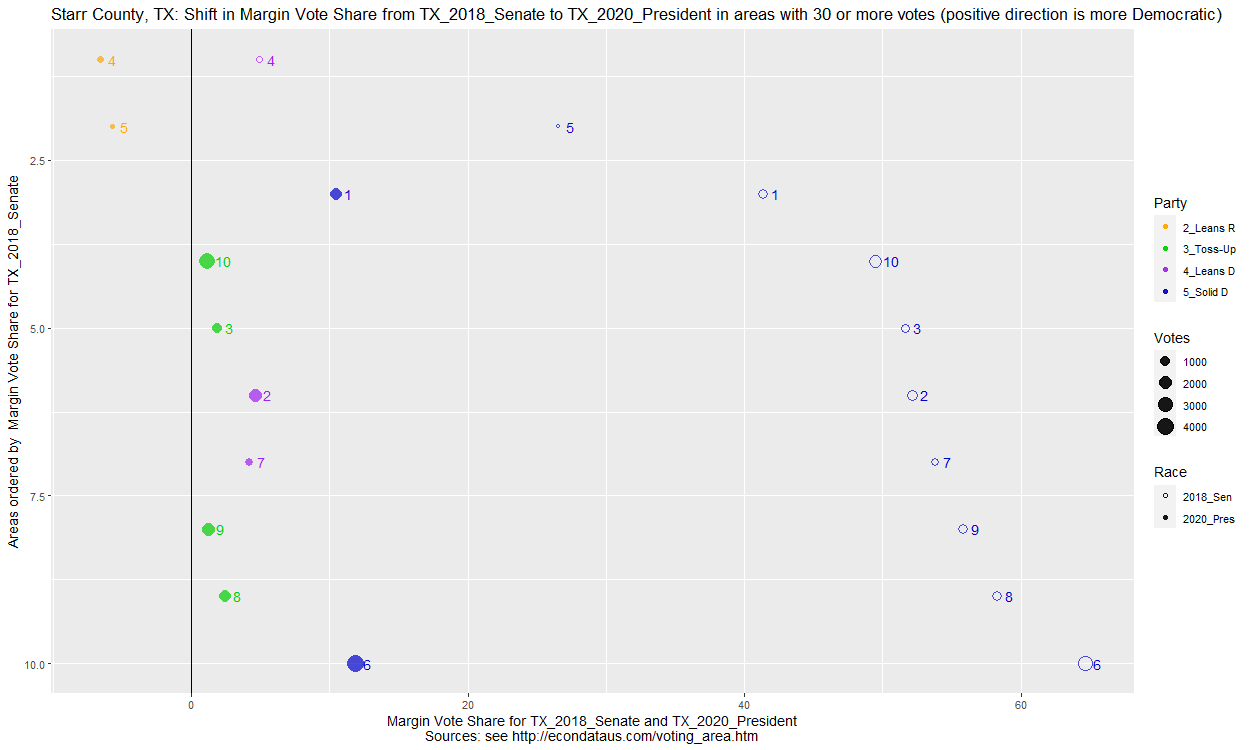
Comparing the 2018 Senate and 2020 Presidential Races in Starr County, TX (percent)
   COUNTY    AREA ORourke  Cruz MARGIN1 TOTAL1 Biden Trump MARGIN2 TOTAL2 DEM_SH REP_SH MAR_SH TOT_SH TOT1_N
1   Starr 4270001   70.40 29.08   41.33  99.48 54.78 44.31   10.46  99.09 -15.63  15.24 -30.87  -0.39    963
2   Starr 4270002   75.98 23.87   52.11  99.84 51.86 47.22    4.65  99.08 -24.11  23.35 -47.47  -0.76  1,278
3   Starr 4270003   75.28 23.61   51.66  98.89 50.27 48.37    1.91  98.64 -25.01  24.75 -49.76  -0.25    631
4   Starr 4270004   52.45 47.55    4.91 100.00 46.30 52.88   -6.58  99.18  -6.15   5.33 -11.48  -0.82    265
5   Starr 4270005   63.27 36.73   26.53 100.00 47.14 52.86   -5.71 100.00 -16.12  16.12 -32.24   0.00     49
6   Starr 4270006   81.76 17.15   64.62  98.91 55.42 43.60   11.82  99.02 -26.34  26.45 -52.79   0.11  3,219
7   Starr 4270007   76.65 22.88   53.77  99.53 51.59 47.42    4.17  99.01 -25.06  24.54 -49.61  -0.52    424
8   Starr 4270008   78.91 20.65   58.26  99.57 50.56 48.14    2.42  98.71 -28.35  27.49 -55.84  -0.86    920
9   Starr 4270009   77.66 21.86   55.80  99.52 50.14 48.92    1.22  99.05 -27.52  27.06 -54.58  -0.46  1,034
10  Starr 4270010   74.53 25.06   49.47  99.59 50.11 48.96    1.15  99.07 -24.42  23.90 -48.31  -0.52  1,967
11  TOTAL   TOTAL   76.71 22.66   54.05  99.37 52.00 47.00    5.00  99.00 -24.71  24.34 -49.05  -0.37 10,750
Comparing the 2018 Senate and 2020 Presidential Races in Starr County, TX (counts)
   COUNTY    AREA ORourke  Cruz MARGIN1 TOTAL1 Biden Trump MARGIN2 TOTAL2 DEM_SH REP_SH MAR_SH TOT_SH
1   Starr 4270001     678   280     398    963   843   682     161  1,539    165    402   -237    576
2   Starr 4270002     971   305     666  1,278 1,183 1,077     106  2,281    212    772   -560  1,003
3   Starr 4270003     475   149     326    631   554   533      21  1,102     79    384   -305    471
4   Starr 4270004     139   126      13    265   169   193     -24    365     30     67    -37    100
5   Starr 4270005      31    18      13     49    33    37      -4     70      2     19    -17     21
6   Starr 4270006   2,632   552   2,080  3,219 2,264 1,781     483  4,085   -368  1,229 -1,597    866
7   Starr 4270007     325    97     228    424   260   239      21    504    -65    142   -207     80
8   Starr 4270008     726   190     536    920   899   856      43  1,778    173    666   -493    858
9   Starr 4270009     803   226     577  1,034 1,111 1,084      27  2,216    308    858   -550  1,182
10  Starr 4270010   1,466   493     973  1,967 1,783 1,742      41  3,558    317  1,249   -932  1,591
11  TOTAL   TOTAL   8,246 2,436   5,810 10,750 9,099 8,224     875 17,498    853  5,788 -4,935  6,748
Comparing the 2016 and 2020 Presidential Races in Texas using various Plot Types
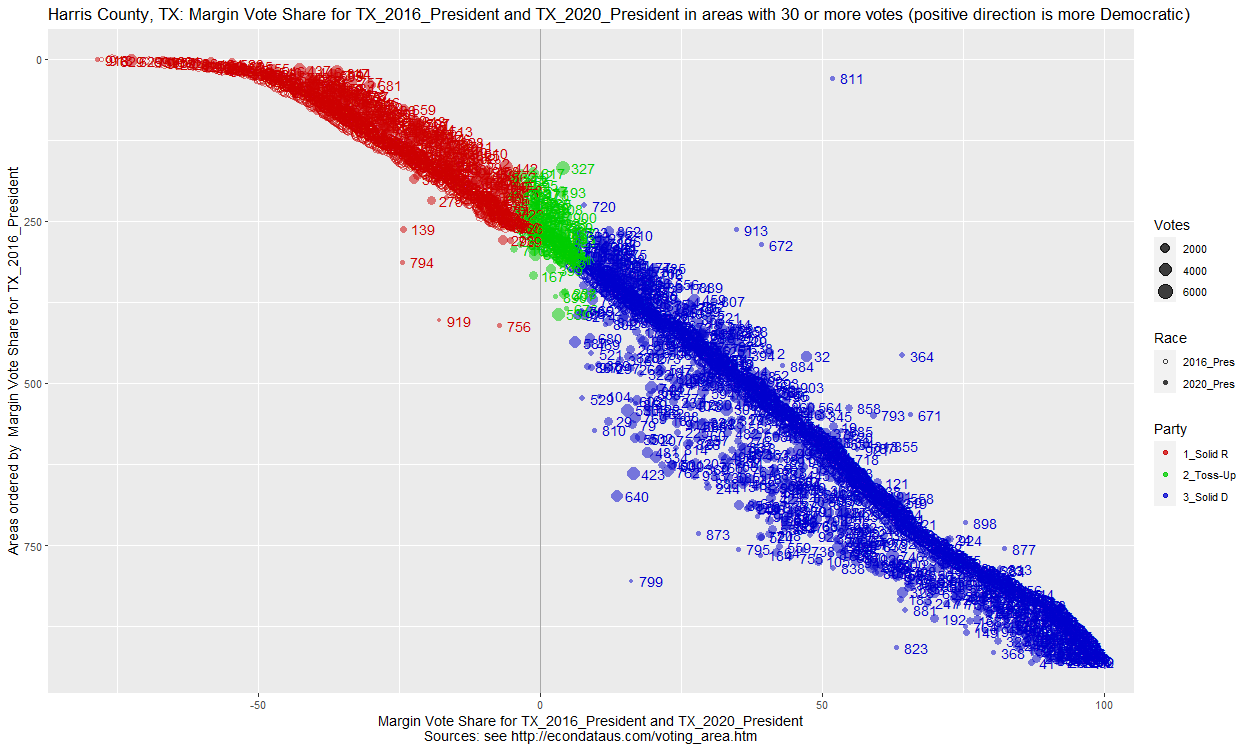
X/X Plots
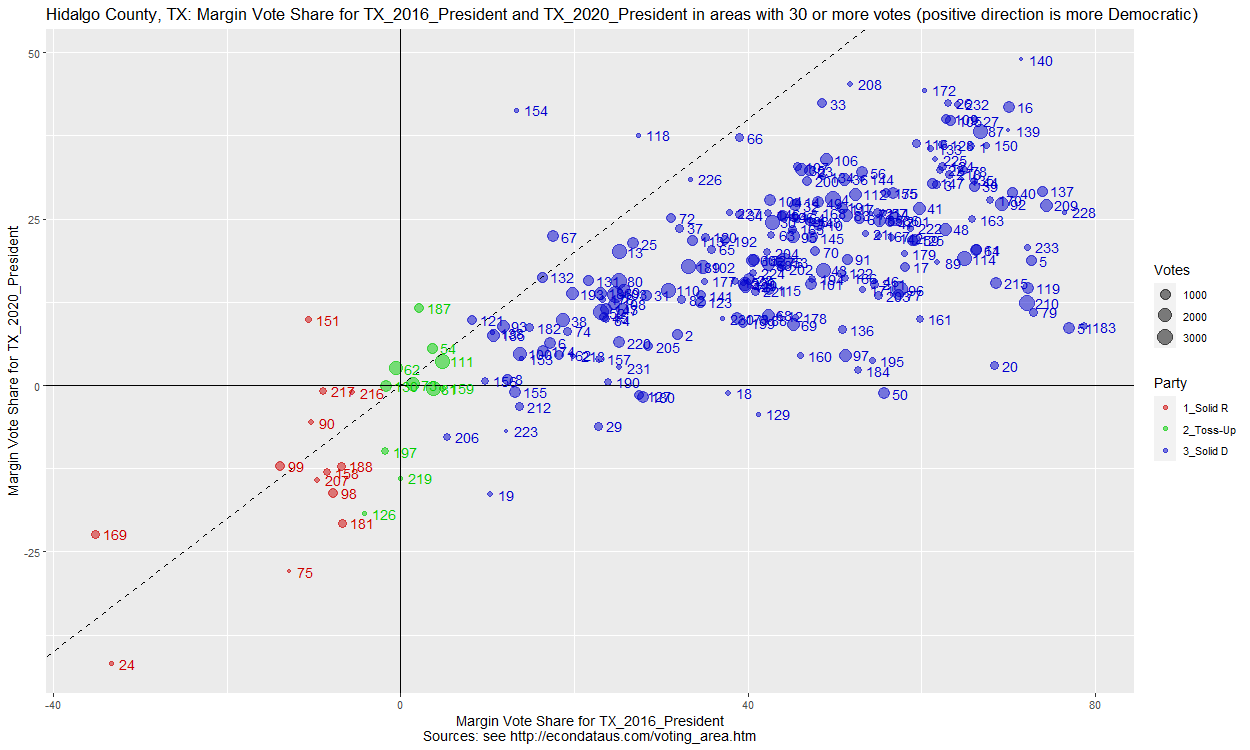
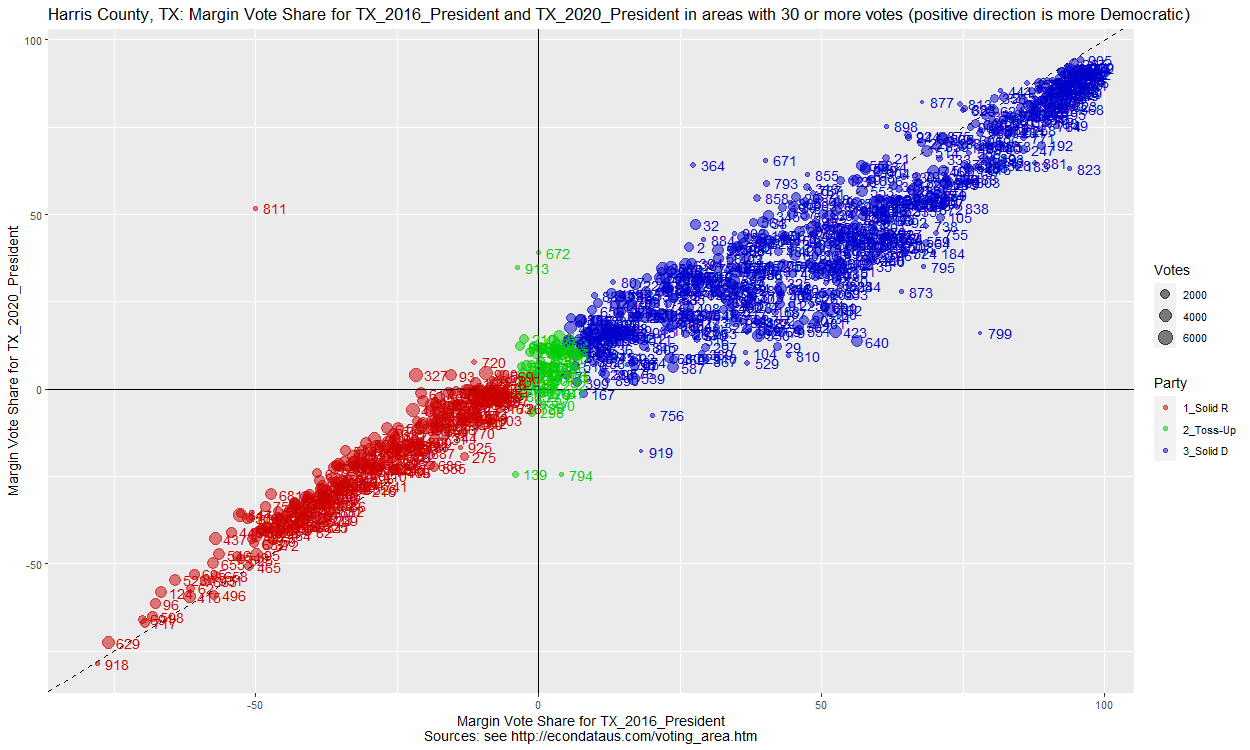
X/Y Plots
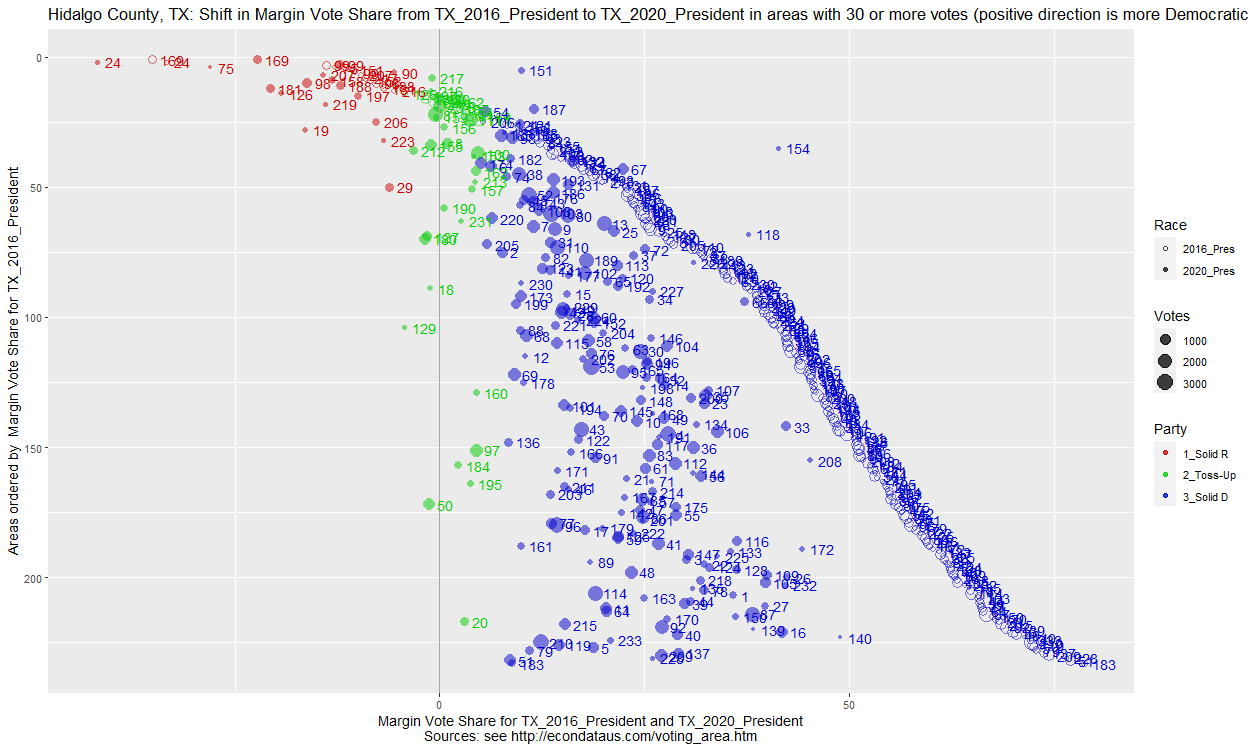
X/dX Plots
X/dX Plots, removing two outliers
Precinct Data Locations
If anyone should run into any issues or have any suggestions for additional features, feel free to let me know via the Contact box at the bottom of this page.
2020 U.S. Election
Polling Election Data
Comparing Polling and Election Results via R Shiny
Red Shifts for 2020 Election Cycle, November 18, 2020
Precinct Election Data
Analysis of Reported Voting Areas via R Shiny
Analysis of Reported Voting Areas in Florida via R Shiny
Analysis of the Distribution of Precinct Margins by County via R Shiny
Precinct Results in Florida through 2020
Precinct Results in Iowa through 2020
Precinct Results in Maine through 2020
Precinct Results in North Carolina through 2020
Precinct Results in South Carolina through 2020
Precinct Results in Texas through 2020
County Election Data
Exploring Federal Election Results by County via R Shiny
County Results in Arizona in 2020
County Results in California in 2020
County Results in Florida in 2020
County Results in Iowa in 2020
County Results in Kentucky in 2020
County Results in Maine in 2020
County Results in Montana in 2020
County Results in Pennsylvania in 2020
County Results in South Carolina in 2020
County Results in Texas in 2020