Comparing the Weighted Standard Deviation of Precinct Margins by County
The document section at this link describes how the margins in all but two of the precincts in Maverick County were in a very narrow range of 8 to 11 percent in the 2020 Presidential election. This was a change from a much wider 43 to 73 percent in 2016. It also mentions how this data was obtained from the Capitol Data Portal in early June of 2021 but, when it was retrieved three months later, it had changed. The next section then describes how the original version of the data matched the data stored in the New York Times interactive map at this link. A link to the 2020 election data for this map can be found at this link.
A Shiny app was created to look at the New York Times data and search for other counties similar to Maverick County. Currently, it simply calculates the weighted standard deviation of the margins of all precincts in each county and sorts them from the lowest to the highest. The weighted standard deviations are weighted by number of votes. This causes precincts with fewer votes to have less effect. The following table shows the first 32 counties that contained 4 or more precincts:
                  county state  fips        sd      sdW    min   max  votes   n
1               Garfield    MT 30033  1.034408 1.146559  -89.5 -87.1    813   4
2               Hardeman    TX 48197  1.152895 1.202852  -70.2 -67.6   1580   4
3               Franklin    NE 31061  1.625577 1.633956  -68.8 -65.5   1724   4
4              Somervell    TX 48425  1.684241 1.689237  -69.4 -65.6   4957   4
5                  Mason    TX 48319  1.751190 1.794735  -64.4 -60.6   2474   4
6               Maverick    TX 48323  4.333123 2.169386    7.9  23.4  15346  16
7                   Knox    TX 48275  3.205412 2.215319  -69.6 -60.3   1456   6
8                  Mills    TX 48333  2.311462 2.282328  -80.8 -74.6   2505   7
9               San Saba    TX 48411  2.513866 2.480153  -80.9 -74.2   2602   7
10                  Jack    TX 48237  3.135389 2.645874  -87.1 -77.8   3782   6
11          Judith Basin    MT 30045  2.767068 2.706815  -59.2 -53.1   1344   4
12             Ochiltree    TX 48357  2.914904 2.726851  -81.8 -74.8   3159   4
13                  Coke    TX 48081  2.898275 2.895478  -81.8 -76.4   1779   4
14                  Coal    OK 40029  2.867103 2.901718  -72.7 -63.6   2524   9
15              McMullen    TX 48311  3.364917 2.909174  -85.7 -77.0    516   6
16               Jackson    GA 13157  3.395463 2.909276  -60.4 -52.8  37670   4
17              Jim Hogg    TX 48247  5.074150 3.126725   13.1  27.3   2036   5
18                 Irion    TX 48235  3.201432 3.130305  -75.3 -68.5    893   4
19                Crosby    TX 48107  3.125700 3.138584  -48.1 -41.3   1953   4
20               Briscoe    TX 48045  3.523918 3.167582  -79.7 -70.7    725   5
21                 Scott    TN 47151  3.196682 3.195241  -82.0 -71.3   9052  10
22               Roberts    TX 48393  3.535110 3.388010  -97.1 -87.2    550   5
23                Furnas    NE 31065  5.918841 3.548821  -77.9 -56.8   2601   8
24               Coleman    TX 48083  3.393671 3.551249  -81.1 -71.8   4129   5
25                Garden    NE 31069  3.469390 3.555675  -74.5 -67.1   1195   4
26                 Union    TN 47173  3.450765 3.811202  -74.0 -63.1   8123   9
27                 Llano    TX 48299  4.366635 3.896955  -63.6 -50.6  12660   9
28              Callahan    TX 48059  3.791218 3.927404  -84.7 -73.8   6832   7
29                  Polk    TN 47139  3.678919 3.944814  -70.6 -58.6   8360   9
30              Montague    TX 48337  5.503358 3.985304  -89.5 -67.9   9832  15
31                Kimble    TX 48267  4.046398 4.106066  -80.6 -70.5   2292   7
32                Benton    TN 47005  4.227844 4.156192  -61.9 -50.5   7260   6
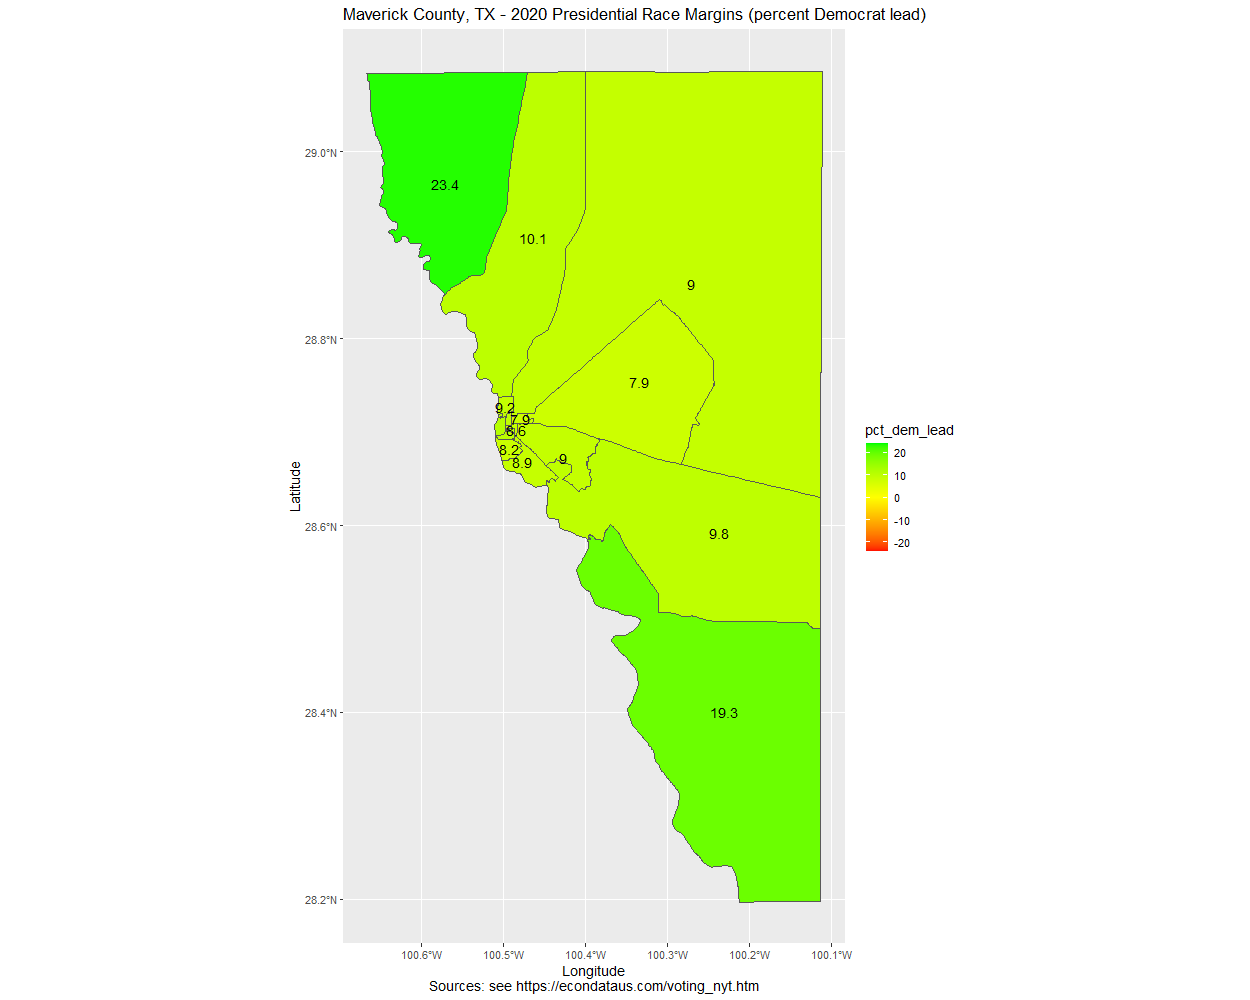
One surprising fact is that 21 of the first 31 counties are in Texas. Maverick County is number 6 on the list and its 15,346 votes are far greater than the prior highest of 4,957 for Somervell County, TX. Following is a map generated by the app for Maverick County:
The following map shows all 21 of the counties in Texas:
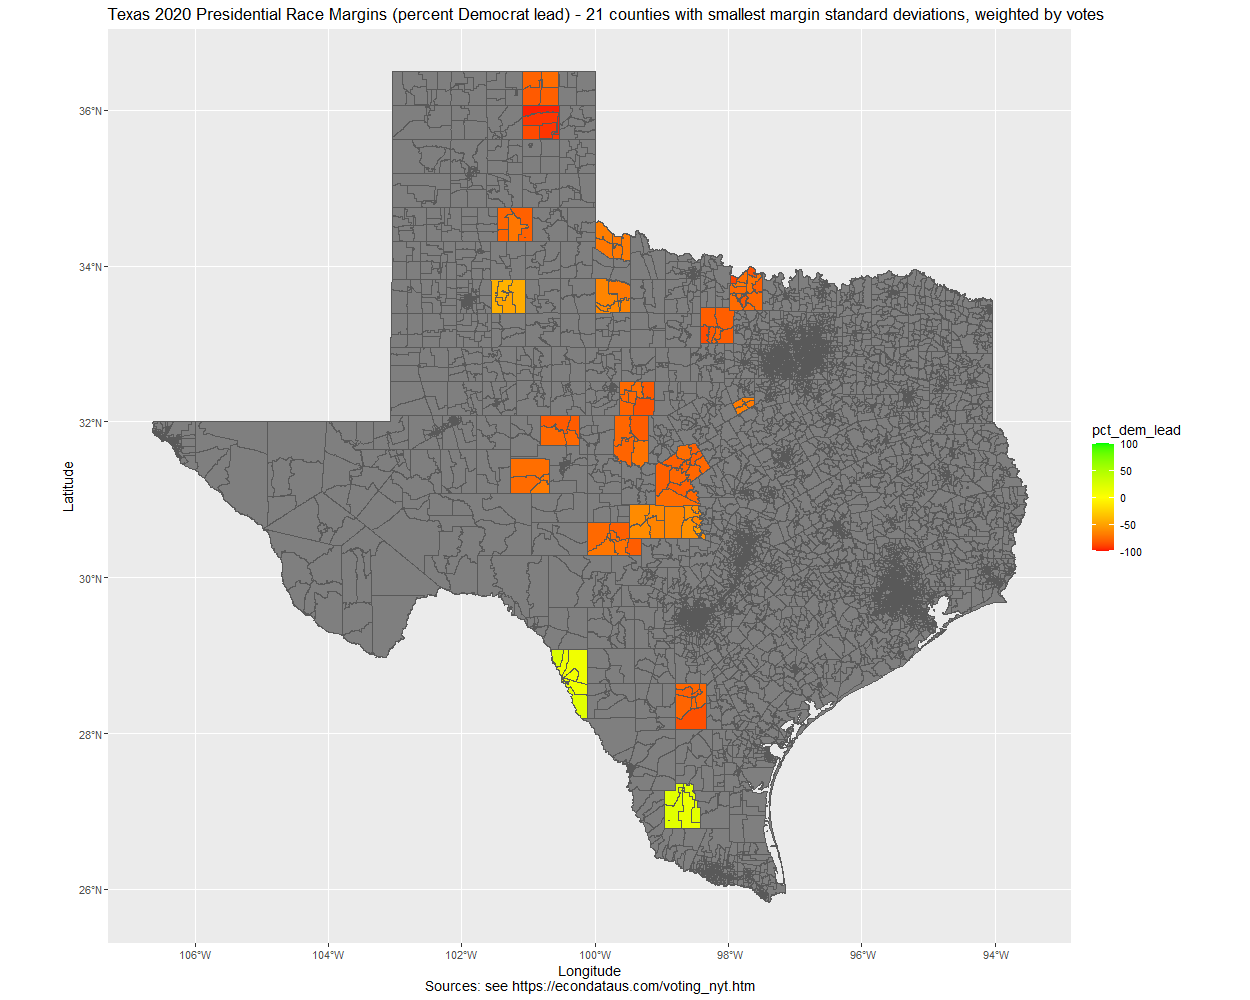
The map contains only those margins which do not overlap each other. The following tables from this link show all of the margins:
Comparing the 2018 Senate and 2020 Presidential Races in Maverick County, TX (percent)
     COUNTY     AREA ORourke  Cruz MARGIN1 TOTAL1 Biden Trump MARGIN2 TOTAL2 DEM_SH REP_SH MAR_SH TOT_SH TOT1_N
1  Maverick  323001A   78.85 20.79   58.06  99.64 54.16 45.59    8.56  99.75 -24.70  24.80 -49.50   0.11    279
2  Maverick  323001B   67.43 31.53   35.90  98.96 53.35 45.43    7.92  98.78 -14.08  13.90 -27.98  -0.17  1,053
3  Maverick  323001C   75.41 23.70   51.71  99.12 54.03 45.05    8.98  99.08 -21.38  21.35 -42.73  -0.03  1,582
4  Maverick  323002A   86.18 13.45   72.73  99.64 55.06 44.71   10.35  99.76 -31.12  31.25 -62.37   0.13    275
5  Maverick 323002BA   73.83 24.30   49.53  98.13 52.73 44.85    7.88  97.58 -21.10  20.55 -41.65  -0.56    107
6  Maverick 323002BB   75.36 24.15   51.21  99.52 53.94 45.74    8.20  99.68 -21.42  21.59 -43.01   0.17    207
7  Maverick 323002BC   75.09 23.82   51.27  98.91 53.94 45.04    8.90  98.98 -21.15  21.22 -42.37   0.06    827
8  Maverick  323002C   77.58 21.29   56.29  98.87 54.40 44.60    9.80  99.01 -23.18  23.31 -46.49   0.13    620
9  Maverick  323002D   54.00 46.00    8.00 100.00 59.65 40.35   19.30 100.00   5.65  -5.65  11.30   0.00     50
10 Maverick  323003A   67.92 31.03   36.88  98.95 54.27 45.05    9.23  99.32 -13.64  14.01 -27.65   0.37  1,334
11 Maverick  323003B   70.12 28.86   41.26  98.98 54.66 44.59   10.07  99.25 -15.47  15.73 -31.19   0.26  1,476
12 Maverick  323003C   48.52 51.05   -2.53  99.58 61.72 38.28   23.44 100.00  13.20 -12.77  25.97   0.42    237
13 Maverick  323004A   73.66 24.55   49.10  98.21 55.41 44.40   11.01  99.81 -18.25  19.85 -38.10   1.60    391
14 Maverick  323004B   65.30 33.96   31.34  99.26 53.99 44.97    9.02  98.97 -11.31  11.01 -22.32  -0.30  1,222
15 Maverick  323004C   72.56 27.44   45.12 100.00 54.63 45.05    9.58  99.69 -17.93  17.61 -35.54  -0.31    430
16 Maverick  323004D   80.03 19.10   60.93  99.13 53.40 45.15    8.25  98.55 -26.63  26.06 -52.68  -0.57    686
17    TOTAL    TOTAL   71.71 27.38   44.32  99.09 54.29 44.84    9.46  99.13 -17.41  17.45 -34.87   0.04 10,776

Comparing the 2018 Senate and 2020 Presidential Races in Maverick County, TX (counts)
     COUNTY     AREA ORourke  Cruz MARGIN1 TOTAL1 Biden Trump MARGIN2 TOTAL2 DEM_SH REP_SH MAR_SH TOT_SH
1  Maverick  323001A     220    58     162    279   215   181      34    397     -5    123   -128    118
2  Maverick  323001B     710   332     378  1,053   613   522      91  1,149    -97    190   -287     96
3  Maverick  323001C   1,193   375     818  1,582 1,240 1,034     206  2,295     47    659   -612    713
4  Maverick  323002A     237    37     200    275   234   190      44    425     -3    153   -156    150
5  Maverick 323002BA      79    26      53    107    87    74      13    165      8     48    -40     58
6  Maverick 323002BB     156    50     106    207   171   145      26    317     15     95    -80    110
7  Maverick 323002BC     621   197     424    827   685   572     113  1,270     64    375   -311    443
8  Maverick  323002C     481   132     349    620   766   628     138  1,408    285    496   -211    788
9  Maverick  323002D      27    23       4     50    34    23      11     57      7      0      7      7
10 Maverick  323003A     906   414     492  1,334   800   664     136  1,474   -106    250   -356    140
11 Maverick  323003B   1,035   426     609  1,476 1,162   948     214  2,126    127    522   -395    650
12 Maverick  323003C     115   121      -6    237   158    98      60    256     43    -23     66     19
13 Maverick  323004A     288    96     192    391   297   238      59    536      9    142   -133    145
14 Maverick  323004B     798   415     383  1,222   784   653     131  1,452    -14    238   -252    230
15 Maverick  323004C     312   118     194    430   348   287      61    637     36    169   -133    207
16 Maverick  323004D     549   131     418    686   738   624     114  1,382    189    493   -304    696
17    TOTAL    TOTAL   7,727 2,951   4,776 10,776 8,332 6,881   1,451 15,346    605  3,930 -3,325  4,570
As can be seen from the tables and map above, the northwest precinct (3C) and the southeast precinct (2D) have outlier margins of 23.44 and 19.3 percent, respectively. However, they have very low vote counts of 237 and 50. As a result, Maverick County's weighted standard deviation of 2.17 is much lower than its regular standard deviation of 4.33. Sorting the counties by their regular standard deviations give the following list:
                  county state  fips       sd      sdW    min   max  votes   n
1               Garfield    MT 30033 1.034408 1.146559  -89.5 -87.1    813   4
2               Hardeman    TX 48197 1.152895 1.202852  -70.2 -67.6   1580   4
3               Franklin    NE 31061 1.625577 1.633956  -68.8 -65.5   1724   4
4              Somervell    TX 48425 1.684241 1.689237  -69.4 -65.6   4957   4
5                  Mason    TX 48319 1.751190 1.794735  -64.4 -60.6   2474   4
6                  Mills    TX 48333 2.311462 2.282328  -80.8 -74.6   2505   7
7               San Saba    TX 48411 2.513866 2.480153  -80.9 -74.2   2602   7
8           Judith Basin    MT 30045 2.767068 2.706815  -59.2 -53.1   1344   4
9                   Coal    OK 40029 2.867103 2.901718  -72.7 -63.6   2524   9
10                  Coke    TX 48081 2.898275 2.895478  -81.8 -76.4   1779   4
11             Ochiltree    TX 48357 2.914904 2.726851  -81.8 -74.8   3159   4
12                Crosby    TX 48107 3.125700 3.138584  -48.1 -41.3   1953   4
13                  Jack    TX 48237 3.135389 2.645874  -87.1 -77.8   3782   6
14                 Scott    TN 47151 3.196682 3.195241  -82.0 -71.3   9052  10
15                 Irion    TX 48235 3.201432 3.130305  -75.3 -68.5    893   4
16                  Knox    TX 48275 3.205412 2.215319  -69.6 -60.3   1456   6
17              McMullen    TX 48311 3.364917 2.909174  -85.7 -77.0    516   6
18               Coleman    TX 48083 3.393671 3.551249  -81.1 -71.8   4129   5
19               Jackson    GA 13157 3.395463 2.909276  -60.4 -52.8  37670   4
20                 Union    TN 47173 3.450765 3.811202  -74.0 -63.1   8123   9
21                Garden    NE 31069 3.469390 3.555675  -74.5 -67.1   1195   4
22               Briscoe    TX 48045 3.523918 3.167582  -79.7 -70.7    725   5
23               Roberts    TX 48393 3.535110 3.388010  -97.1 -87.2    550   5
24                  Polk    TN 47139 3.678919 3.944814  -70.6 -58.6   8360   9
25              Callahan    TX 48059 3.791218 3.927404  -84.7 -73.8   6832   7
26                  Polk    NE 31143 4.029227 4.270104  -66.0 -54.7   2877   6
27                Kimble    TX 48267 4.046398 4.106066  -80.6 -70.5   2292   7
28                Emmons    ND 38029 4.177679 4.159415  -79.6 -69.5   2009   5
29             Hitchcock    NE 31087 4.201091 4.607103  -78.0 -68.9   1469   4
30                Benton    TN 47005 4.227844 4.156192  -61.9 -50.5   7260   6
31            Washington    CO 08121 4.281783 5.140041  -82.2 -70.5   3008   6
32              Maverick    TX 48323 4.333123 2.169386    7.9  23.4  15346  16
As can be seen, Maverick County has moved from number 6 (in the first list above) clear down to number 32.
One item that should be mentioned is that the selection of 4 for the minimum number of precincts does make some difference in the number of top counties from Texas. For minimums of 2, 3, 4, and 5, the number of the top 30 counties that are in Texas are 15, 17, 20, and 16, respectively. Hence, at least half of the counties are in Texas for all those cases.
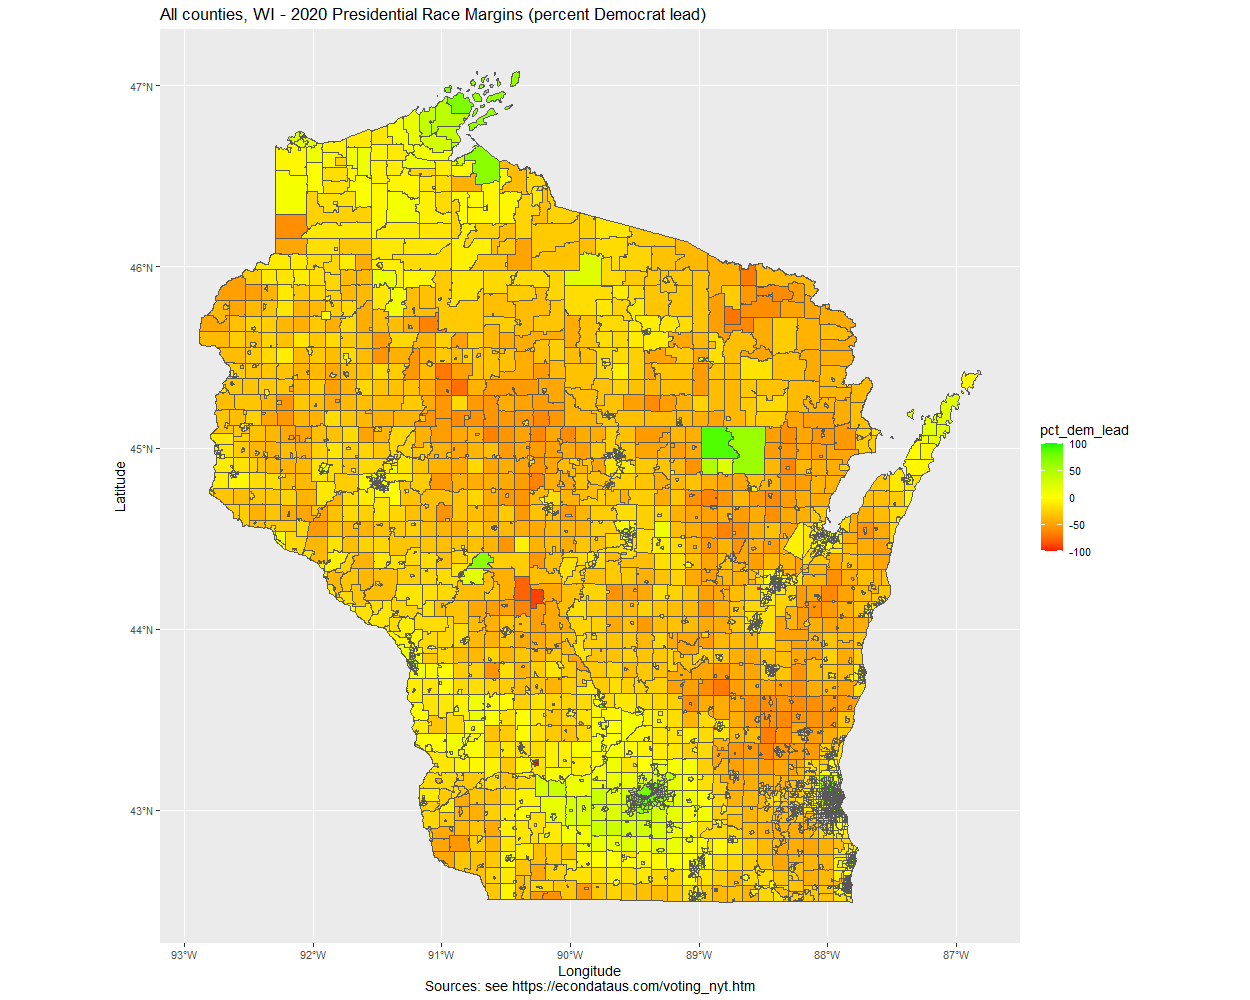
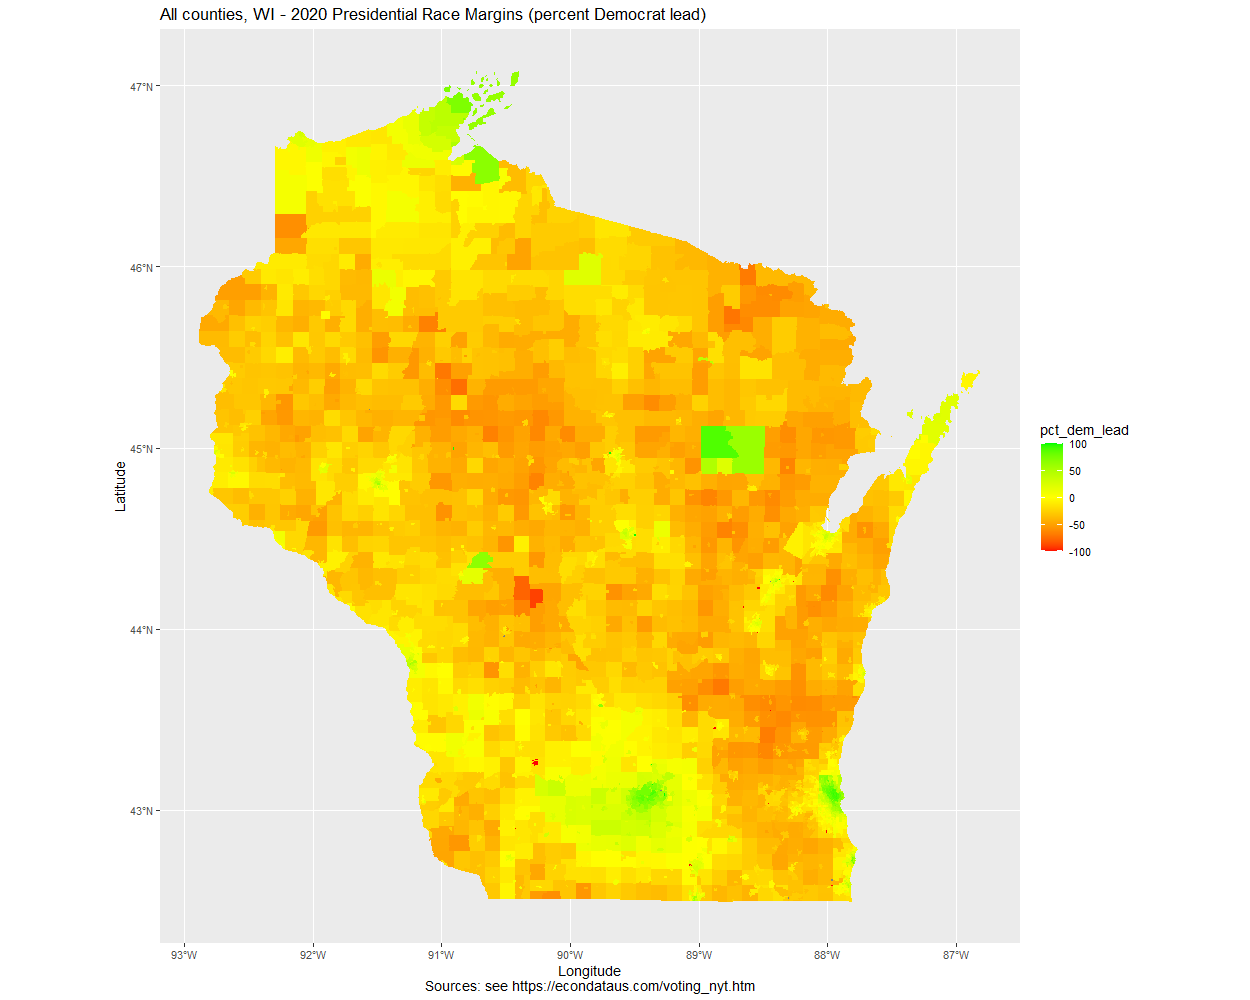
Wisconsin Precinct Maps for the 2020 Presidential Race
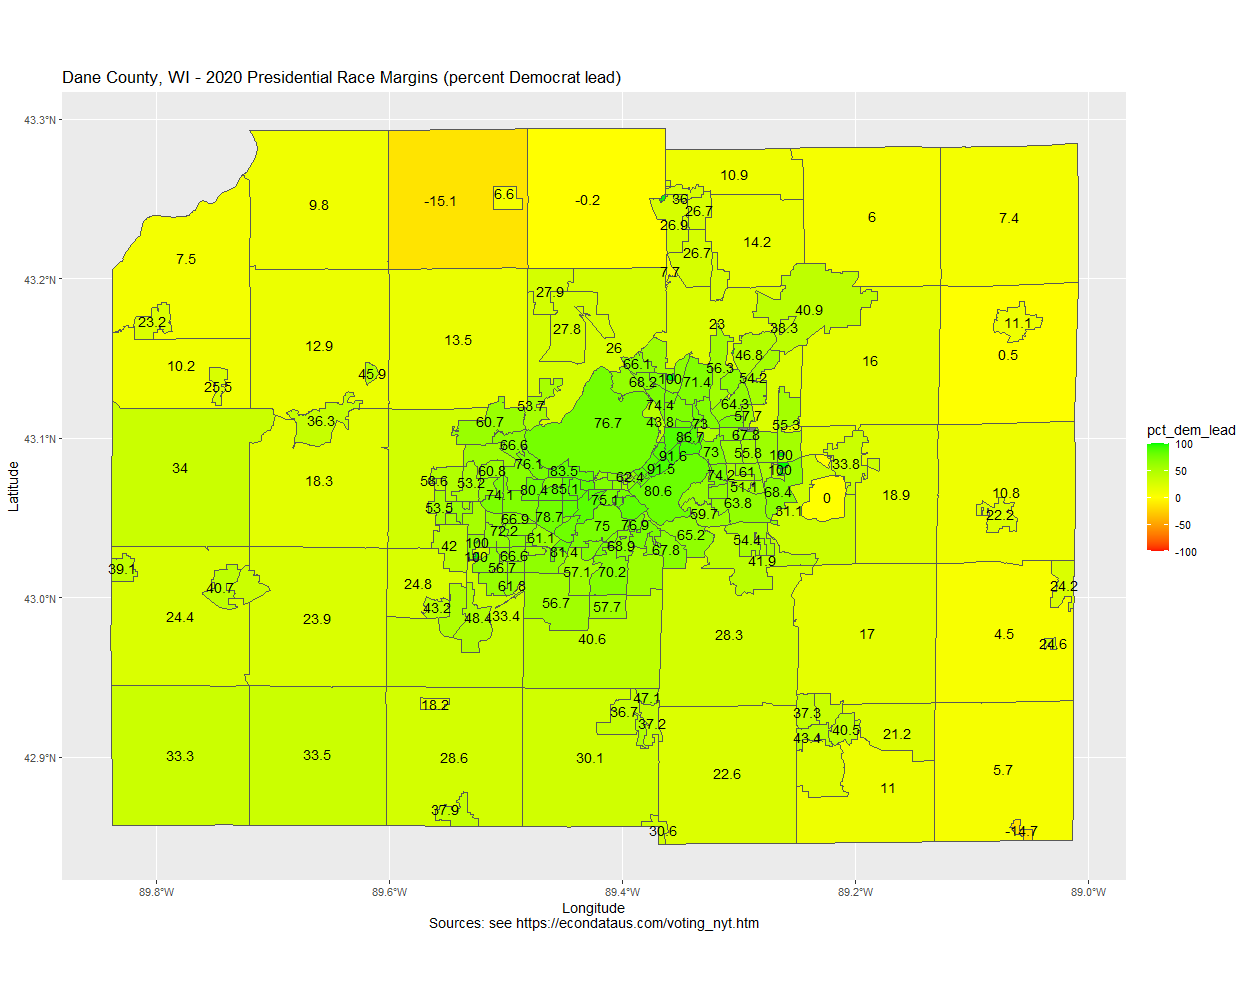
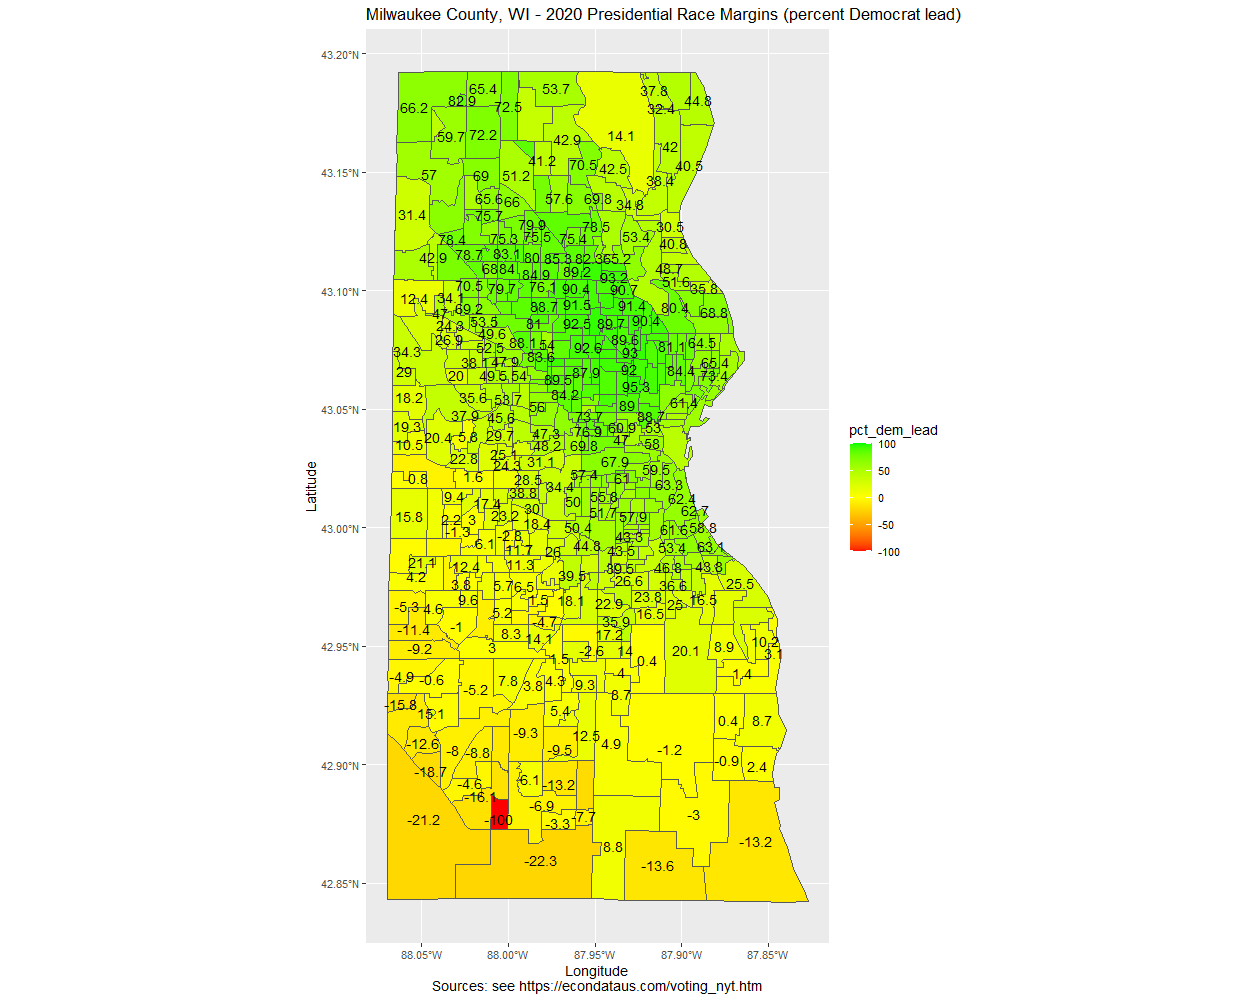
Precinct Data Locations
If anyone should run into any issues or have any suggestions for additional features, feel free to let me know via the Contact box at the bottom of this page.
2020 U.S. Election
Polling Election Data
Comparing Polling and Election Results via R Shiny
Red Shifts for 2020 Election Cycle, November 18, 2020
Precinct Election Data
Analysis of Reported Voting Areas via R Shiny
Precinct Results in Florida through 2020
Precinct Results in Iowa through 2020
Precinct Results in Maine through 2020
Precinct Results in North Carolina through 2020
Precinct Results in South Carolina through 2020
Precinct Results in Texas through 2020
County Election Data
Exploring Federal Election Results by County via R Shiny
County Results in Arizona in 2020
County Results in California in 2020
County Results in Florida in 2020
County Results in Iowa in 2020
County Results in Kentucky in 2020
County Results in Maine in 2020
County Results in Montana in 2020
County Results in Pennsylvania in 2020
County Results in South Carolina in 2020
County Results in Texas in 2020