Comparing the 2016 Presidential and 2018 Gubernatorial Races in Miami-Dade County
On July 27, 2020, FiveThirtyEight posted an article online titled "Why Florida Could Go Blue In 2020". In the second paragraph, it mentions the "blue wave" of 2018 and states:
Although the national political environment leaned almost 9 percentage points in Democrats' favor, Republican Rick Scott defeated incumbent Democratic Sen. Bill Nelson by 0.1 points, and Republican Ron DeSantis defeated Democrat Andrew Gillum by 0.4 points in the open-seat race for governor.
Further on, the article states:
Ultimately, Scott (and DeSantis) won because they did significantly better than Trump in a handful of big counties, virtually erasing Democratic gains elsewhere. Most glaringly, Miami-Dade County - Florida’s most populated county - and Osceola County voted more than 8 points more Republican in the 2018 Senate race than in the 2016 presidential race. In addition, Nelson underperformed Clinton by 6 points in the much less populous Hendry County.
The article goes on to explain that these are Florida’s three majority-Hispanic counties and discusses how this may have affected the results. However, it then includes the following graph:

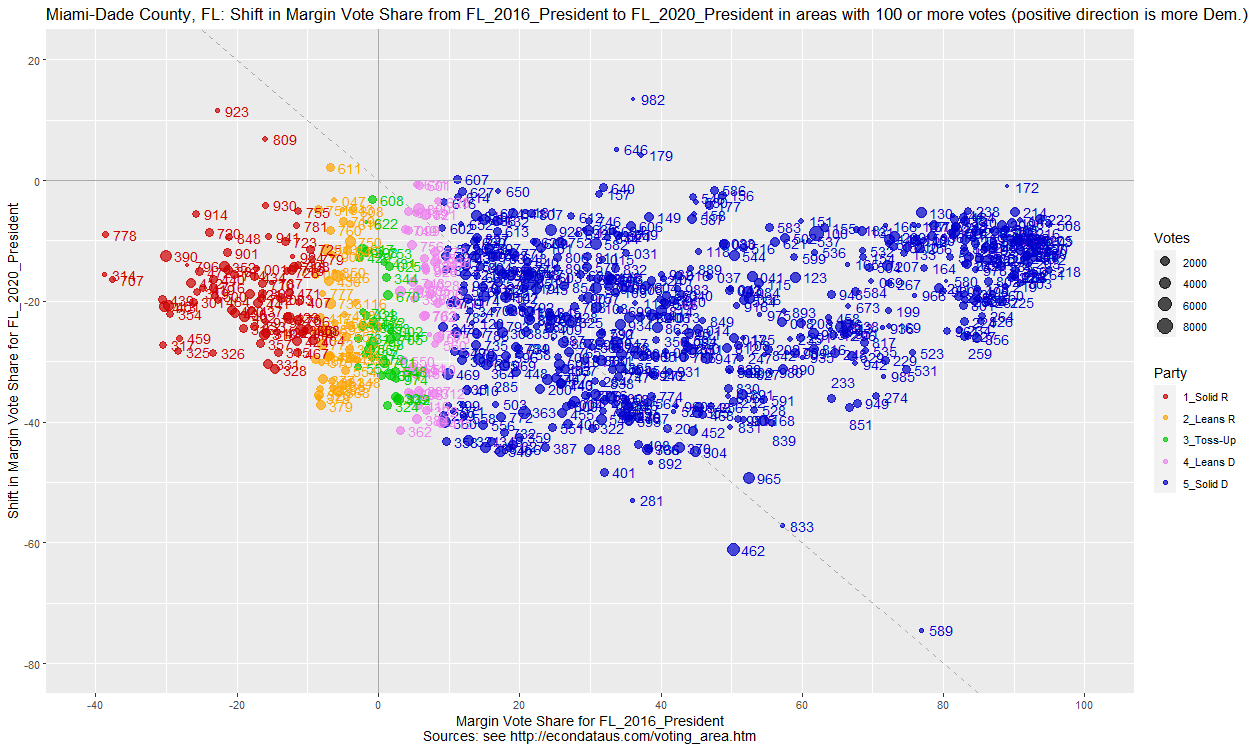
The graph shows that Miami-Dade has tended to vote more Republican in mid-year elections but that both its Presidential and Gubernatorial election results have been trending more Democratic since 2002. A comparison of precinct results in the 2016 Presidential and 2018 Gubernatorial elections can be seen in the following plot:
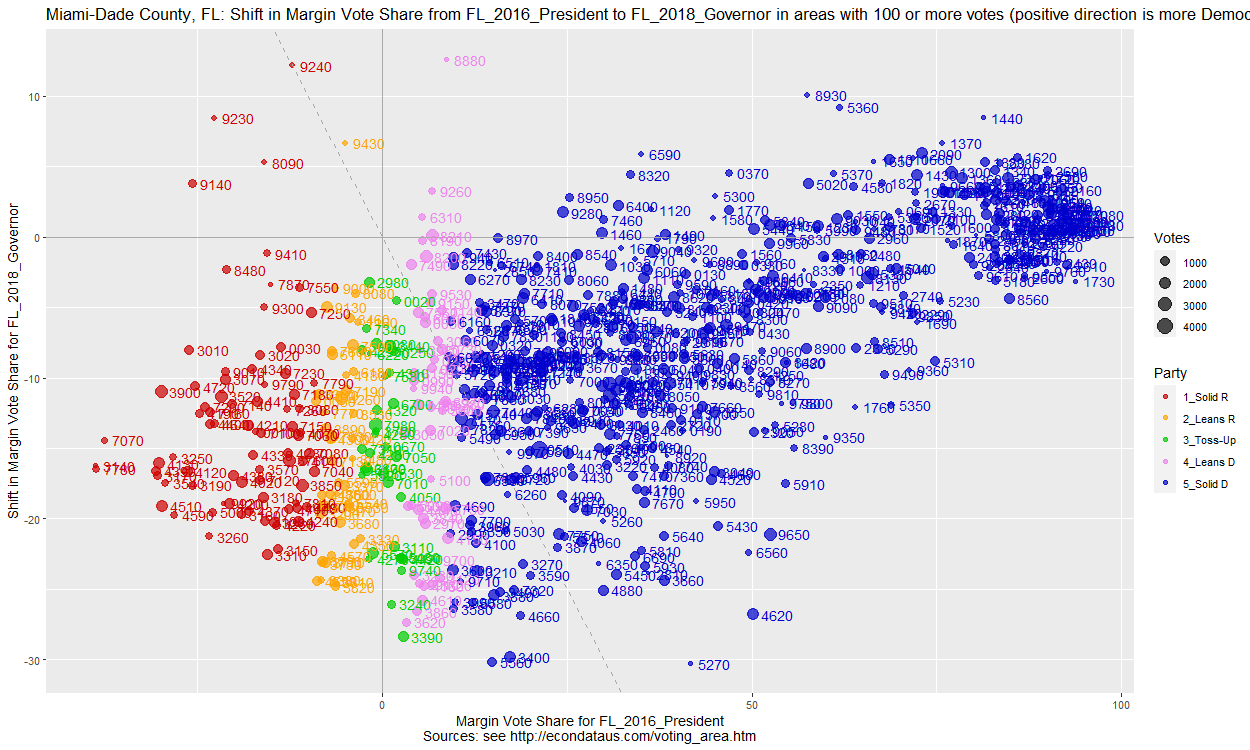
This plot was obtained by going to the R Shiny app at this link, entering FL for STATE, selecting "FL_2016_President,FL_2018_Governor" for RACE, selecting Miami_Dade for COUNTY, setting "Min Votes" to 100, clicking on the "Area Plot2" tab, and selecting "Area" for "Label type" on that tab's input panel. The fact that the plot's title is truncated can be fixed by setting the "Add to title" field on that panel to something shorter to replace the comment in parens, like "(positive direction is more Dem.)".
The plot shows that the solid Republican precincts red-shifted (became more Republican) an average of about 15 percent from 2016 to 2018. The red-shift in the solid Democrat precincts ranged from an average of about 15 percent at the left end (9% margin) to no shift at all at the right end (approaching 100% margin). Clicking on the Areas2 tab shows the comparisons for each precinct. Below are the header and last 20 lines output:
Miami-Dade County, FL: Shift in Margin Vote Share from FL_2016_President to FL_2018_Governor (Percent)

        COUNTY  AREA Clinton Trump MARGIN1 TOTAL1 Gillum DeSantis MARGIN2 TOTAL2 DEM_SH REP_SH MAR_SH TOT_SH  TOT1_N  TOT2_N
695 Miami-Dade  9740   50.75 48.25    2.50  99.00  38.71    59.84  -21.14  98.55 -12.05  11.59 -23.64  -0.45     999     757
696 Miami-Dade  9750   75.66 21.68   53.98  97.35  69.36    27.17   42.20  96.53  -6.30   5.49 -11.79  -0.81     226     173
697 Miami-Dade  9760   94.72  4.88   89.84  99.59  92.22     4.79   87.43  97.01  -2.50  -0.09  -2.41  -2.59     246     167
698 Miami-Dade  9780   91.76  7.30   84.46  99.05  92.63     7.22   85.41  99.85   0.87  -0.08   0.95   0.79     740     651
699 Miami-Dade  9790   41.09 57.09  -16.00  98.18  36.30    62.74  -26.44  99.04  -4.79   5.65 -10.44   0.86     550     416
700 Miami-Dade  9800   77.43 21.85   55.58  99.29  69.52    25.68   43.84  95.21  -7.91   3.83 -11.75  -4.08     421     292
701 Miami-Dade  9810   74.88 23.87   51.01  98.75  69.06    29.19   39.87  98.25  -5.82   5.32 -11.14  -0.50   1,039     627
702 Miami-Dade  9830   70.34 27.97   42.37  98.31  66.07    33.42   32.65  99.49  -4.27   5.45  -9.73   1.18     472     389
703 Miami-Dade  9840   74.94 22.50   52.44  97.44  76.43    23.13   53.30  99.56   1.49   0.63   0.87   2.12   2,031   1,816
704 Miami-Dade  9850   84.76 13.33   71.43  98.10  82.91    17.09   65.82 100.00  -1.85   3.76  -5.61   1.90     210     158
705 Miami-Dade  9870   61.90 37.14   24.76  99.05  50.60    44.58    6.02  95.18 -11.30   7.44 -18.74  -3.87     105      83
706 Miami-Dade  9910   51.49 46.45    5.04  97.94  39.41    58.96  -19.55  98.36 -12.08  12.51 -24.59   0.42   1,309     977
707 Miami-Dade  9920   38.52 60.00  -21.48  98.52  28.44    68.81  -40.37  97.25 -10.08   8.81 -18.89  -1.27     135     109
708 Miami-Dade  9930   64.13 33.15   30.98  97.28  61.18    38.82   22.37 100.00  -2.95   5.66  -8.61   2.72     184     152
709 Miami-Dade  9940   50.92 46.73    4.19  97.65  45.89    52.42   -6.53  98.32  -5.03   5.69 -10.71   0.66     597     475
710 Miami-Dade  9950   70.54 27.16   43.38  97.70  68.01    31.45   36.56  99.46  -2.53   4.29  -6.82   1.75   2,047   1,838
711 Miami-Dade  9960   74.62 22.31   52.31  96.92  75.87    23.98   51.90  99.85   1.26   1.67  -0.41   2.93   1,170   1,343
712 Miami-Dade  9970   57.76 40.59   17.16  98.35  48.37    46.51    1.86  94.88  -9.38   5.92 -15.30  -3.47     303     215
713 Miami-Dade  9990   73.66 23.05   50.62  96.71  73.37    26.63   46.73 100.00  -0.30   3.59  -3.88   3.29     243     199
714      TOTAL TOTAL   64.07 34.28   29.78  98.35  60.02    39.05   20.97  99.07  -4.05   4.77  -8.82   0.72 974,219 798,426
The totals in the last row show that the Democrat margins in 2016 and 2018 were about 30 and 21 percent, matching the graph from the article above.
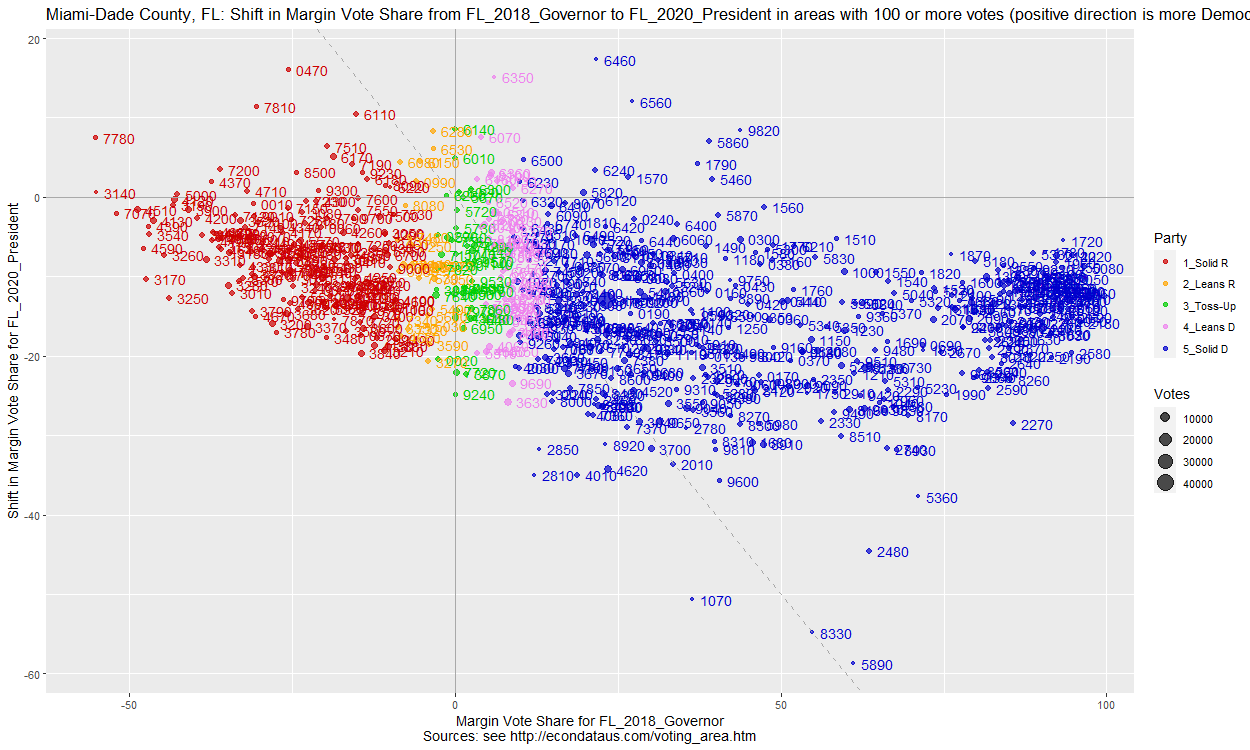
Selecting "FL_2018_Governor,FL_2020_President" for RACE and clicking on the "Area Plot2" tab will now display the following plot:
The fact that the great majority of precincts are below the x-axis indicates that they red-shifted from 2018 to 2020. In fact, the plot shows that the solid Democratic precincts red-shifted an average of 15 percent or more as compared to solid Republican precincts which appear to have shifted an average of 10 percent or less. Also, the legend shows that there is at least one precinct with about 40,000 votes. Clicking on the Areas tab and setting the "Areas2 (col)" input to 16 will sort the precincts by the number of votes in 2020. Below are the header and last 20 lines output.
The last line shows that the vote margin shrank from about 21 percent in 2018 to just about 7 percent in 2020. Hence, the Presidential vote margin in Miami shrank clear back to where it appeared to have been in 2000 and 2004 according to the graph from the article above!
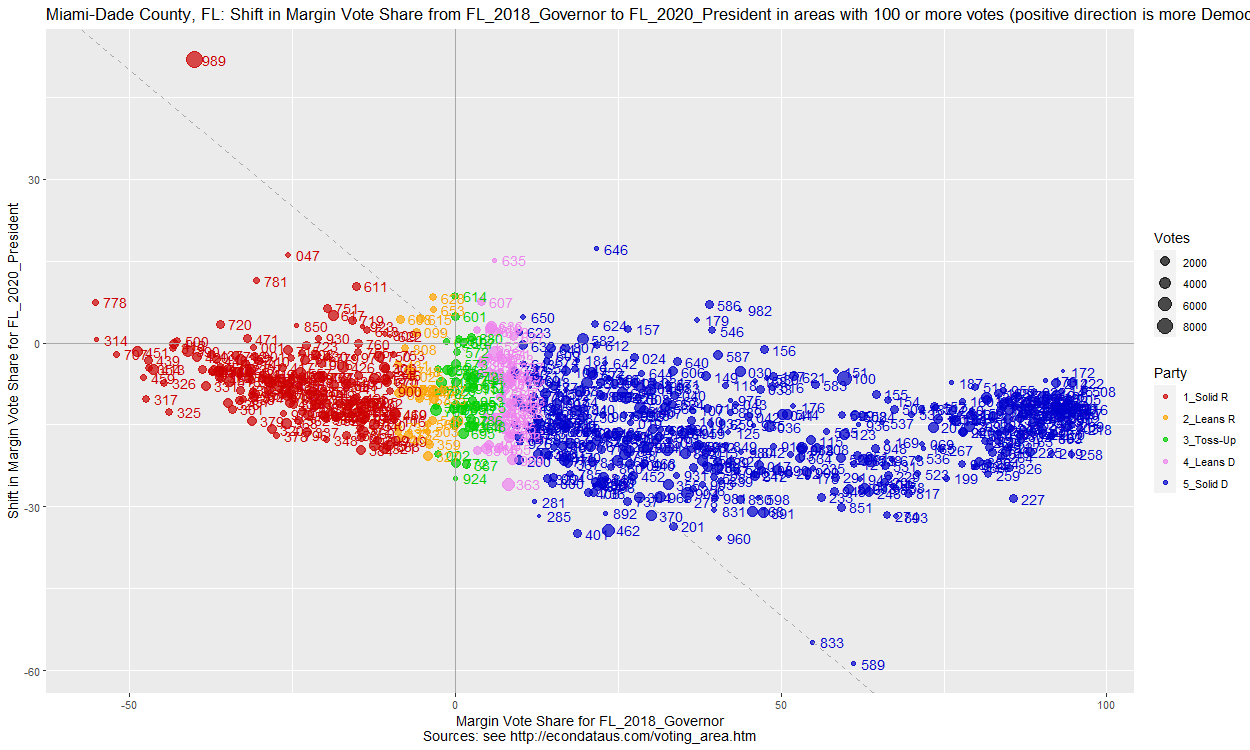
In any event, the precincts that are contained in this "Other" precinct can be seen by setting the "Areas2 (col)" input back to zero and unchecking the "Show Other Areas" checkbox. Below are the last 29 lines that will now appear on the Areas2 tab.
As can be seen, the plot has the same general shape as before. In addition, a precinct labeled 989 now appears in the upper left. A list of Precincts of Miami-Dade County indicates that Precinct 989 is HUD, located at 1407 NW 7 St, Miami, FL 33125. In any event, the data on the Areas2 tab shows that this precinct includes just 8,880 votes. Sorting by votes shows that this is now the largest precinct in Miami-Dade, followed by Precinct 051 which includes 6,493 votes. This is far less than the 42,364 votes that were previously included in the "Other" precinct. Following are the last 20 lines that now appear on the Areas2 tab.
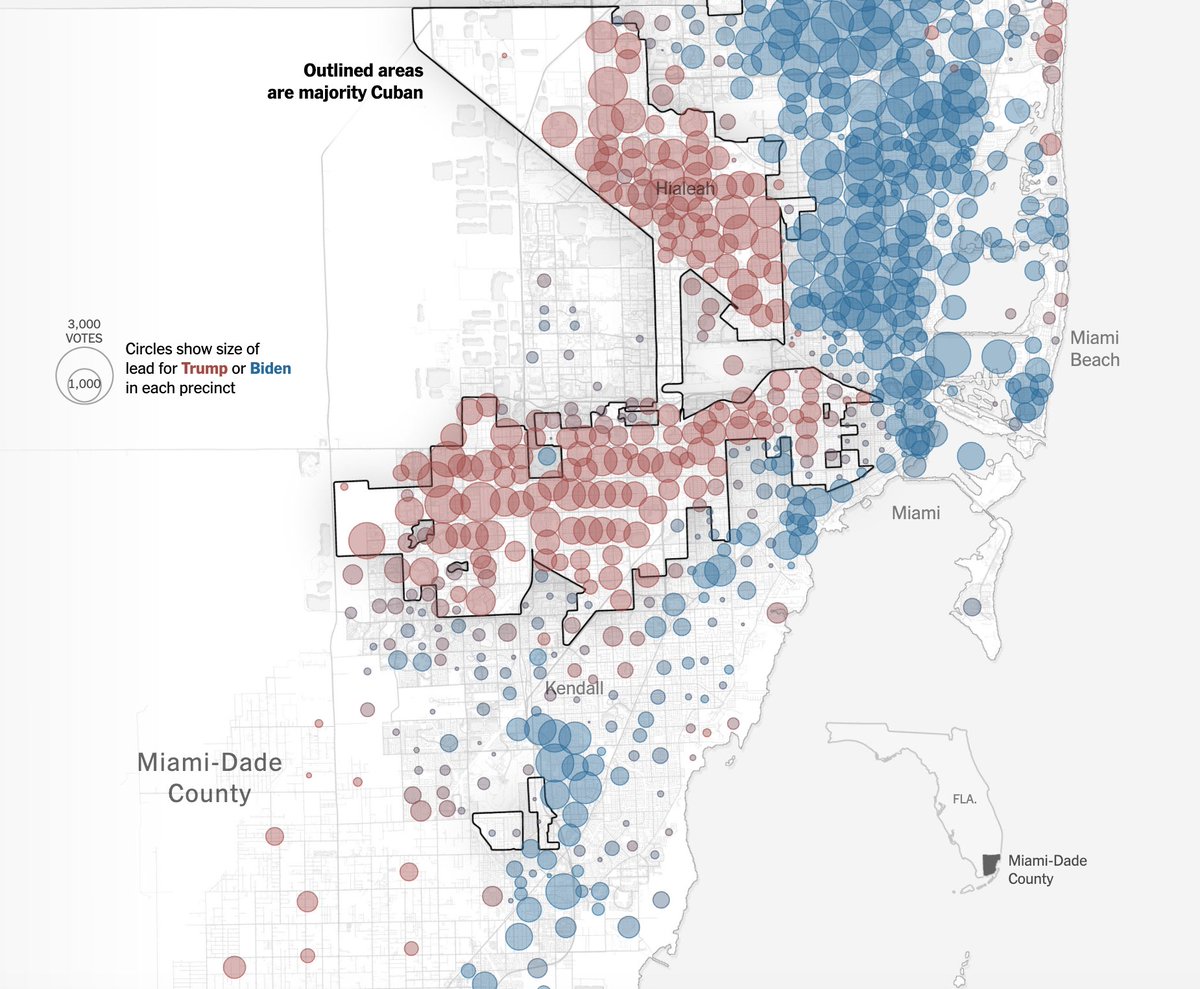
The tweet at this link points to a New York Times article that contains the following graphic:
I haven't read the article since it's behind a paywall but the graphics does seem to suggest that the Cuban vote in Miami played a role in Trump's victory there. The first plot above which compares Miami vote margins in the 2016 Presidential and 2018 Gubernatorial races does show a stronger red shift in the strong Republican precincts. But the last plot above shows that the major change since 2018 has been in the Democratic precincts.
Having looked at the change from 2016 to 2018 and from 2018 to 2020, it may be useful to look at the total change between the Presidential races of 2016 and 2020. The plot below was generated via the following inputs:
Following is the data from the Areas2 tab for several of the precincts visible near the bottom of the plot:
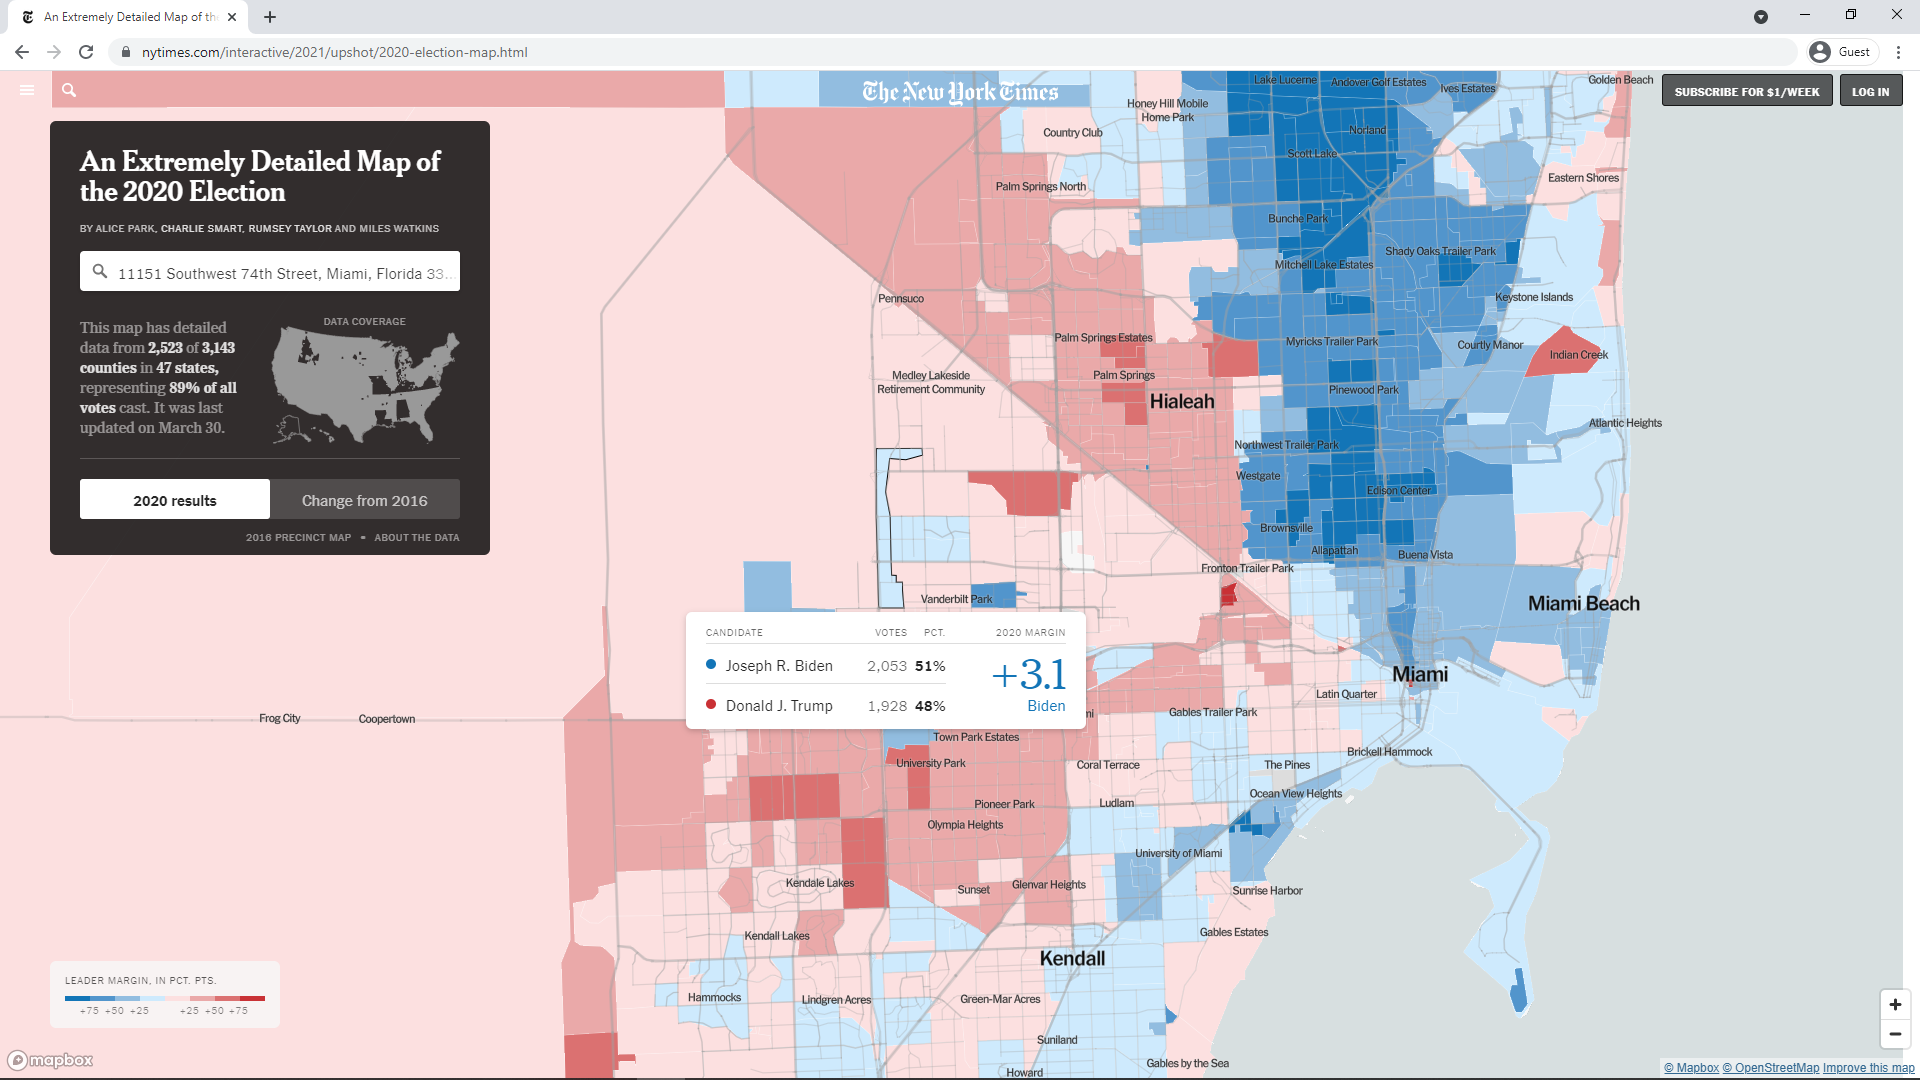
As can be seen, the votes and percentages in the popup match those for Biden and Trump.1 in the last line of the two tables above. The precinct is light blue since it voted 51% to 48% in favor of Biden and appears to be located between but outside of the two main majority Cuban areas outlined in prior New York Times graphic. Clicking the "Change from 2016" button displays a popup that says that the vote margin became 48 percent more Republican from 2016 to 2020 in that precinct. That's very close to the 49 percent shown in the first table above.
The other main county mentioned in the FiveThirtyEight article above was Osceola County. The following plot shows the change in the vote margins between the 2018 Gubernatorial and the 2020 Presidential races in Osceola. It was generated via the following inputs:
It's possible to view the turnout in the 2020 Presidential race in Osceola County via the following inputs:
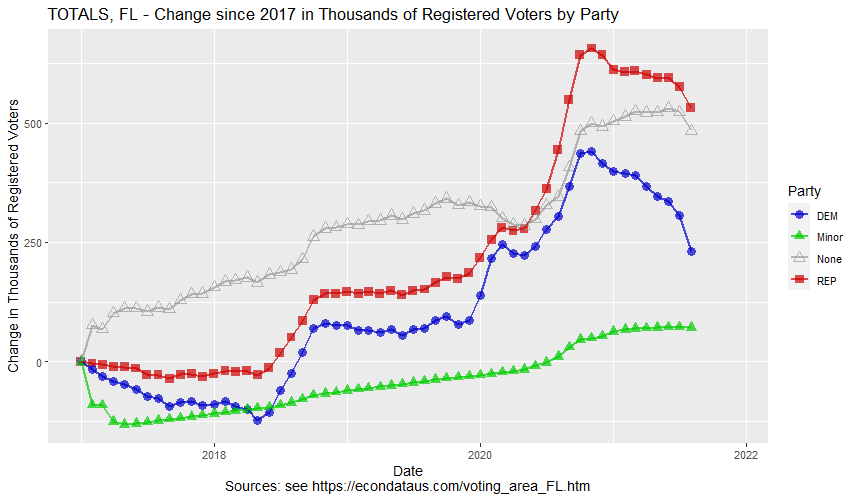
The following plot shows the change in registered Democrats and Republicans in Florida since 2017. The numbers dropped 167,782 for Democrats and 80,757 for Republicans from January to August, 2021. In fact, 74,451 of the drop for Democrats, over 44% of the total drop since January, occurred in August alone.
Comparing the 2018 Gubernatorial and the 2020 Presidential Races in Miami-Dade County
Miami-Dade County, FL: Shift in Margin Vote Share from FL_2018_Governor to FL_2020_President (Percent)

        COUNTY  AREA Gillum DeSantis MARGIN1 TOTAL1 Biden Trump MARGIN2 TOTAL2 DEM_SH REP_SH MAR_SH TOT_SH  TOT1_N    TOT2_N
600 Miami-Dade  8130  81.07    18.36   62.72  99.43 70.54 29.28   41.26  99.81 -10.54  10.92 -21.45   0.38   2,457     3,228
265 Miami-Dade  3710  53.98    45.21    8.77  99.19 48.59 51.32   -2.73  99.91  -5.39   6.11 -11.49   0.72   2,338     3,229
275 Miami-Dade  3850  35.45    63.90  -28.45  99.35 32.12 67.70  -35.58  99.81  -3.33   3.79  -7.13   0.46   2,169     3,241
268 Miami-Dade  3760  35.40    63.88  -28.48  99.28 32.18 67.67  -35.49  99.85  -3.22   3.79  -7.01   0.57   2,223     3,263
280 Miami-Dade  3900  29.28    70.22  -40.94  99.51 28.66 71.13  -42.47  99.79  -0.62   0.91  -1.53   0.28   2,230     3,308
670 Miami-Dade  9280  62.84    36.58   26.26  99.42 58.00 41.81   16.19  99.82  -4.84   5.24 -10.08   0.40   2,056     3,317
345 Miami-Dade  4690  44.98    54.20   -9.22  99.18 38.70 60.91  -22.21  99.61  -6.28   6.71 -12.99   0.43   2,083     3,354
537 Miami-Dade  7440  50.93    48.33    2.59  99.26 47.82 51.98   -4.16  99.79  -3.11   3.64  -6.75   0.53   2,429     3,365
256 Miami-Dade  3600  42.22    56.31  -14.09  98.52 34.65 65.20  -30.55  99.85  -7.57   8.90 -16.46   1.33   2,030     3,414
425 Miami-Dade  5820  59.56    39.96   19.60  99.52 60.11 39.86   20.25  99.97   0.55  -0.10   0.65   0.45   2,725     3,462
43  Miami-Dade  1020  54.51    45.06    9.45  99.57 49.31 50.50   -1.19  99.80  -5.20   5.44 -10.64   0.23   2,328     3,529
628 Miami-Dade  8470  62.91    36.27   26.65  99.18 53.33 46.45    6.88  99.78  -9.59  10.18 -19.77   0.60   2,443     3,621
388 Miami-Dade  5410  63.95    35.51   28.44  99.46 58.20 41.69   16.51  99.89  -5.75   6.18 -11.93   0.43   2,416     3,780
412 Miami-Dade  5690  59.88    39.55   20.33  99.43 56.42 43.47   12.95  99.90  -3.46   3.92  -7.38   0.46   2,809     3,823
652 Miami-Dade  9040  67.23    31.63   35.59  98.86 54.47 45.43    9.04  99.90 -12.76  13.79 -26.55   1.03   2,197     3,837
681 Miami-Dade  9470  69.64    29.35   40.28  98.99 58.47 41.35   17.13  99.82 -11.16  12.00 -23.16   0.83   2,177     3,889
557 Miami-Dade  7640  48.12    50.97   -2.85  99.09 42.30 57.53  -15.23  99.82  -5.82   6.56 -12.38   0.74   2,629     3,986
692 Miami-Dade  9650  65.47    34.07   31.40  99.54 51.47 48.33    3.13  99.80 -14.00  14.27 -28.27   0.26   2,592     3,989
586 Miami-Dade  7980  42.57    56.71  -14.13  99.28 35.95 63.78  -27.83  99.73  -6.62   7.07 -13.69   0.44   2,781     4,370
339 Miami-Dade  4620  61.53    38.12   23.42  99.65 44.46 55.35  -10.89  99.82 -17.07  17.24 -34.31   0.17   2,007     4,390
387 Miami-Dade  5380  81.86    18.10   63.76  99.96 71.06 28.76   42.30  99.82 -10.80  10.66 -21.46  -0.14   2,475     4,506
258 Miami-Dade  3630  53.44    45.36    8.08  98.79 41.06 58.79  -17.74  99.85 -12.38  13.44 -25.82   1.06   2,154     4,713
37  Miami-Dade  0510  52.98    46.76    6.22  99.74 52.12 47.76    4.36  99.88  -0.86   1.00  -1.86   0.14   4,615     6,493
710 Miami-Dade Other  61.15    37.91   23.25  99.06 55.05 44.74   10.31  99.79  -6.10   6.84 -12.94   0.73   5,308    42,364
711      TOTAL TOTAL  60.02    39.05   20.97  99.07 53.59 46.22    7.38  99.81  -6.42   7.17 -13.59   0.74 798,426 1,152,881
The second to the last line shows that there is one large precinct labeled as "Other". It contains all precincts from either race which could not be matched and includes 42,364 votes. The large dot for this precinct can be seen at (20.97, -13.59) on the plot. The next largest precinct includes just 6,493 votes.
Miami-Dade County, FL: Shift in Margin Vote Share from FL_2018_Governor to FL_2020_President (Percent)

        COUNTY  AREA Gillum DeSantis MARGIN1 TOTAL1  Biden  Trump MARGIN2 TOTAL2 DEM_SH REP_SH MAR_SH TOT_SH  TOT1_N    TOT2_N
781 Miami-Dade  9800  69.52    25.68   43.84  95.21  61.92  38.08   23.83 100.00  -7.60  12.40 -20.00   4.79     292       428
782 Miami-Dade  9810  69.06    29.19   39.87  98.25  53.95  45.81    8.14  99.77 -15.11  16.63 -31.73   1.52     627       860
783 Miami-Dade  9811     NA       NA      NA     NA  60.57  39.07   21.51  99.64     NA     NA     NA     NA      NA       279
784 Miami-Dade  9820  71.26    27.59   43.68  98.85  75.71  23.57   52.14  99.29   4.45  -4.01   8.46   0.44      87       140
785 Miami-Dade  9821     NA       NA      NA     NA  55.56  44.44   11.11 100.00     NA     NA     NA     NA      NA         9
786 Miami-Dade  9830  66.07    33.42   32.65  99.49  62.07  37.59   24.48  99.66  -4.00   4.17  -8.17   0.17     389       580
787 Miami-Dade  9840  76.43    23.13   53.30  99.56  66.90  32.99   33.92  99.89  -9.53   9.86 -19.39   0.33   1,816     2,807
788 Miami-Dade  9841     NA       NA      NA     NA  66.97  32.79   34.18  99.77     NA     NA     NA     NA      NA       433
789 Miami-Dade  9850  82.91    17.09   65.82 100.00  69.52  30.48   39.03 100.00 -13.39  13.39 -26.79   0.00     158       269
790 Miami-Dade  9871     NA       NA      NA     NA  49.60  50.40   -0.80 100.00     NA     NA     NA     NA      NA       125
791 Miami-Dade  9891     NA       NA      NA     NA    NaN    NaN     NaN    NaN    NaN    NaN    NaN    NaN      NA         0
792 Miami-Dade  9892     NA       NA      NA     NA  36.42  63.46  -27.05  99.88     NA     NA     NA     NA      NA       843
793 Miami-Dade  9893     NA       NA      NA     NA  36.95  62.90  -25.94  99.85     NA     NA     NA     NA      NA       663
794 Miami-Dade  9894     NA       NA      NA     NA  26.81  72.46  -45.65  99.28     NA     NA     NA     NA      NA       138
795 Miami-Dade  9895     NA       NA      NA     NA  56.12  43.37   12.76  99.49     NA     NA     NA     NA      NA       196
796 Miami-Dade  9896     NA       NA      NA     NA  43.52  56.34  -12.82  99.86     NA     NA     NA     NA      NA       710
797 Miami-Dade  9897     NA       NA      NA     NA  60.86  39.11   21.75  99.97     NA     NA     NA     NA      NA     3,636
798 Miami-Dade  9898     NA       NA      NA     NA  68.45  31.42   37.04  99.87     NA     NA     NA     NA      NA     2,330
799 Miami-Dade  9899     NA       NA      NA     NA  41.33  58.67  -17.34 100.00     NA     NA     NA     NA      NA       346
800 Miami-Dade  9900    NaN      NaN     NaN    NaN  66.67  33.02   33.65  99.69    NaN    NaN    NaN    NaN       0       318
801 Miami-Dade  9910  39.41    58.96  -19.55  98.36     NA     NA      NA     NA     NA     NA     NA     NA     977        NA
802 Miami-Dade  9920  28.44    68.81  -40.37  97.25     NA     NA      NA     NA     NA     NA     NA     NA     109        NA
803 Miami-Dade  9930  61.18    38.82   22.37 100.00     NA     NA      NA     NA     NA     NA     NA     NA     152        NA
804 Miami-Dade  9940  45.89    52.42   -6.53  98.32     NA     NA      NA     NA     NA     NA     NA     NA     475        NA
805 Miami-Dade  9950  68.01    31.45   36.56  99.46     NA     NA      NA     NA     NA     NA     NA     NA   1,838        NA
806 Miami-Dade  9960  75.87    23.98   51.90  99.85     NA     NA      NA     NA     NA     NA     NA     NA   1,343        NA
807 Miami-Dade  9970  48.37    46.51    1.86  94.88     NA     NA      NA     NA     NA     NA     NA     NA     215        NA
808 Miami-Dade  9990  73.37    26.63   46.73 100.00     NA     NA      NA     NA     NA     NA     NA     NA     199        NA
809      TOTAL TOTAL  60.02    39.05   20.97  99.07  53.59  46.22    7.38  99.81  -6.42   7.17 -13.59   0.74 798,426 1,152,881
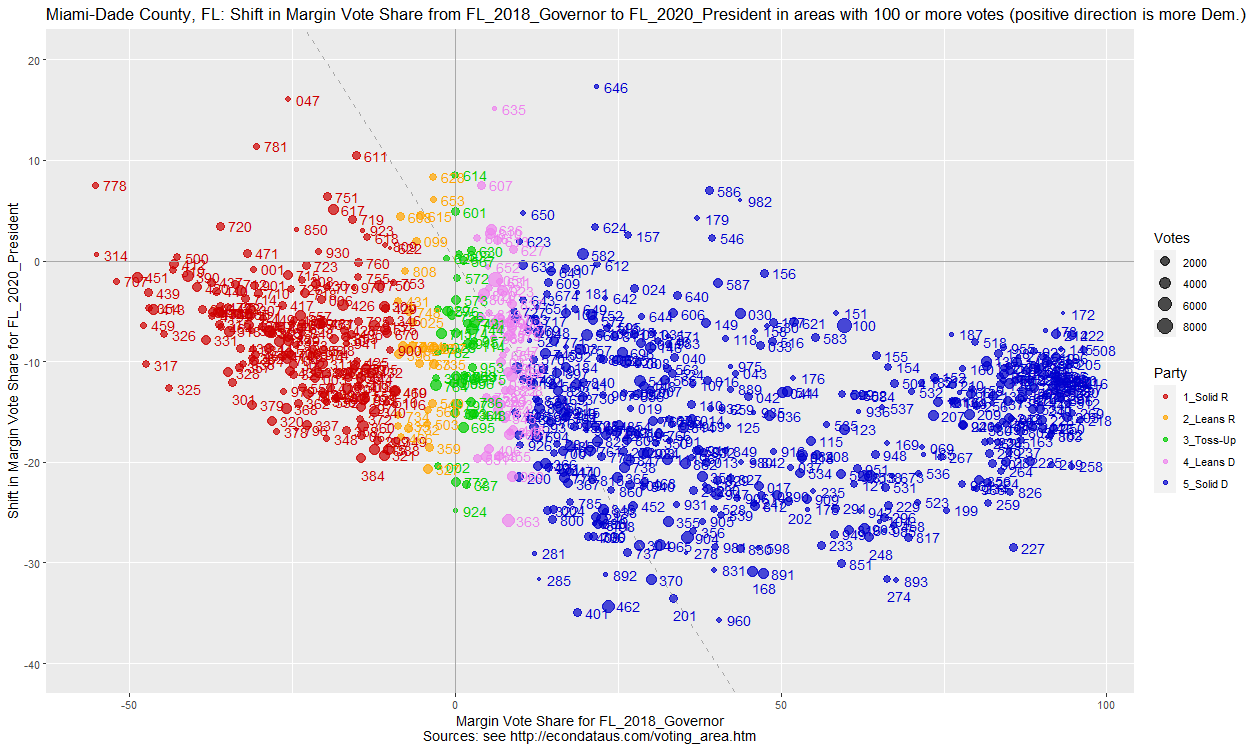
All of the precincts that have NAs in columns Gillum through TOTAL1 or columns Biden through TOTAL2 are non-matching precincts and their totals will be added into the "Other" precinct. The NaNs (not a number) for AREA 9900 are caused the fact that TOT1_N (total votes in 2018) was zero and those precincts are NOT included in the "Other" precinct. In any case, note that all of the AREAs for 2018 (and for 2016 above) ended in zero. In fact, the precinct IDs had a digit added in 2020 and this program added a zero to prior years to facilitate matching. It appears that the digit was added to allow precincts to expand to multiple locations. These multiple locations can be combined back into a single entry by setting the field "AREA modify" to "-.$" (without the quotes). Currently, "AREA modify" has just one operation signified by the leading minus sign. The characters following the minus (.$) give a regex of characters to be removed. The .$ signifies that the last character is to removed from AREA. Then, the data is regrouped by COUNTY and AREA. In addition to setting "AREA modify" to "-.$", the "Show Other Areas" should be rechecked. Doing both of these causes the following plot on tab "Area Plot2" to be output:
Miami-Dade County, FL: Shift in Margin Vote Share from FL_2018_Governor to FL_2020_President (Percent) - last 20 lines

        COUNTY  AREA Gillum DeSantis MARGIN1 TOTAL1 Biden Trump MARGIN2 TOTAL2 DEM_SH REP_SH MAR_SH TOT_SH  TOT1_N    TOT2_N
702 Miami-Dade   978  92.63     7.22   85.41  99.85 84.62 14.89   69.73  99.52  -8.00   7.67 -15.67  -0.33     651       826
703 Miami-Dade   979  36.30    62.74  -26.44  99.04 30.25 69.61  -39.36  99.87  -6.04   6.87 -12.92   0.83     416       747
704 Miami-Dade   980  69.52    25.68   43.84  95.21 61.92 38.08   23.83 100.00  -7.60  12.40 -20.00   4.79     292       428
705 Miami-Dade   981  69.06    29.19   39.87  98.25 55.58 44.16   11.41  99.74 -13.48  14.97 -28.46   1.49     627     1,139
706 Miami-Dade   982  71.26    27.59   43.68  98.85 74.50 24.83   49.66  99.33   3.23  -2.75   5.99   0.48      87       149
707 Miami-Dade   983  66.07    33.42   32.65  99.49 62.07 37.59   24.48  99.66  -4.00   4.17  -8.17   0.17     389       580
708 Miami-Dade   984  76.43    23.13   53.30  99.56 66.91 32.96   33.95  99.88  -9.52   9.84 -19.35   0.32   1,816     3,240
709 Miami-Dade   985  82.91    17.09   65.82 100.00 69.52 30.48   39.03 100.00 -13.39  13.39 -26.79   0.00     158       269
710 Miami-Dade   987  50.60    44.58    6.02  95.18 49.21 50.79   -1.59 100.00  -1.40   6.22  -7.61   4.82      83       126
711 Miami-Dade   989  30.00    70.00  -40.00 100.00 55.89 44.01   11.88  99.90  25.89 -25.99  51.88  -0.10      10     8,880
712 Miami-Dade   990    NaN      NaN     NaN    NaN 66.67 33.02   33.65  99.69    NaN    NaN    NaN    NaN       0       318
713 Miami-Dade   991  39.41    58.96  -19.55  98.36   NaN   NaN     NaN    NaN    NaN    NaN    NaN    NaN     977         0
714 Miami-Dade   992  28.44    68.81  -40.37  97.25   NaN   NaN     NaN    NaN    NaN    NaN    NaN    NaN     109         0
715 Miami-Dade   993  61.18    38.82   22.37 100.00   NaN   NaN     NaN    NaN    NaN    NaN    NaN    NaN     152         0
716 Miami-Dade   994  45.89    52.42   -6.53  98.32   NaN   NaN     NaN    NaN    NaN    NaN    NaN    NaN     475         0
717 Miami-Dade   995  68.01    31.45   36.56  99.46   NaN   NaN     NaN    NaN    NaN    NaN    NaN    NaN   1,838         0
718 Miami-Dade   996  75.87    23.98   51.90  99.85   NaN   NaN     NaN    NaN    NaN    NaN    NaN    NaN   1,343         0
719 Miami-Dade   997  48.37    46.51    1.86  94.88   NaN   NaN     NaN    NaN    NaN    NaN    NaN    NaN     215         0
720 Miami-Dade   999  73.37    26.63   46.73 100.00   NaN   NaN     NaN    NaN    NaN    NaN    NaN    NaN     199         0
721      TOTAL TOTAL  60.02    39.05   20.97  99.07 53.59 46.22    7.38  99.81  -6.42   7.17 -13.59   0.74 798,426 1,152,881
The line for AREA 989 shows the precinct with 8,880 votes and that it had a vote margin of just 11.88% in 2020. The large shift appears largely due to the fact that it had only 10 votes in 2018. Hence, it does not seem to be a major concern. The "Y From,To,Step,Tick" and "Position below" inputs can be set to focus in on the main precincts and to make these labels more visible. Those inputs as shown below and result in the following plot.
STATE:  FL
RACE:   FL_2018_Governor,FL_2020_President
COUNTY: Miami-Dade
AREA modify: -.$
Min Votes:   100
Label type:  Area
Position below: 168,201,202,248,274
Y From,To,Step,Tick: -40,20,10
Add to title: (positive direction is more Dem.)
Comparing the 2016 and 2020 Presidential Races in Miami-Dade County
STATE:  FL
RACE:   FL_2016_President,FL_2020_President
COUNTY: Miami-Dade
AREA modify: -.$
Min Votes:   100
Label type:  Area
Postions above: 233
Position below: 259,839,851
X From,To,Step,Tick: -40,100,20,10
Y From,To,Step,Tick: -80,20,20,10
Add to title: (positive direction is more Dem.)
Miami-Dade County, FL: Shift in Margin Vote Share from FL_2016_President to FL_2020_President (Percent)

        COUNTY  AREA Clinton Trump MARGIN1 TOTAL1 Biden Trump.1 MARGIN2 TOTAL2 DEM_SH REP_SH MAR_SH TOT_SH  TOT1_N    TOT2_N
339 Miami-Dade   462   74.52 24.28   50.24  98.79 44.46   55.35  -10.89  99.82 -30.05  31.08 -61.13   1.02   2,072     4,390
431 Miami-Dade   589   88.46 11.54   76.92 100.00 51.20   48.80    2.41 100.00 -37.26  37.26 -74.51   0.00      78       166
620 Miami-Dade   833   77.92 20.78   57.14  98.70 50.00   50.00    0.00 100.00 -27.92  29.22 -57.14   1.30      77       212
633 Miami-Dade   851   82.63 16.01   66.62  98.64 64.42   35.32   29.11  99.74 -18.20  19.30 -37.51   1.10   1,324     1,546
684 Miami-Dade   949   83.43 15.56   67.87  99.00 65.45   34.47   30.98  99.93 -17.98  18.91 -36.89   0.93   1,195     1,346
693 Miami-Dade   965   75.25 22.77   52.48  98.02 51.47   48.33    3.13  99.80 -23.78  25.56 -49.35   1.78   3,285     3,989
Selecting Count for "Units" shows the following vote counts for those precincts:
Miami-Dade County, FL: Shift in Margin Votes from FL_2016_President to FL_2020_President (Count)

        COUNTY  AREA Clinton   Trump MARGIN1  TOTAL1   Biden Trump.1 MARGIN2    TOTAL2 DEM_SH  REP_SH   MAR_SH  TOT_SH

339 Miami-Dade   462   1,544     503   1,041   2,072   1,952   2,430    -478     4,390    408   1,927   -1,519   2,318
431 Miami-Dade   589      69       9      60      78      85      81       4       166     16      72      -56      88
620 Miami-Dade   833      60      16      44      77     106     106       0       212     46      90      -44     135
633 Miami-Dade   851   1,094     212     882   1,324     996     546     450     1,546    -98     334     -432     222
684 Miami-Dade   949     997     186     811   1,195     881     464     417     1,346   -116     278     -394     151
693 Miami-Dade   965   2,472     748   1,724   3,285   2,053   1,928     125     3,989   -419   1,180   -1,599     704
A list of Precincts of Miami-Dade County identifies the last precinct 965 as being Miami-Dade County Fire Station #69 at 11151 NW 74 St, Doral, FL 33178. One very useful tool in comparing the 2016 and 2020 Presidential elections is a New York Times interactive map at this link. Entering this address into this tools, it's possible to find that this precinct is the one bordered by a black line in the following map.
Comparing the 2018 Gubernatorial and the 2020 Presidential Races in Osceola County
STATE:  FL
RACE:   FL_2018_Governor,FL_2020_President
COUNTY: Osceola
AREA modify: #-.$
Min Votes:   100
Label type:  Area
Y From,To,Step,Tick: -120,70,20
Add to title: (positive direction is more Dem.)
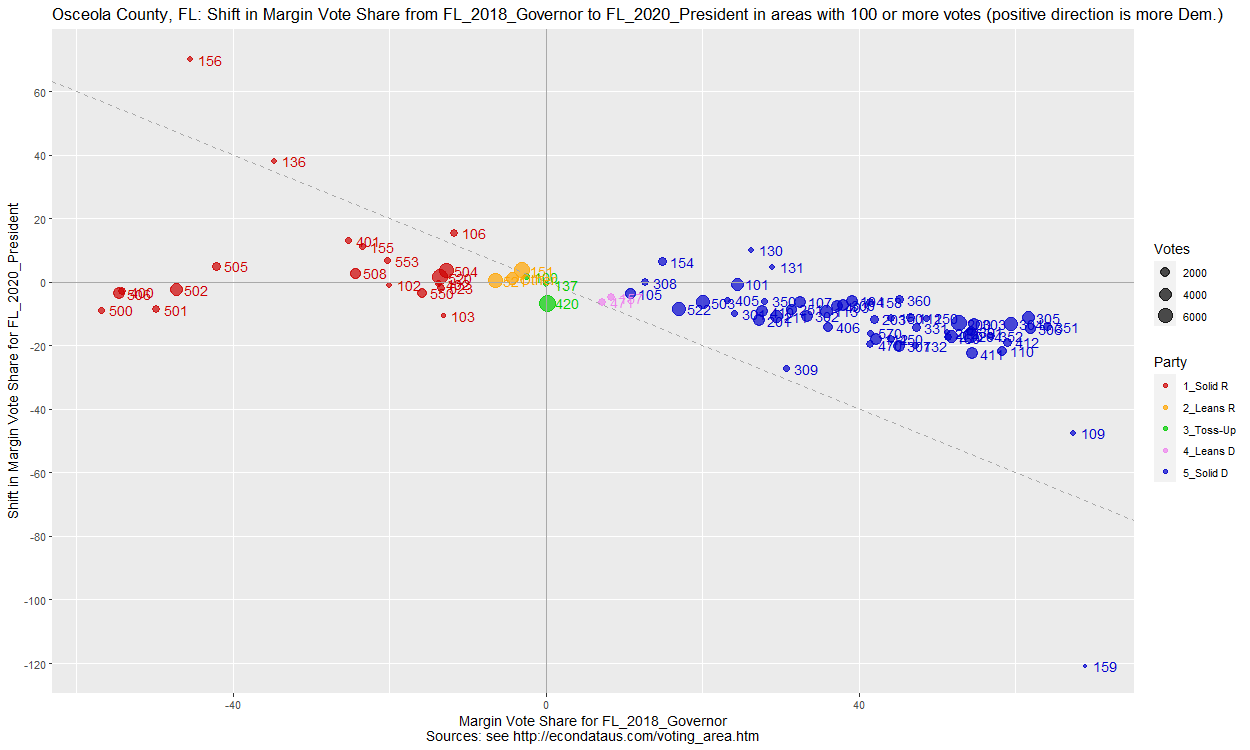 It's important to clear or comment out (with #) the "AREA modify" field if not expressly required. Removing the # character and setting it to -.$ will remove the last character of AREA and improperly combine precincts for Osceola. The plot above includes all precincts and "Y From,To,Step,Tick" was set just to improve the labels on the y-scale. Changing this to -30,15 will zoom in on the main body of precincts. Also, the following inputs will make the labels more readable by changing the placement of many of those that overlap:
Position above: 111,112,150,570
Position below: 200,204,210,307
Y From,To,Step,Tick: -30,15
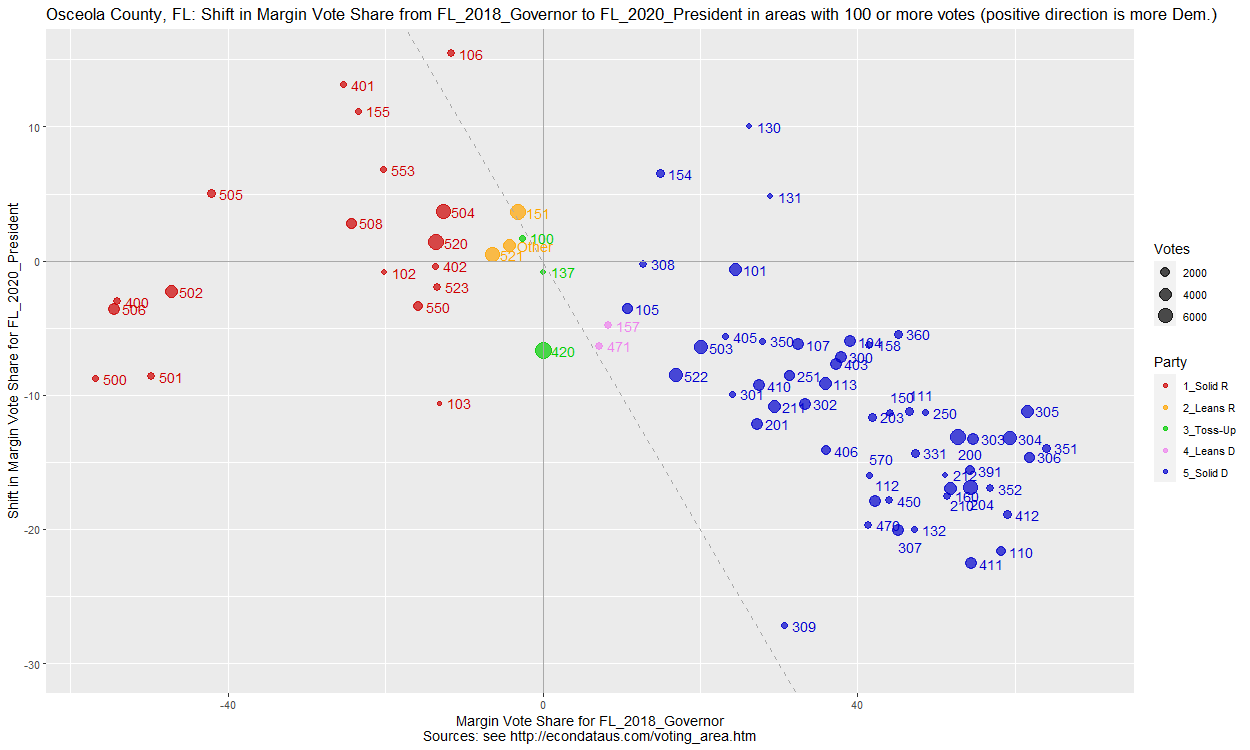 As can be seen, the solid Republican precincts appear not to be shifted by more than a couple of percent on average. The solid Democratic precincts, however, appear to be red-shifted by 10 to 15 percent on average. The actual precincts can be identified by the list at this list of Osceola polling locations. Hence, as with Miami-Dade County, the major red-shift since 2018 has occurred in the strongly Democratic precincts.
Comparing the 2020 Presidential Race and 2020 Total Registration in Osceola County
STATE:  FL
RACE:   FL_2020_President,FL_2020_Registered
COUNTY: Osceola
AREA modify: #-.$
Min Votes:   100
Units:       Percent ratio
Party:       Total
Label type:  Area
Add to title: (positive direction is more Dem.)
This results in the following plot:
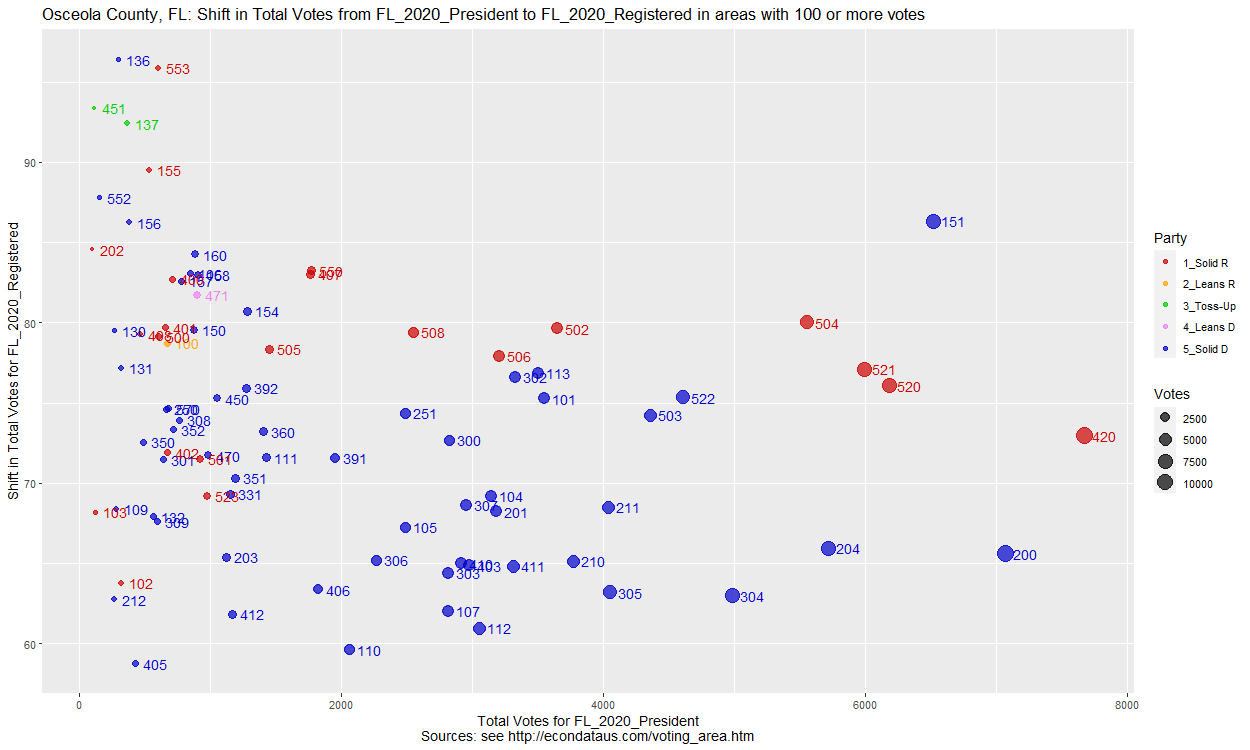 As can be seen, for precincts with 1000 or more votes, the turnout in solid Republican precincts was between about 73% and 83% and the turnout for solid Democratic precincts was between about 60% and 77% (except for precinct 154 at about 81%).
Comparing the Change since 2017 in the Number of Registered Voters by Party
 The following plot shows the drop in registered Democrats in Miami-Dade County, FL. The number there has dropped by 36,796 since the election with 21,633 of that drop coming in August alone. That puts Democrat registration at a level not seen since May of 2019.
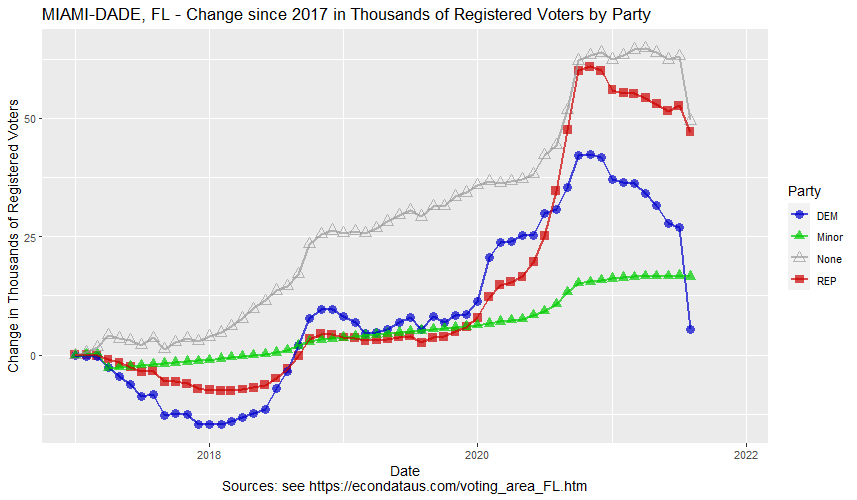 Sources: Voter Registration Reports
Precinct Data Locations
If anyone should run into any issues or have any suggestions for additional features, feel free to let me know via the Contact box at the bottom of this page.
2020 U.S. Election
Polling Election Data
Comparing Polling and Election Results via R Shiny
Red Shifts for 2020 Election Cycle, November 18, 2020
Precinct Election Data
Analysis of Reported Voting Areas via R Shiny
Analysis of Reported Voting Areas in Florida via R Shiny
Analysis of the Distribution of Precinct Margins by County via R Shiny
Precinct Results in Florida through 2020
Precinct Results in Iowa through 2020
Precinct Results in Maine through 2020
Precinct Results in North Carolina through 2020
Precinct Results in South Carolina through 2020
Precinct Results in Texas through 2020
County Election Data
Exploring Federal Election Results by County via R Shiny
County Results in Arizona in 2020
County Results in California in 2020
County Results in Florida in 2020
County Results in Iowa in 2020
County Results in Kentucky in 2020
County Results in Maine in 2020
County Results in Montana in 2020
County Results in Pennsylvania in 2020
County Results in South Carolina in 2020
County Results in Texas in 2020