Irregularities in Michigan in 2016
Undervotes for President in Michigan in 2016Comparing Votes for President and U.S. House in Michigan in 2016
Comparing Votes for President and State House in Michigan in 2016
Comparing Votes for President and State House in Michigan in 2016
Precinct Data Locations
Irregularities in Michigan in 2016
Undervotes for President in Michigan in 2016
A book titled The Strip & Flip Disaster of America's Stolen Elections: Updated "Trump" Edition of Strip & Flip Selection of 2016 lists a number of seeming irregularities in the 2016 Presidential election between Hillary Clinton and Donald Trump. The section titled "The Disaster of 2016" contains a subsection titled "Part Two: The General Election" which contains the following paragraph:
In Michigan, which allegedly went to Trump by some 10,000 votes, more than 75,000 ballots were registered as coming in without a presidential preference. This would have meant that all those Michigan voters had taken the effort to come to the polls and cast a ballot but somehow refrained from choosing any of the four or more presidential candidates that appeared on their ballots. The undervotes were reported in primarily Democratic areas of southeastern Michigan.
These numbers are verified in a 2016 Washington Post article titled 1.7 million people in 33 states and D.C. cast a ballot without voting in the presidential race. It starts with the following paragraph:
In every election, there are people who go to the polls to cast a ballot but who don't vote in every race. Usually, those "undervotes," as they're called, happen down-ballot, resulting in fewer votes for, say, county commissioner than, say, president of the United States. But in every election there are also people who skip the presidential ballot for whatever reason. It happens.
Further on, it states "In several states, the number of people who didn't vote was near or greater than the eventual margin of victory" and lists the following numbers:
Arizona.  Margin,  91,234. Undervote,  88,332 --  96.8 percent of margin.
Maine.    Margin,  22,142. Undervote,  23,965 -- 108.2 percent of margin.
Florida.  Margin, 112,911. Undervote, 160,450 -- 142.1 percent of margin.
Michigan. Margin,  10,704. Undervote,  75,335 -- 703.8 percent of margin.
Comparing Votes for President and U.S. House in Michigan in 2016
As can be seen, the numbers for Michigan pretty much match those given in the book. It's possible to look at the Michigan numbers more closely using the Shiny application at https://econdata.shinyapps.io/voting_oe/. This application uses data from the OpenElections project. As stated on its About Page, the project's goal is "to create the first free, comprehensive, standardized, linked set of election data for the United States, including federal and statewide offices". To use this data in the application, go to that aforementioned URL and do the following steps:
- Set STATE to MI
- Set YEAR to 2016
- Set ELECTION to 20161108__mi__general
- Set COUNTY to (all)
- Set OFFICE to President
- Click the "ADD RACE" button
- Set OFFICE to "U.S. House"
- Click the "ADD RACE" button
- Set Units to "Percent ratio"
- Click the "Area Plot2" tab
- Uncheck the "Show all labels" checkbox
- Set "Y From,To,Step,Tick" to "95,115" (without the quotes)
- Uncheck the X-axis checkbox
- Set "Color (regression)" to def
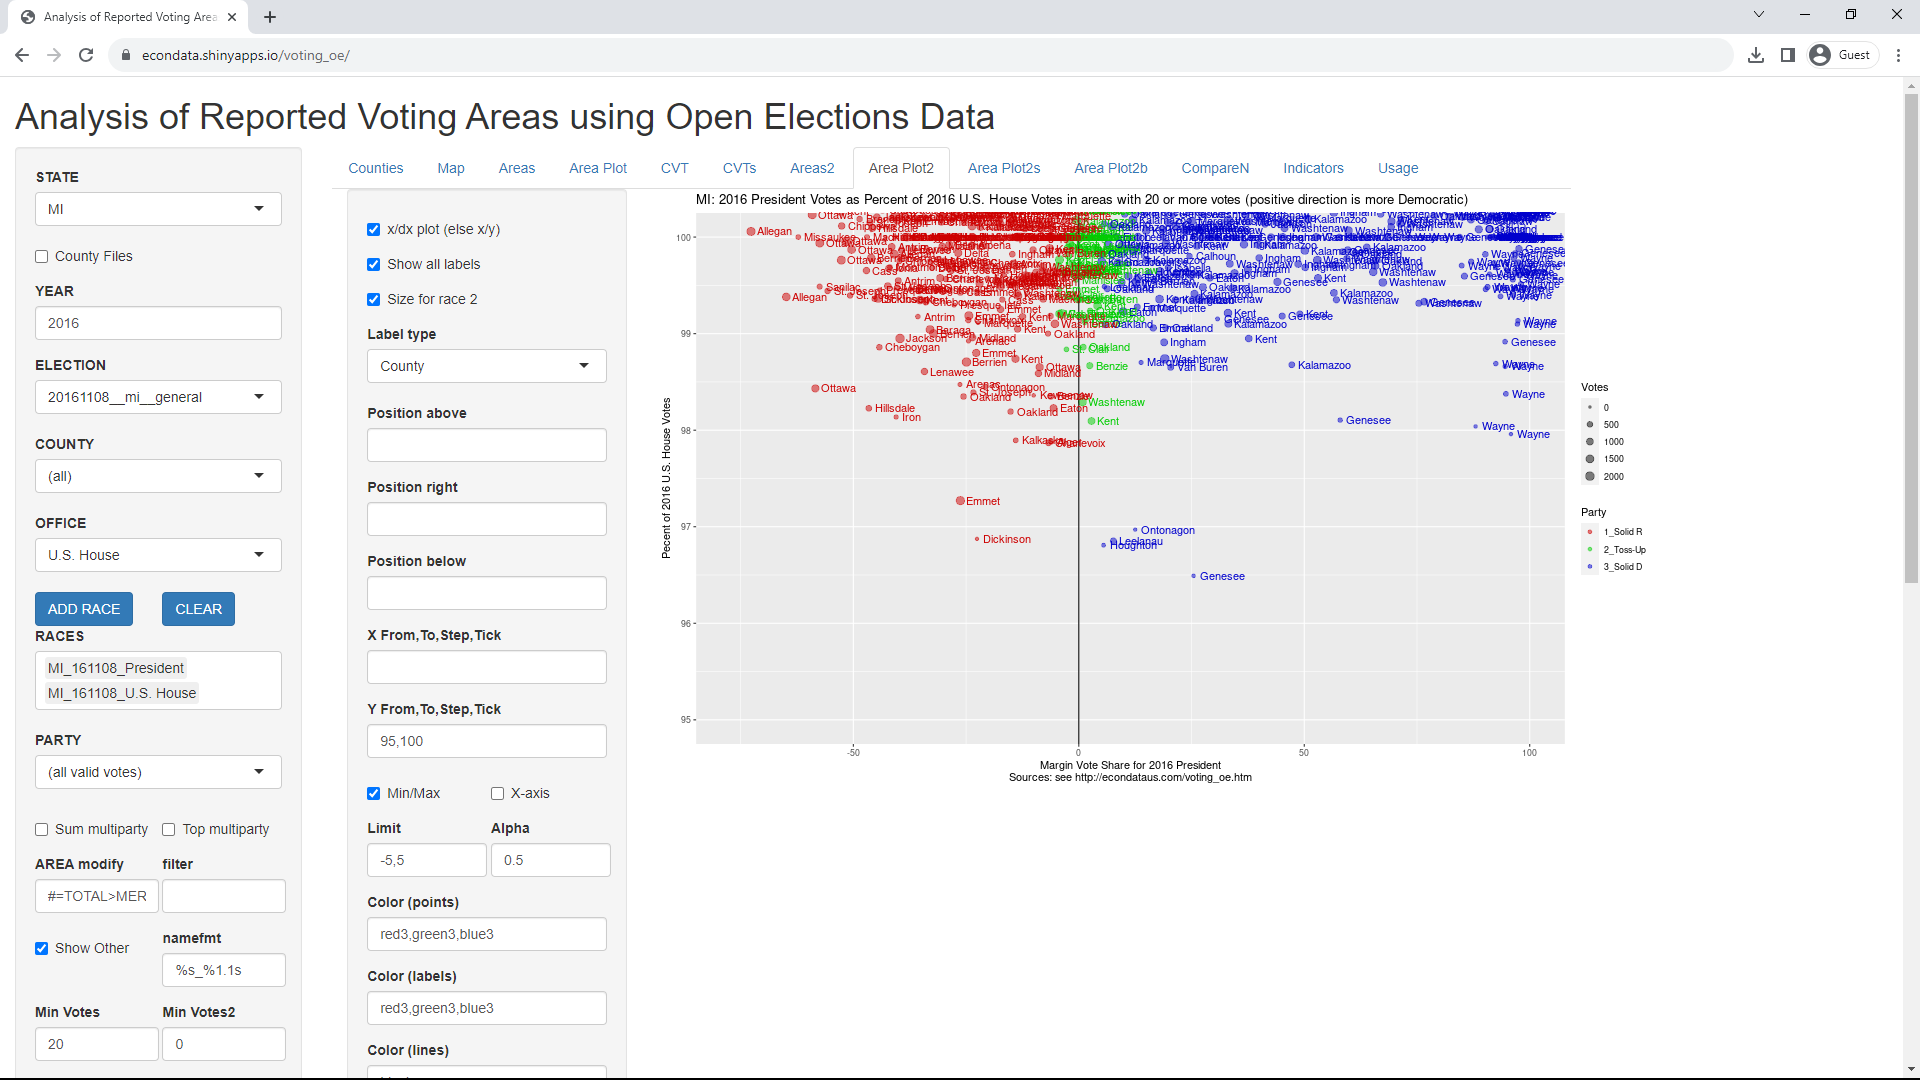
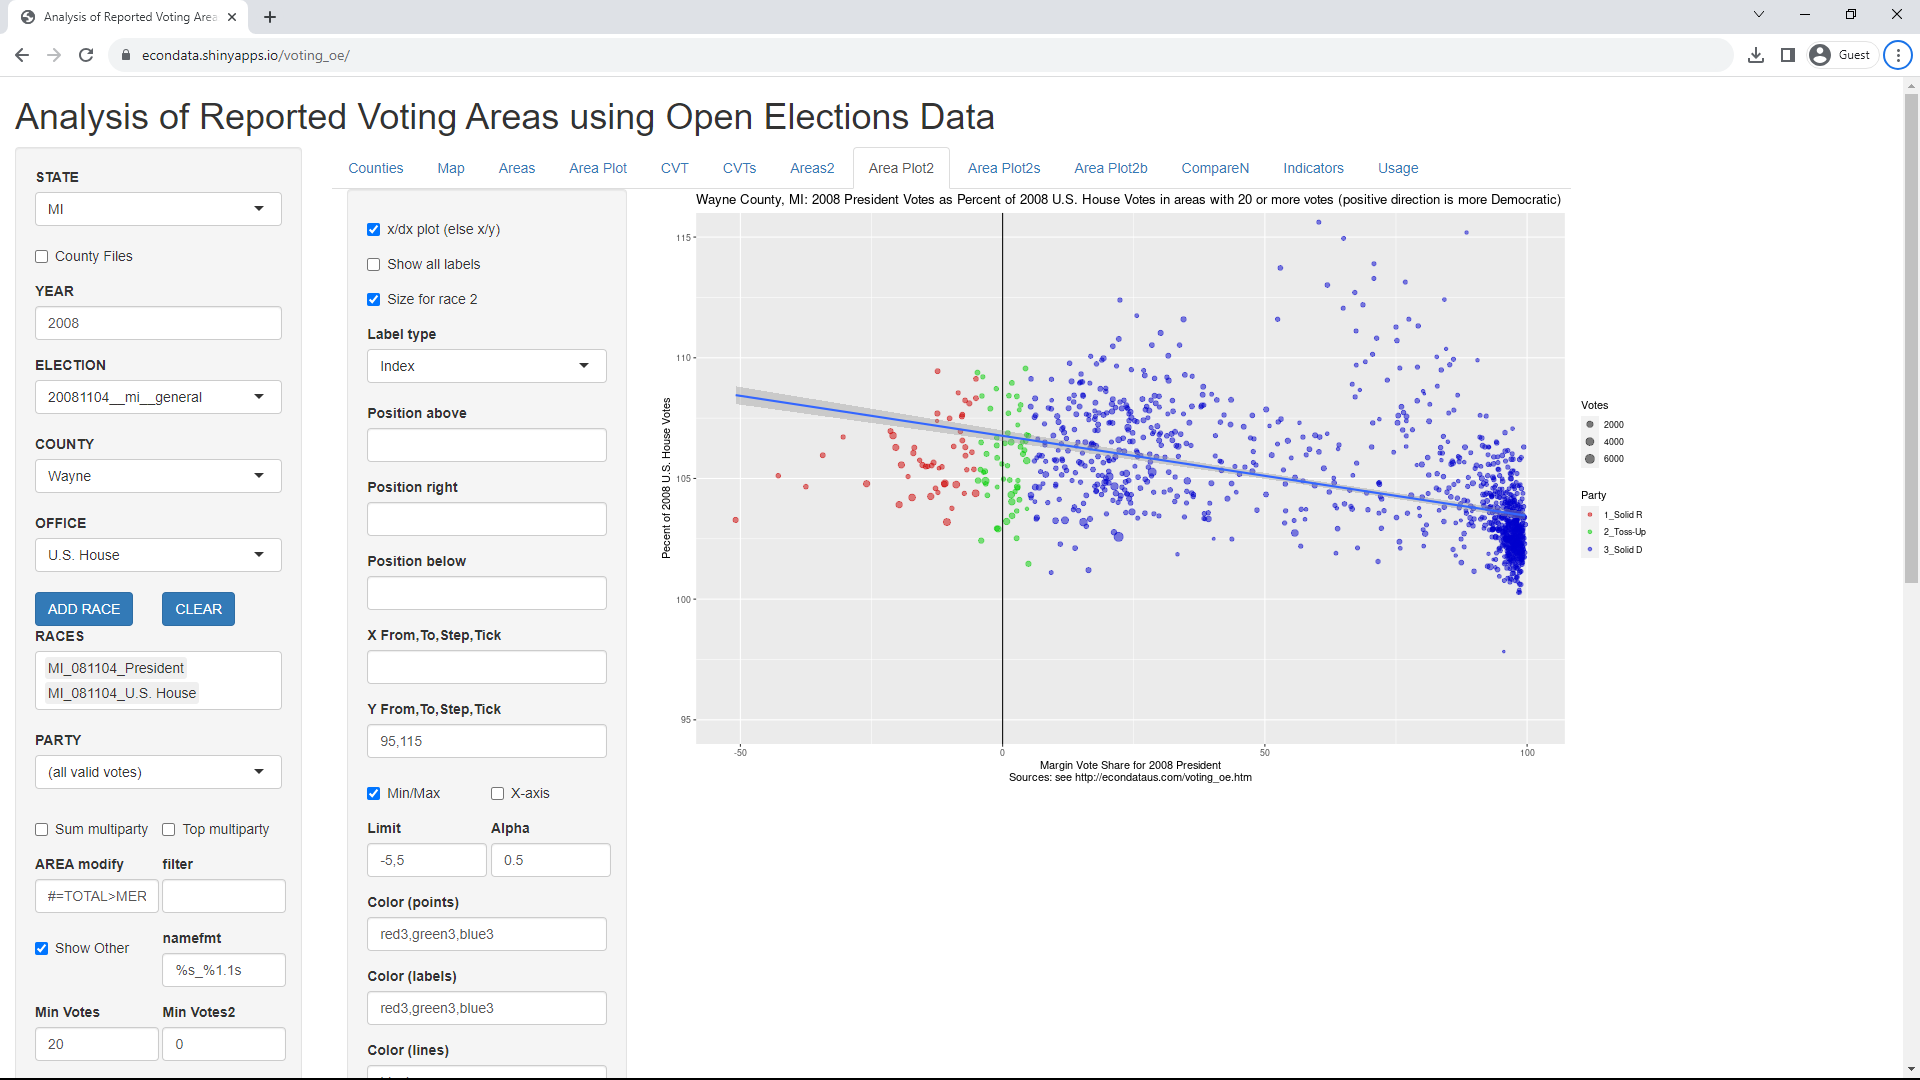
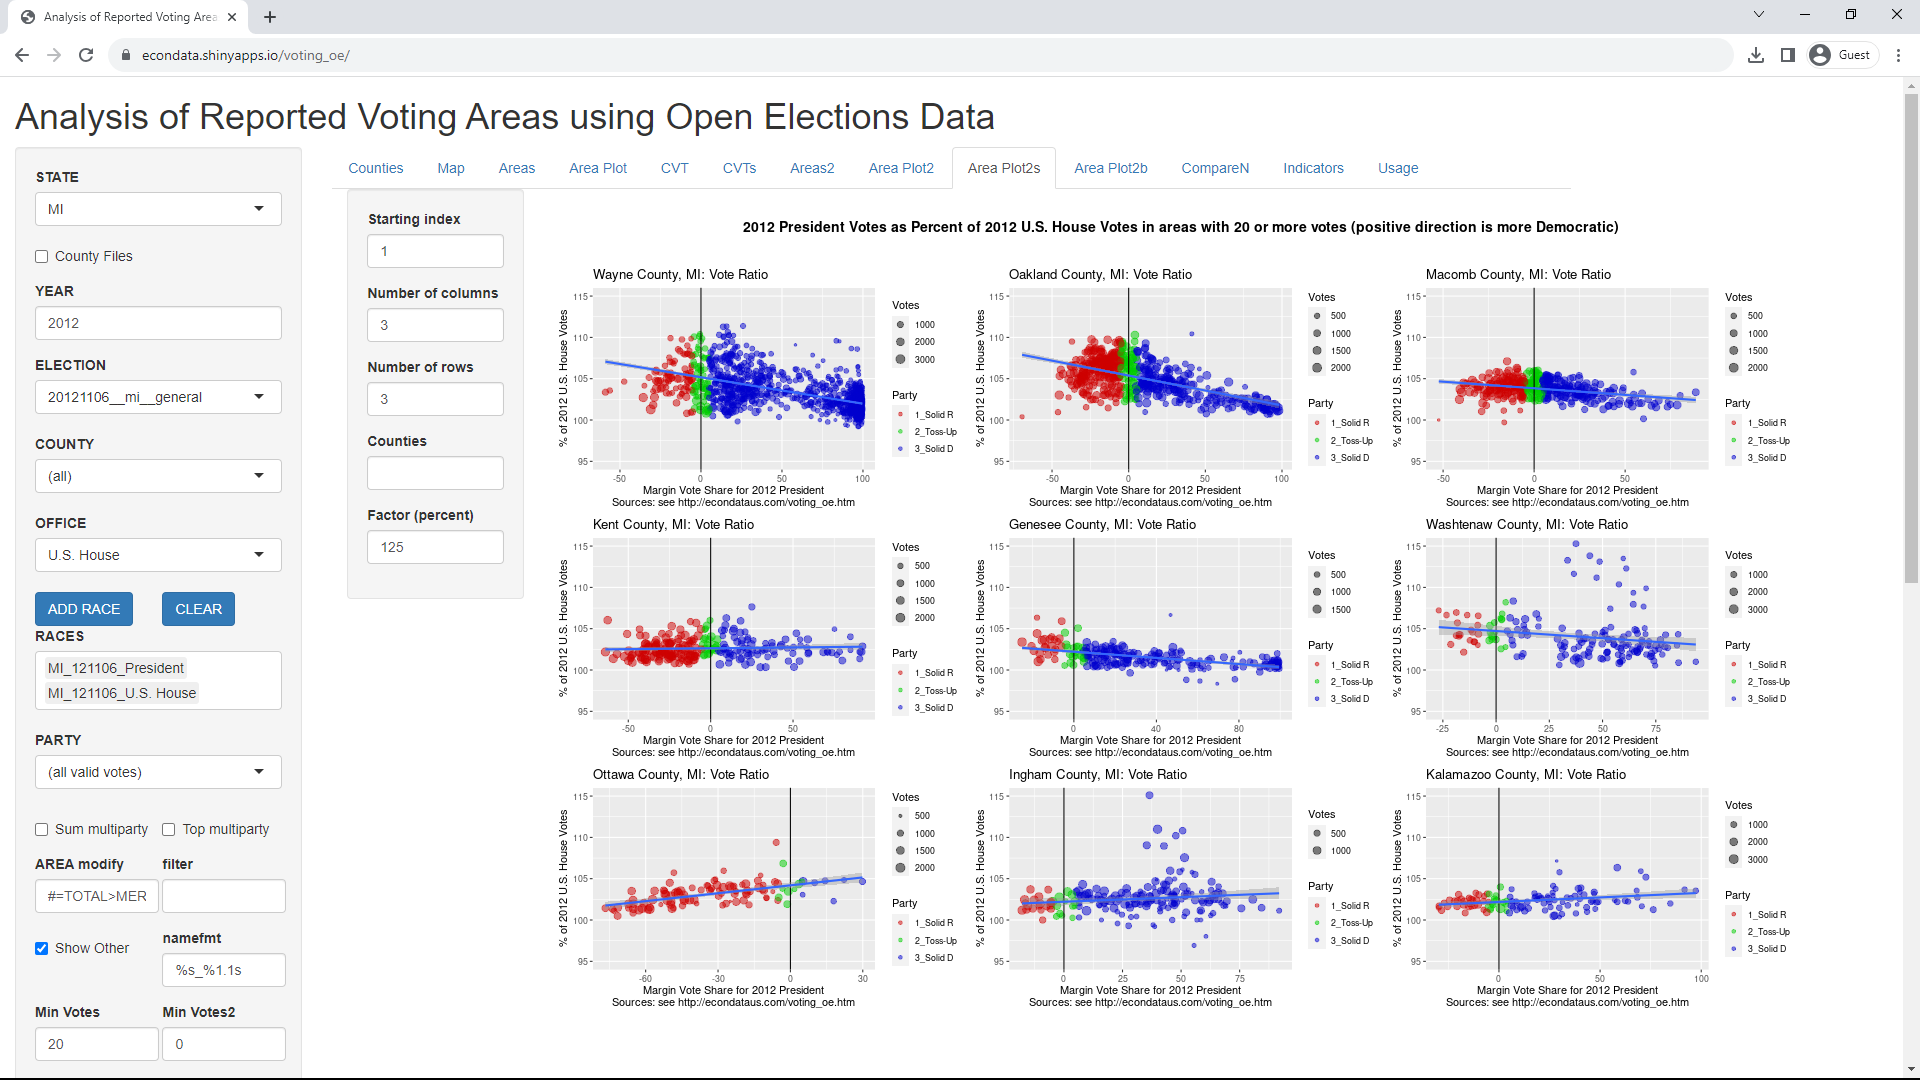
This should display the following plot:

As stated in the Washington Post article, the prior undercounts were obtained by subtracting the number of votes in the presidential race from the total number of votes cast (often called the Ballots Cast). Unfortunately, the OpenElections data for Michigan doesn't contain the Ballots Cast. For that reason, the above plot shows the total number of votes for President minus the total number of votes for the U.S. House in every precinct in Michigan. One would normally expect this to be at or above 100 percent since, as stated in the article, undervotes usually happen in the down-ballot races. As can be seen, the regression line appears to slant from just above 103 percent in the strong Republican precincts to just below 102 percent in the strong Democratic precincts.
In order to look more closely at those precincts for which the ratio is below 100 percent, do the following steps:
- Check "Show all labels"
- Set "Label type" to County
- Set "Y From,To,Step,Tick" to "95,100" (without the quotes)
- Set "Limit (regression)" to "95,115" (without the quotes)
This should display the following plot:
The above plot shows the counties of those Michigan precincts in which there were surprisingly more votes in the U.S. House race than in the Presidential race. As can be seen, many of the most solid Democrat precincts (on the far right) were in Wayne County.
Clicking on the OFFICE select list shows that the OpenElections data for Michigan also includes the votes for the State House. Substituting the State House for the U.S. House in the prior steps results in the following steps:
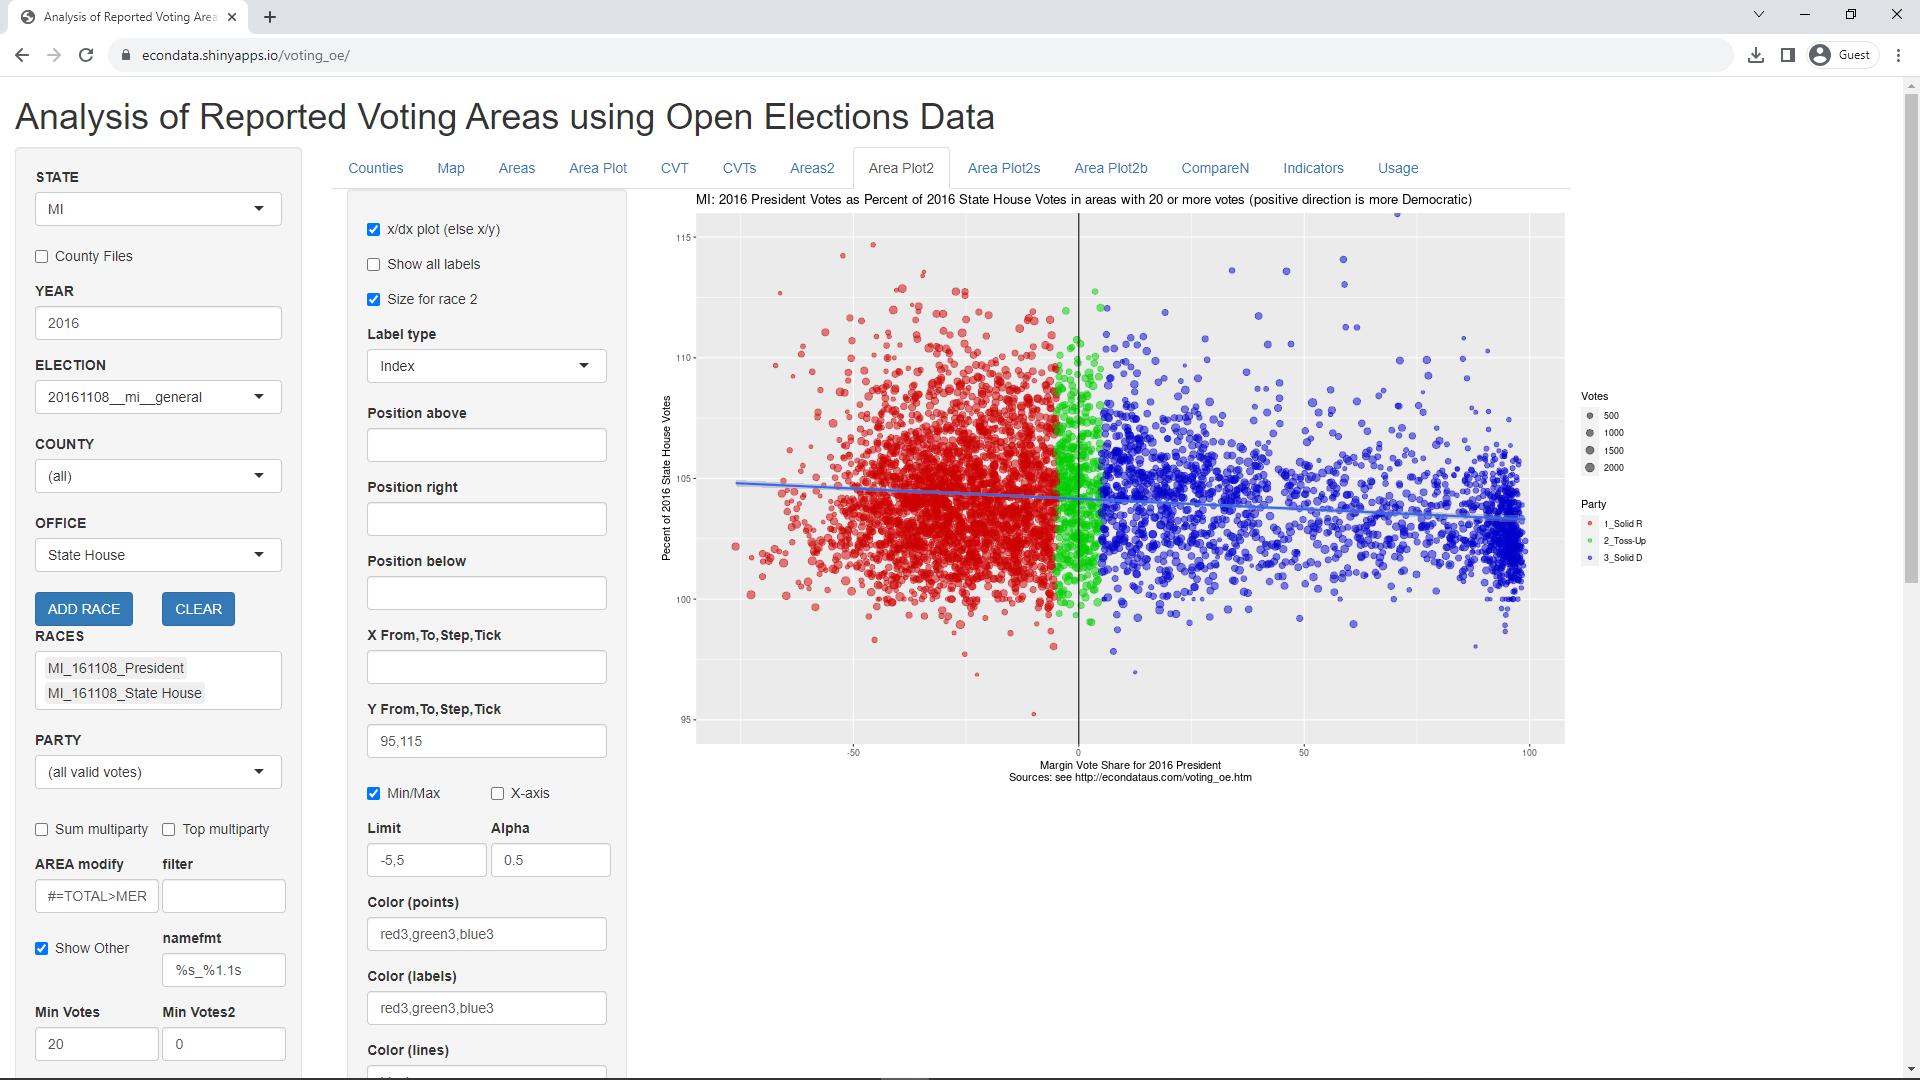
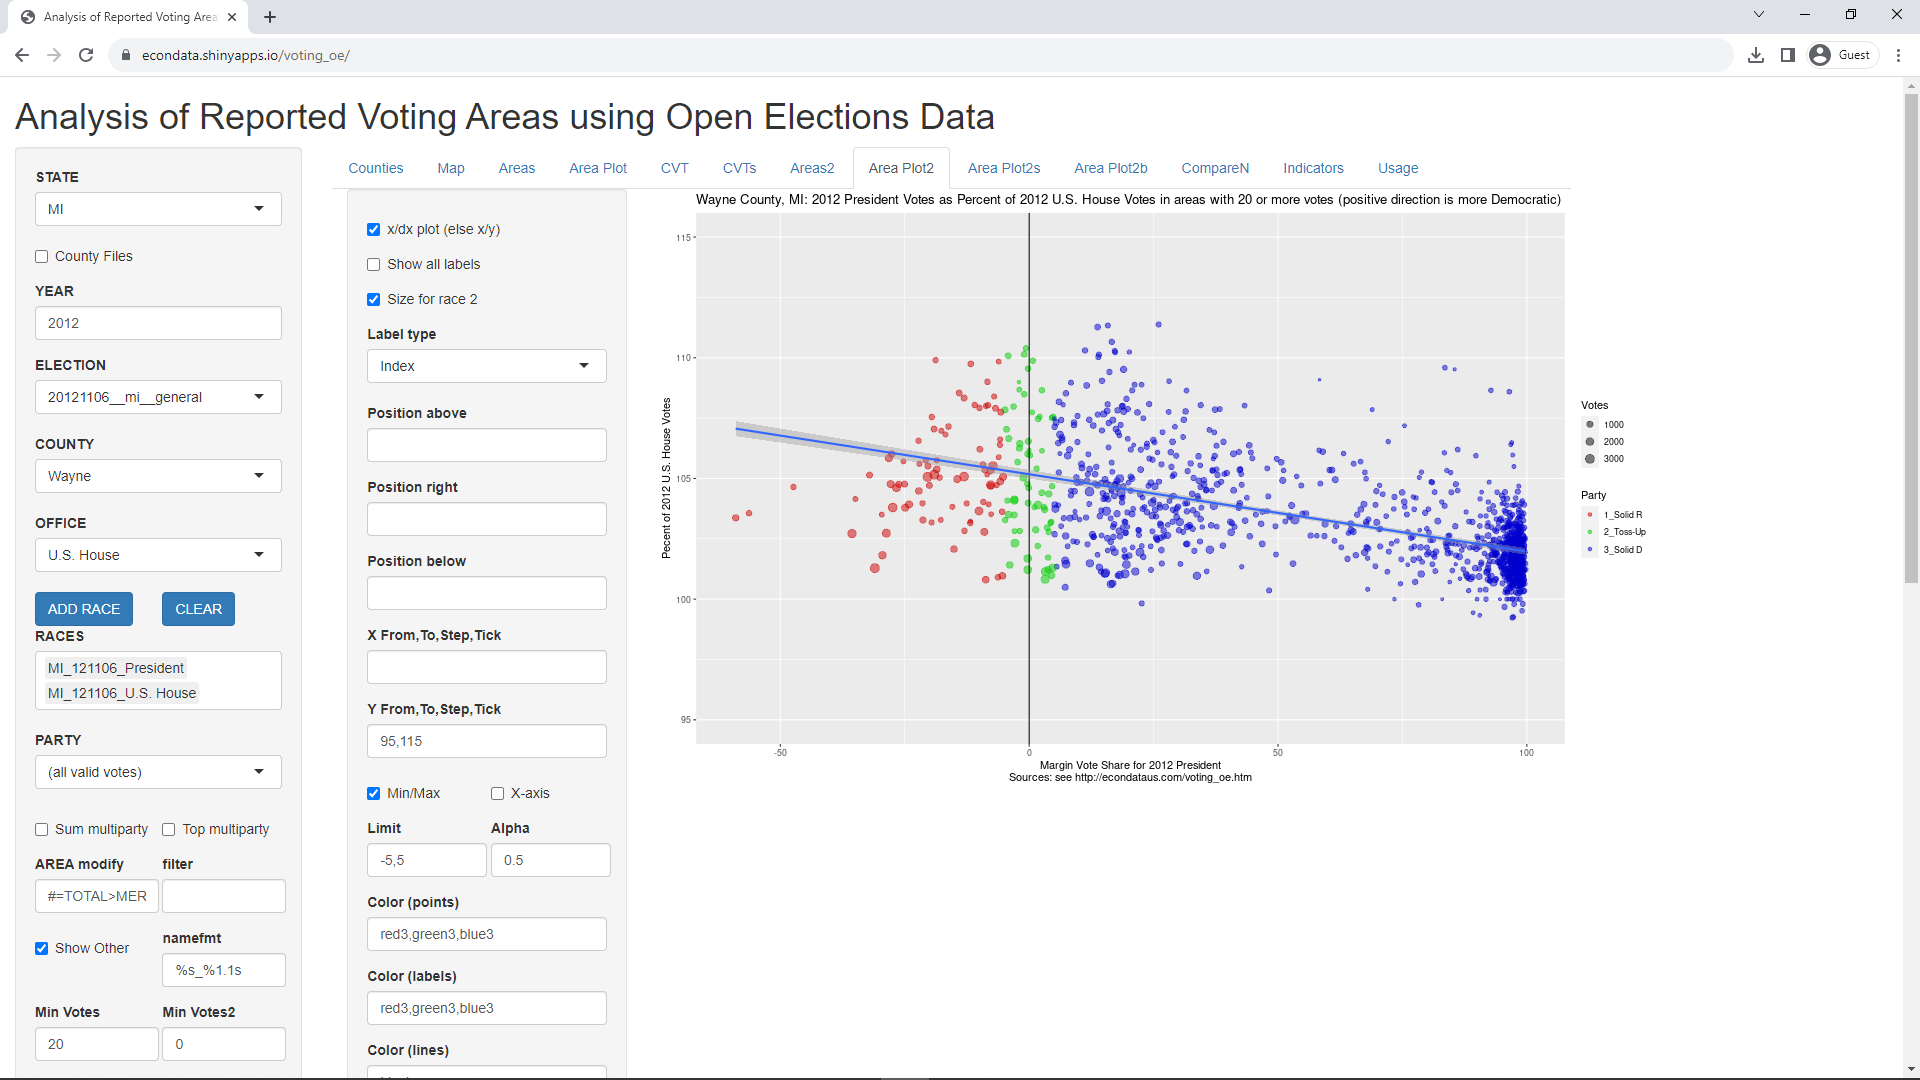
As can be seen, the regression line is a little higher than for the U.S. House, slanting from about 105 percent in the strong Republican precincts to about 103 percent in the strong Democratic precincts. This would seem expected since the State House race is likely further "down-ballot" than the U.S. House election.
In order to look more closely at those precincts for which the ratio is below 100 percent, do the following steps:
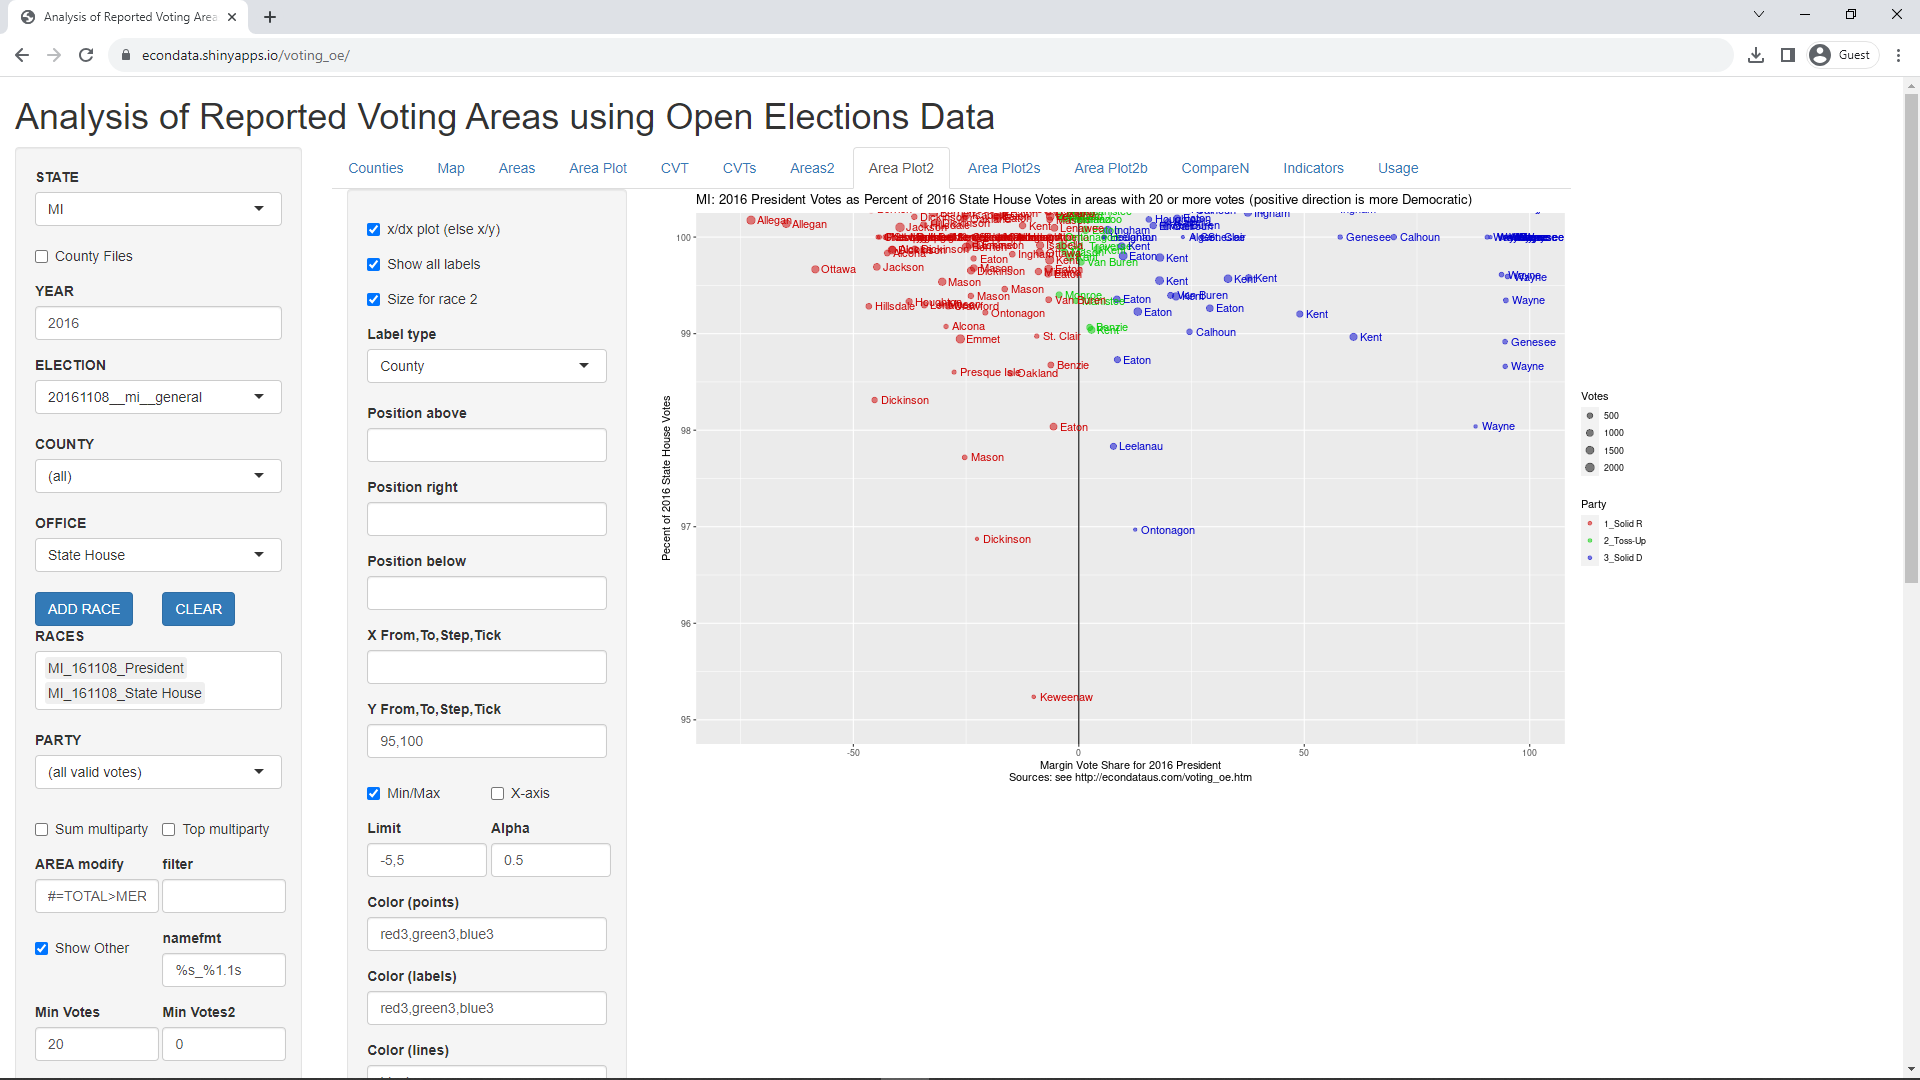
This should display the following plot:
The above plot shows the counties of those Michigan precincts in which there were surprisingly more votes in the State House race than in the Presidential race. As before, many of the most solid Democrat precincts (on the far right) were in Wayne County. Also noticable is that there appears to be far fewer precincts than there were when comparing to the U.S. House though the range seems similar.
The prior steps can be changed to compare the Presidential and U.S. House votes in just Wayne County as follows:
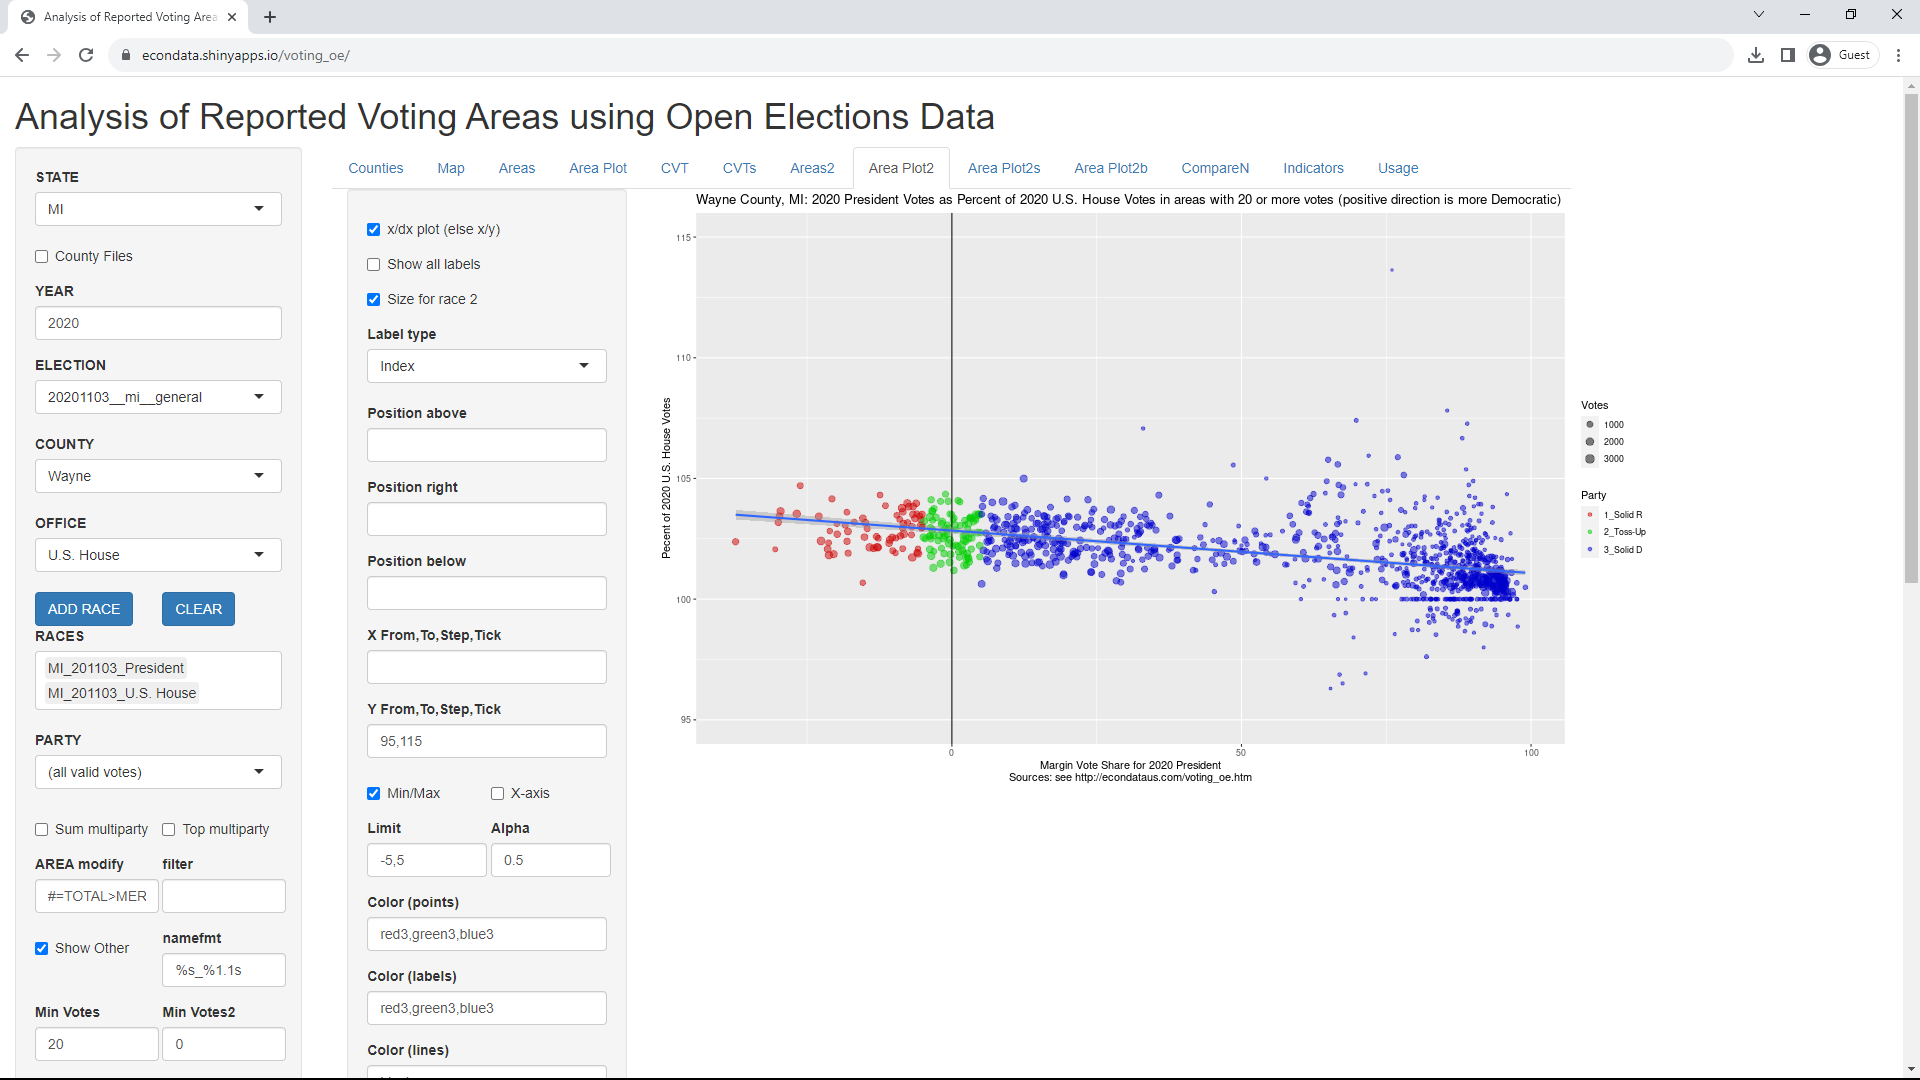
As can be seen, the regression line is again a little higher than for the U.S. House in all of Michigan. More noticable, however, is that it slants quite a bit more than the prior one-plus percentage, slanting about 4 percent from about 106 percent in the strong Republican precincts to about 102 percent in the strong Democratic precincts. Also interesting is what appears to be a near-solid horizontal line at 100 percent on the y-axis and between about 90 and 98 percent on the x-axis.
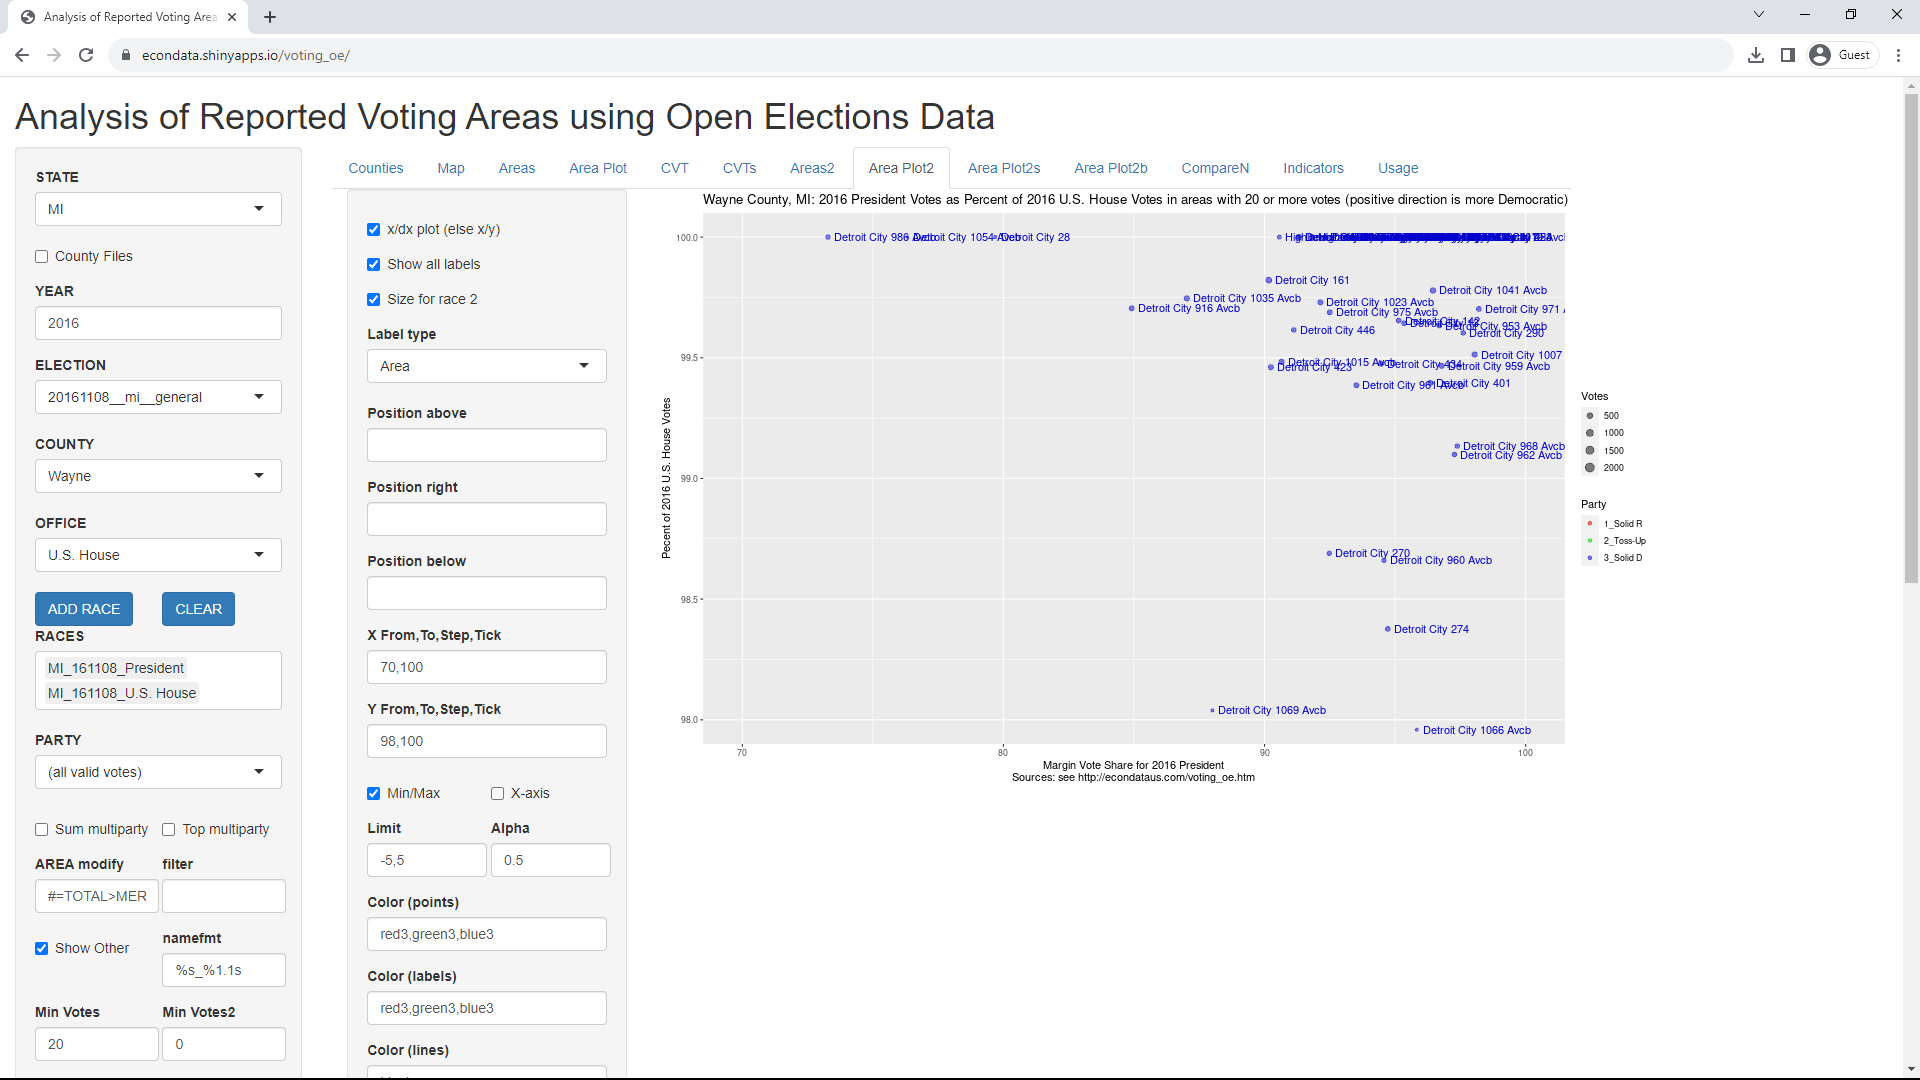
In order to look more closely at those precincts for which the ratio is below 100 percent, do the following steps:
As can be seen, nearly all of the precincts appear to be in Detroit. In fact, you can get a list of the precincts via the following steps:
The fact that the regression lines all slant downward from left to right indicates that, on average, there were fewer votes for President than for the U.S. House or the State House in Michigan in the 2016 general election. I would very much seem that this should be investigated and not merely explained as "It happens" as in the Washington Post article. It would be useful to know how many of the undervotes for President are occurring in totally blank ballots (if those are, in fact, counted) or on ballots with only one or two races marked. More important, it would seem prudent to, if possible, examine them all manually. It's possible that some of the undervotes are very light marks that were not picked up by the optical scanners. In fact, I believe, that most optical scanners have a sensitivity setting. This would be especially concerning if the sensitivity could be set differently for different races. This would allow someone to set the Democrat Presidential candidate to be less sensitive than other candidates, resulting in more "missed" votes for that candidate. Of course, this could also be accomplished with malicious code that randomly ignored some small percentage of the votes for certain candidates. It would seem critical that undervotes be examined and not simply ascribed to the intent or a mistake by the voter.
Comparing Votes for President and State House in Michigan in 2016
Following these steps should display the following plot:
Comparing Votes for President and U.S. House in Wayne County, MI in 2016
Following these steps should display the following plot:

This should display the following plot:
This should display a table beginning with the following lines:
Wayne County, MI: Shift in Margin Votes from 2016 President to 2016 U.S. House (Count)
COUNTY AREA Clinton_D Trump_R MARGIN1 TOTAL1 Dingell_D Gorman_R MARGIN2 TOTAL2 DEM_SH REP_SH MAR_SH TOT_SH
1 WAYNE DETROIT CITY 274 295 8 287 303 0 8 -8 308 -295 0 -295 5
2 WAYNE DETROIT CITY 960 AVCB 214 5 209 221 0 5 -5 224 -214 0 -214 3
3 WAYNE DETROIT CITY 270 214 5 209 226 0 8 -8 229 -214 3 -217 3
4 WAYNE DETROIT CITY 968 AVCB 226 3 223 229 0 3 -3 231 -226 0 -226 2
5 WAYNE DETROIT CITY 962 AVCB 217 3 214 220 0 2 -2 222 -217 -1 -216 2
6 WAYNE DETROIT CITY 961 AVCB 312 9 303 324 0 7 -7 326 -312 -2 -310 2
7 WAYNE DETROIT CITY 959 AVCB 366 5 361 373 0 4 -4 375 -366 -1 -365 2
8 WAYNE DETROIT CITY 490 19 0 19 21 0 0 0 23 -19 0 -19 2
9 WAYNE DETROIT CITY 434 364 6 358 379 0 6 -6 381 -364 0 -364 2
10 WAYNE DETROIT CITY 423 344 11 333 369 0 21 -21 371 -344 10 -354 2
11 WAYNE DETROIT CITY 401 322 5 317 329 0 6 -6 331 -322 1 -323 2
12 WAYNE DETROIT CITY 1015 AVCB 364 15 349 385 0 17 -17 387 -364 2 -366 2
13 WAYNE DETROIT CITY 1007 AVCB 404 3 401 409 0 0 0 411 -404 -3 -401 2
14 WAYNE DETROIT CITY 975 AVCB 306 10 296 320 0 11 -11 321 -306 1 -307 1
15 WAYNE DETROIT CITY 971 AVCB 332 3 329 335 0 3 -3 336 -332 0 -332 1
16 WAYNE DETROIT CITY 953 AVCB 266 3 263 272 0 3 -3 273 -266 0 -266 1
17 WAYNE DETROIT CITY 916 AVCB 309 22 287 338 0 0 0 339 -309 -22 -287 1
18 WAYNE DETROIT CITY 446 244 8 236 259 0 5 -5 260 -244 -3 -241 1
19 WAYNE DETROIT CITY 290 247 2 245 251 0 8 -8 252 -247 6 -253 1
20 WAYNE DETROIT CITY 218 215 0 215 217 0 6 -6 218 -215 6 -221 1
21 WAYNE DETROIT CITY 161 517 13 504 559 0 14 -14 560 -517 1 -518 1
22 WAYNE DETROIT CITY 142 279 5 274 288 0 10 -10 289 -279 5 -284 1
23 WAYNE DETROIT CITY 13 271 5 266 279 0 0 0 280 -271 -5 -266 1
24 WAYNE DETROIT CITY 1069 AVCB 47 3 44 50 0 0 0 51 -47 -3 -44 1
25 WAYNE DETROIT CITY 1066 AVCB 47 1 46 48 0 1 -1 49 -47 0 -47 1
26 WAYNE DETROIT CITY 1063 AVCB 79 0 79 79 0 1 -1 80 -79 1 -80 1
27 WAYNE DETROIT CITY 1041 AVCB 440 5 435 451 0 5 -5 452 -440 0 -440 1
28 WAYNE DETROIT CITY 1035 AVCB 367 25 342 393 0 20 -20 394 -367 -5 -362 1
29 WAYNE DETROIT CITY 1023 AVCB 353 13 340 369 0 5 -5 370 -353 -8 -345 1
30 WAYNE HIGHLAND PARK CITY 7 107 1 106 112 0 2 -2 112 -107 1 -108 0
31 WAYNE HIGHLAND PARK CITY 25 150 6 144 159 0 4 -4 159 -150 -2 -148 0
32 WAYNE HIGHLAND PARK CITY 15 420 16 404 440 0 11 -11 440 -420 -5 -415 0
33 WAYNE DETROIT CITY 987 AVCB 236 6 230 247 0 3 -3 247 -236 -3 -233 0
34 WAYNE DETROIT CITY 986 AVCB 224 32 192 262 0 0 0 262 -224 -32 -192 0
35 WAYNE DETROIT CITY 94 493 20 473 518 0 0 0 518 -493 -20 -473 0
36 WAYNE DETROIT CITY 918 AVCB 316 6 310 323 0 0 0 323 -316 -6 -310 0
37 WAYNE DETROIT CITY 87 59 0 59 59 0 0 0 59 -59 0 -59 0
38 WAYNE DETROIT CITY 58 245 5 240 256 0 0 0 256 -245 -5 -240 0
39 WAYNE DETROIT CITY 469 214 2 212 223 0 6 -6 223 -214 4 -218 0
40 WAYNE DETROIT CITY 455 118 4 114 122 0 2 -2 122 -118 -2 -116 0
41 WAYNE DETROIT CITY 453 235 2 233 238 0 2 -2 238 -235 0 -235 0
42 WAYNE DETROIT CITY 443 38 0 38 38 0 1 -1 38 -38 1 -39 0
43 WAYNE DETROIT CITY 437 288 4 284 298 0 6 -6 298 -288 2 -290 0
44 WAYNE DETROIT CITY 417 222 1 221 227 0 0 0 227 -222 -1 -221 0
45 WAYNE DETROIT CITY 361 585 6 579 602 0 8 -8 602 -585 2 -587 0
46 WAYNE DETROIT CITY 36 125 3 122 129 0 4 -4 129 -125 1 -126 0
47 WAYNE DETROIT CITY 327 358 10 348 370 0 6 -6 370 -358 -4 -354 0
48 WAYNE DETROIT CITY 28 56 5 51 64 0 5 -5 64 -56 0 -56 0
49 WAYNE DETROIT CITY 239 365 8 357 383 0 0 0 383 -365 -8 -357 0
50 WAYNE DETROIT CITY 224 190 2 188 192 0 0 0 192 -190 -2 -188 0
51 WAYNE DETROIT CITY 195 253 4 249 261 0 0 0 261 -253 -4 -249 0
52 WAYNE DETROIT CITY 194 339 7 332 346 0 0 0 346 -339 -7 -332 0
53 WAYNE DETROIT CITY 180 137 2 135 140 0 0 0 140 -137 -2 -135 0
54 WAYNE DETROIT CITY 122 213 8 205 222 0 7 -7 222 -213 -1 -212 0
55 WAYNE DETROIT CITY 1071 AVCB 97 3 94 101 0 3 -3 101 -97 0 -97 0
56 WAYNE DETROIT CITY 1070 AVCB 45 1 44 46 0 0 0 46 -45 -1 -44 0
57 WAYNE DETROIT CITY 1067 AVCB 44 2 42 46 0 0 0 46 -44 -2 -42 0
58 WAYNE DETROIT CITY 1058 AVCB 27 0 27 27 0 0 0 27 -27 0 -27 0
59 WAYNE DETROIT CITY 1054 AVCB 33 4 29 38 0 3 -3 38 -33 -1 -32 0
60 WAYNE DETROIT CITY 105 140 3 137 144 0 0 0 144 -140 -3 -137 0
61 WAYNE DETROIT CITY 1019 AVCB 332 4 328 337 0 6 -6 337 -332 2 -334 0
62 WAYNE DETROIT CITY 1018 AVCB 327 8 319 337 0 6 -6 337 -327 -2 -325 0
63 WAYNE HIGHLAND PARK CITY 4 349 5 344 356 0 6 -6 355 -349 1 -350 -1
64 WAYNE HIGHLAND PARK CITY 1 207 2 205 210 0 3 -3 209 -207 1 -208 -1
65 WAYNE DETROIT CITY 994 AVCB 262 2 260 265 0 0 0 264 -262 -2 -260 -1
Precinct Data Locations
If anyone should run into any issues or have any suggestions for additional features, feel free to let me know via the Contact box at the bottom of this page.
2020 U.S. Election
Polling Election Data
Comparing Polling and Election Results via R Shiny
Red Shifts for 2020 Election Cycle, November 18, 2020
Precinct Election Data
Analysis of Reported Voting Areas via R Shiny
Analysis of Reported Voting Areas in Florida via R Shiny
Analysis of the Distribution of Precinct Margins by County via R Shiny
Precinct Results in Florida through 2020
Precinct Results in Iowa through 2020
Precinct Results in Maine through 2020
Precinct Results in North Carolina through 2020
Precinct Results in South Carolina through 2020
Precinct Results in Texas through 2020
County Election Data
Exploring Federal Election Results by County via R Shiny
County Results in Arizona in 2020
County Results in California in 2020
County Results in Florida in 2020
County Results in Iowa in 2020
County Results in Kentucky in 2020
County Results in Maine in 2020
County Results in Montana in 2020
County Results in Pennsylvania in 2020
County Results in South Carolina in 2020
County Results in Texas in 2020