The OpenElections Project
Analyzing a Single Race
Analyzing Voter Turnout and Registration
Analyzing the Turnout of a Single Race
Comparing the Turnout of Two Races
Analyzing Voter Registration
Analyzing Vote Counts
Comparing Multiple Races from a Single Election
Comparing the Margin Vote Shares of Two Races
Comparing the Margin Vote Shares of Multiple Races
Comparing the Cumulative Vote Tallies of Multiple Races
Comparing Multiple Races from Multiple Elections
Analyzing County Data
Analyzing the 2016 Presidential Race
The following summary of the OpenElections project can be found on their GitHub page:
The goal of OpenElections is to create the first free, comprehensive, standardized, linked set of election data for the United States, including federal, statewide and state legislative offices. The current options for election data can be difficult to find and use or financially out-of-reach for most journalists and civic hackers. We want the people who work with election data to be able to get what they need, whether that's for stories and data analysis or web applications and interactive graphics.
I previously created an R Shiny app for analyzing election data that is documented at this link. One major limitation, however, is that it can only analyze election data which has been parsed and stored in files that it can access. In order to address that limitation, I have taken the code from that app and modified it to access the OpenElections data online. There is a public online version of this app at https://econdata.shinyapps.io/voting_oe/. Having been derived from the app described at this link, much of the new app's functionality will be very similar. However, the UI has had to change a fair amount. The remainder of this document will describe how to use the new app, chiefly by giving a number of example using OpenElections data.
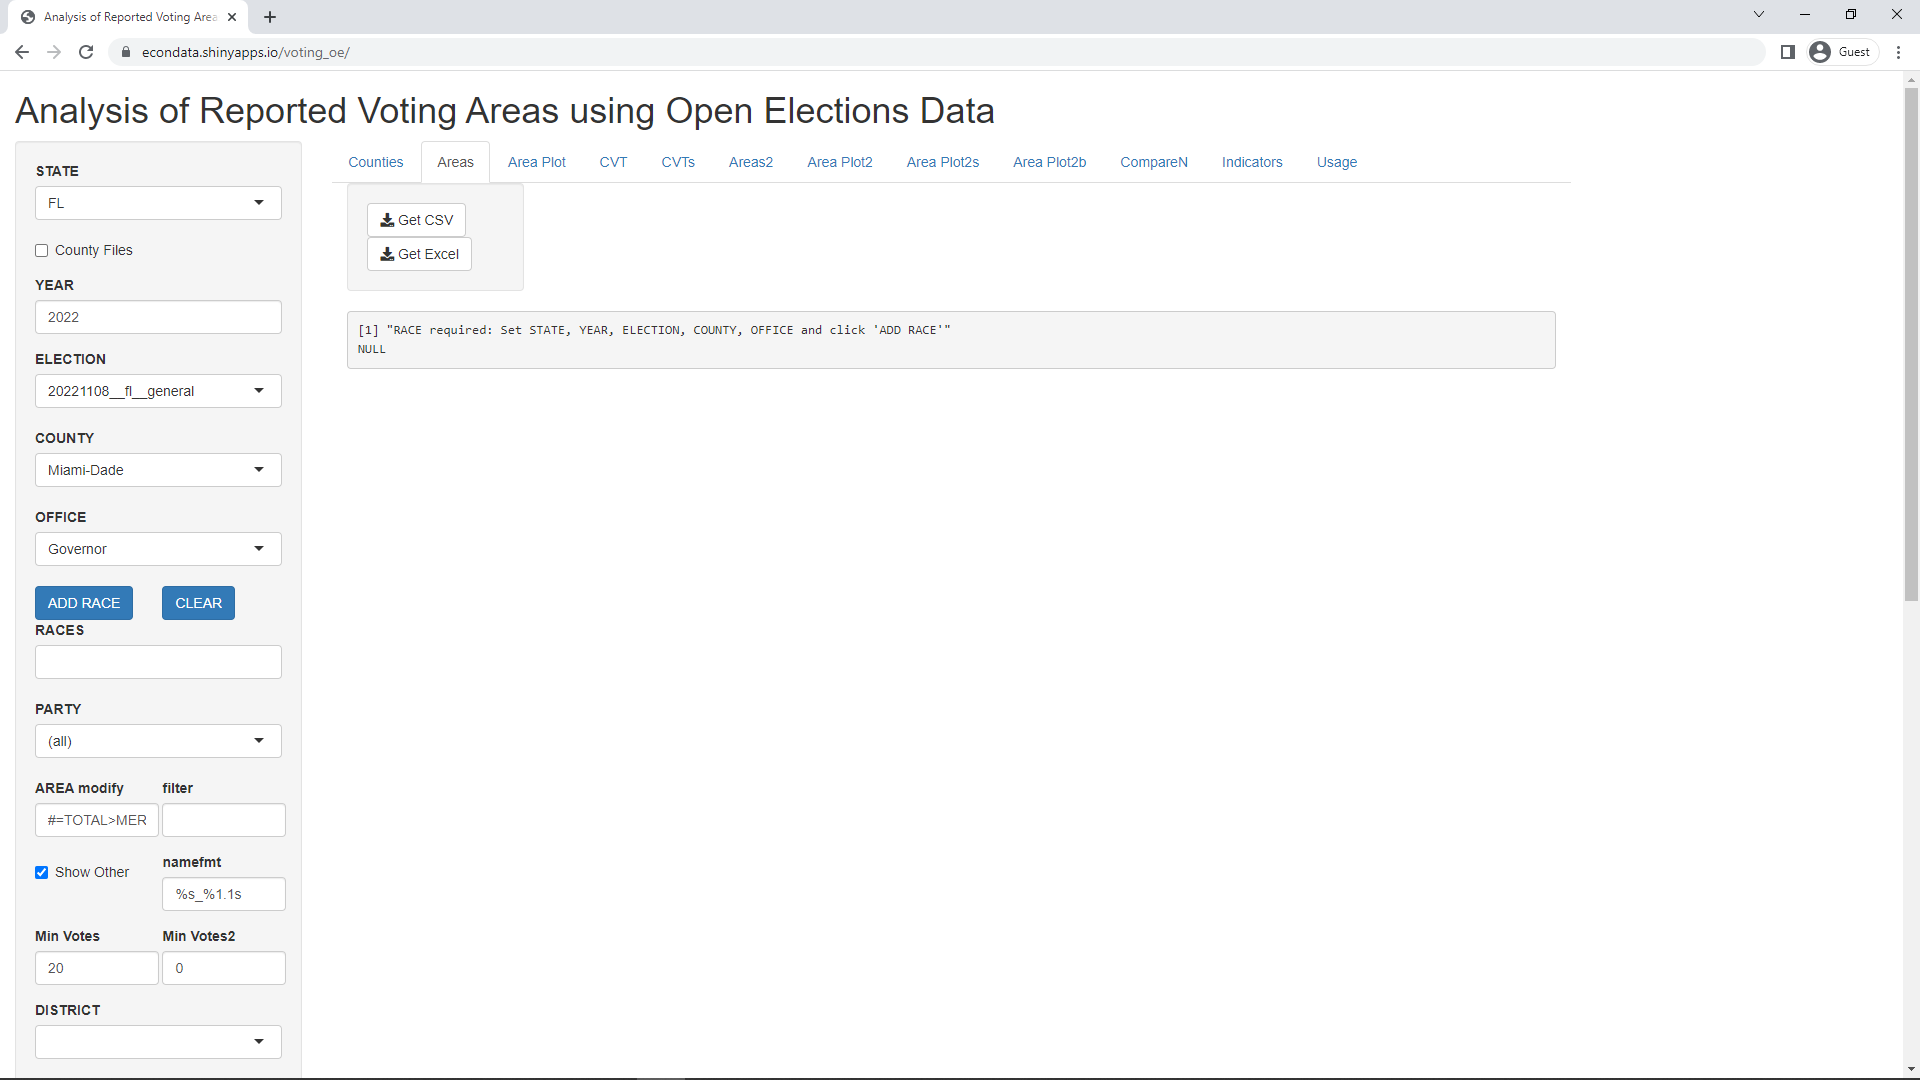
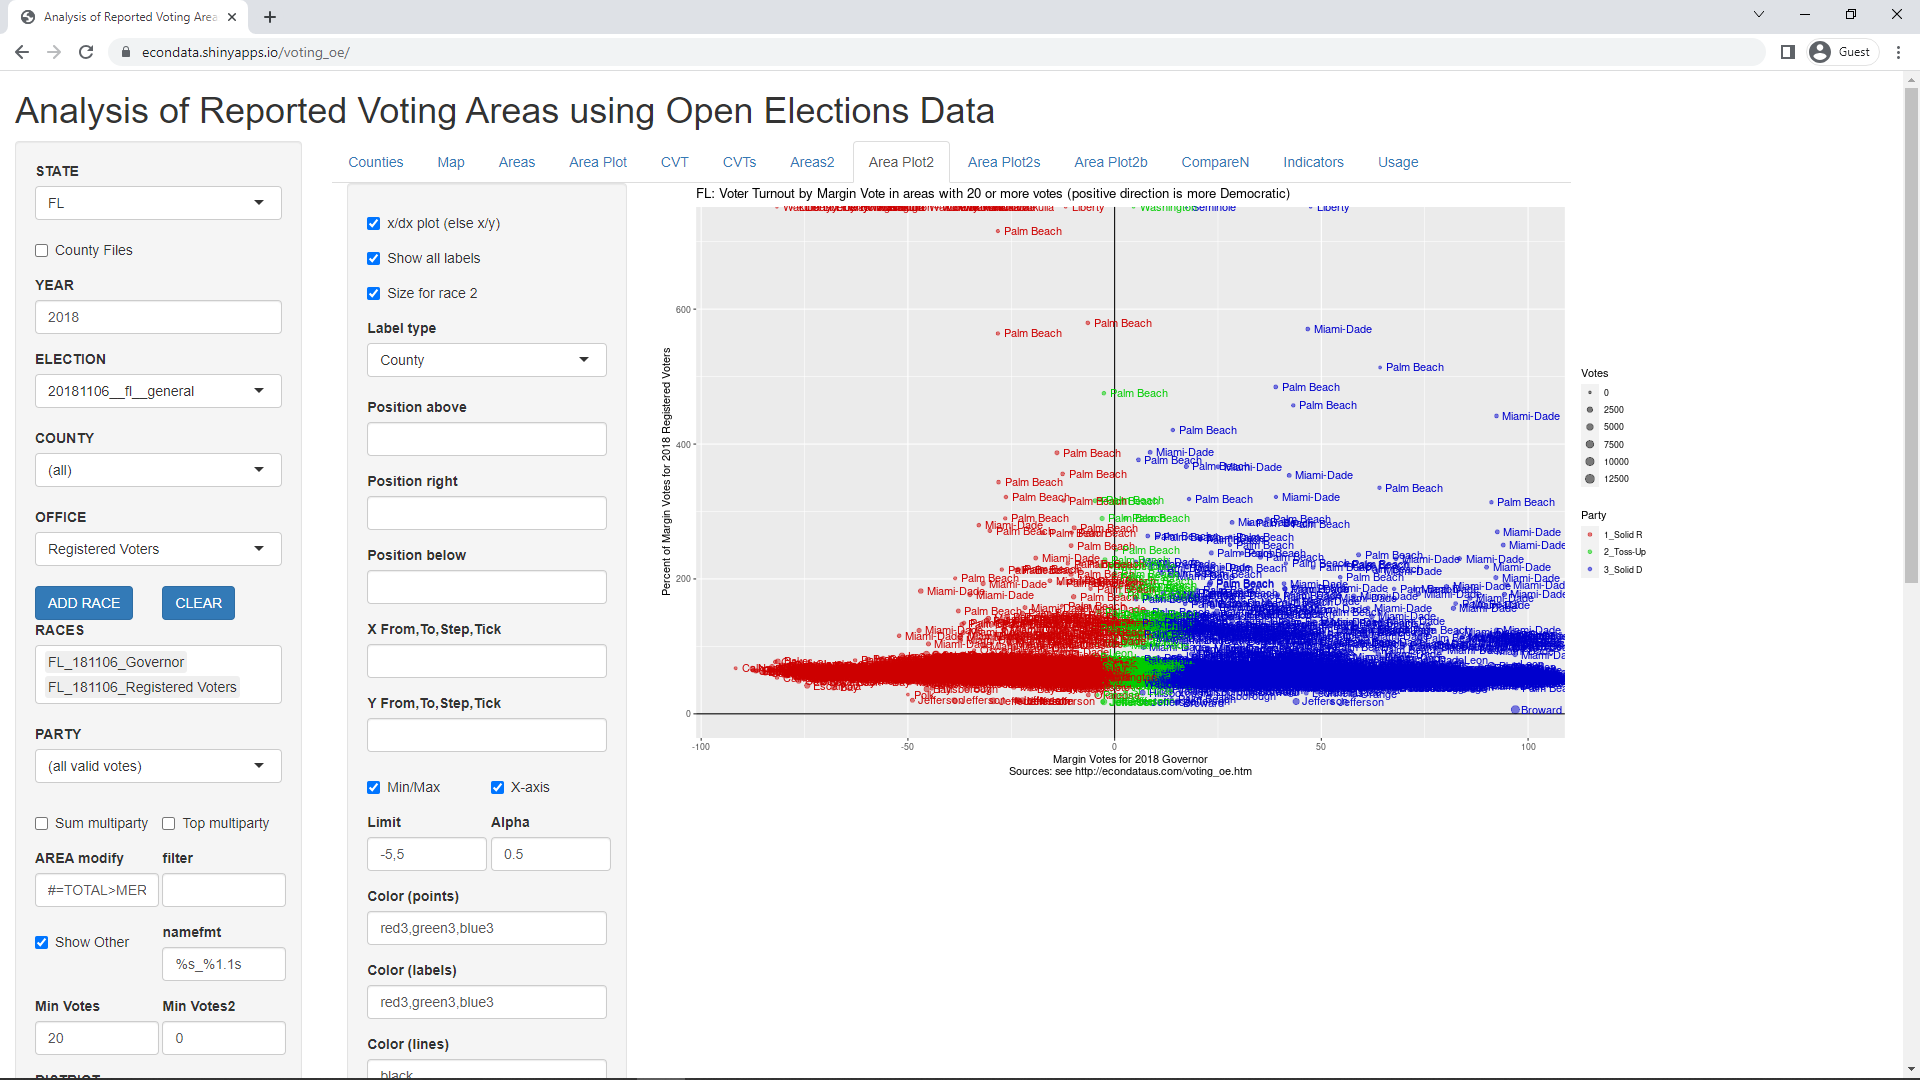
Currently, navigating to https://econdata.shinyapps.io/voting_oe/ will initially display the following page:
The message indicates that the user must select the desired STATE, YEAR, ELECTION, COUNTY, and OFFICE to define an race. The selections must be made in that order and each selection will generally populate the options for the next selection. Upon selection all of those items, click on the "ADD RACE" button to add the defined race to the RACES select box. In this example, the initial selections can be accepted and the user need only click the "ADD RACE" button. This displays the following page:
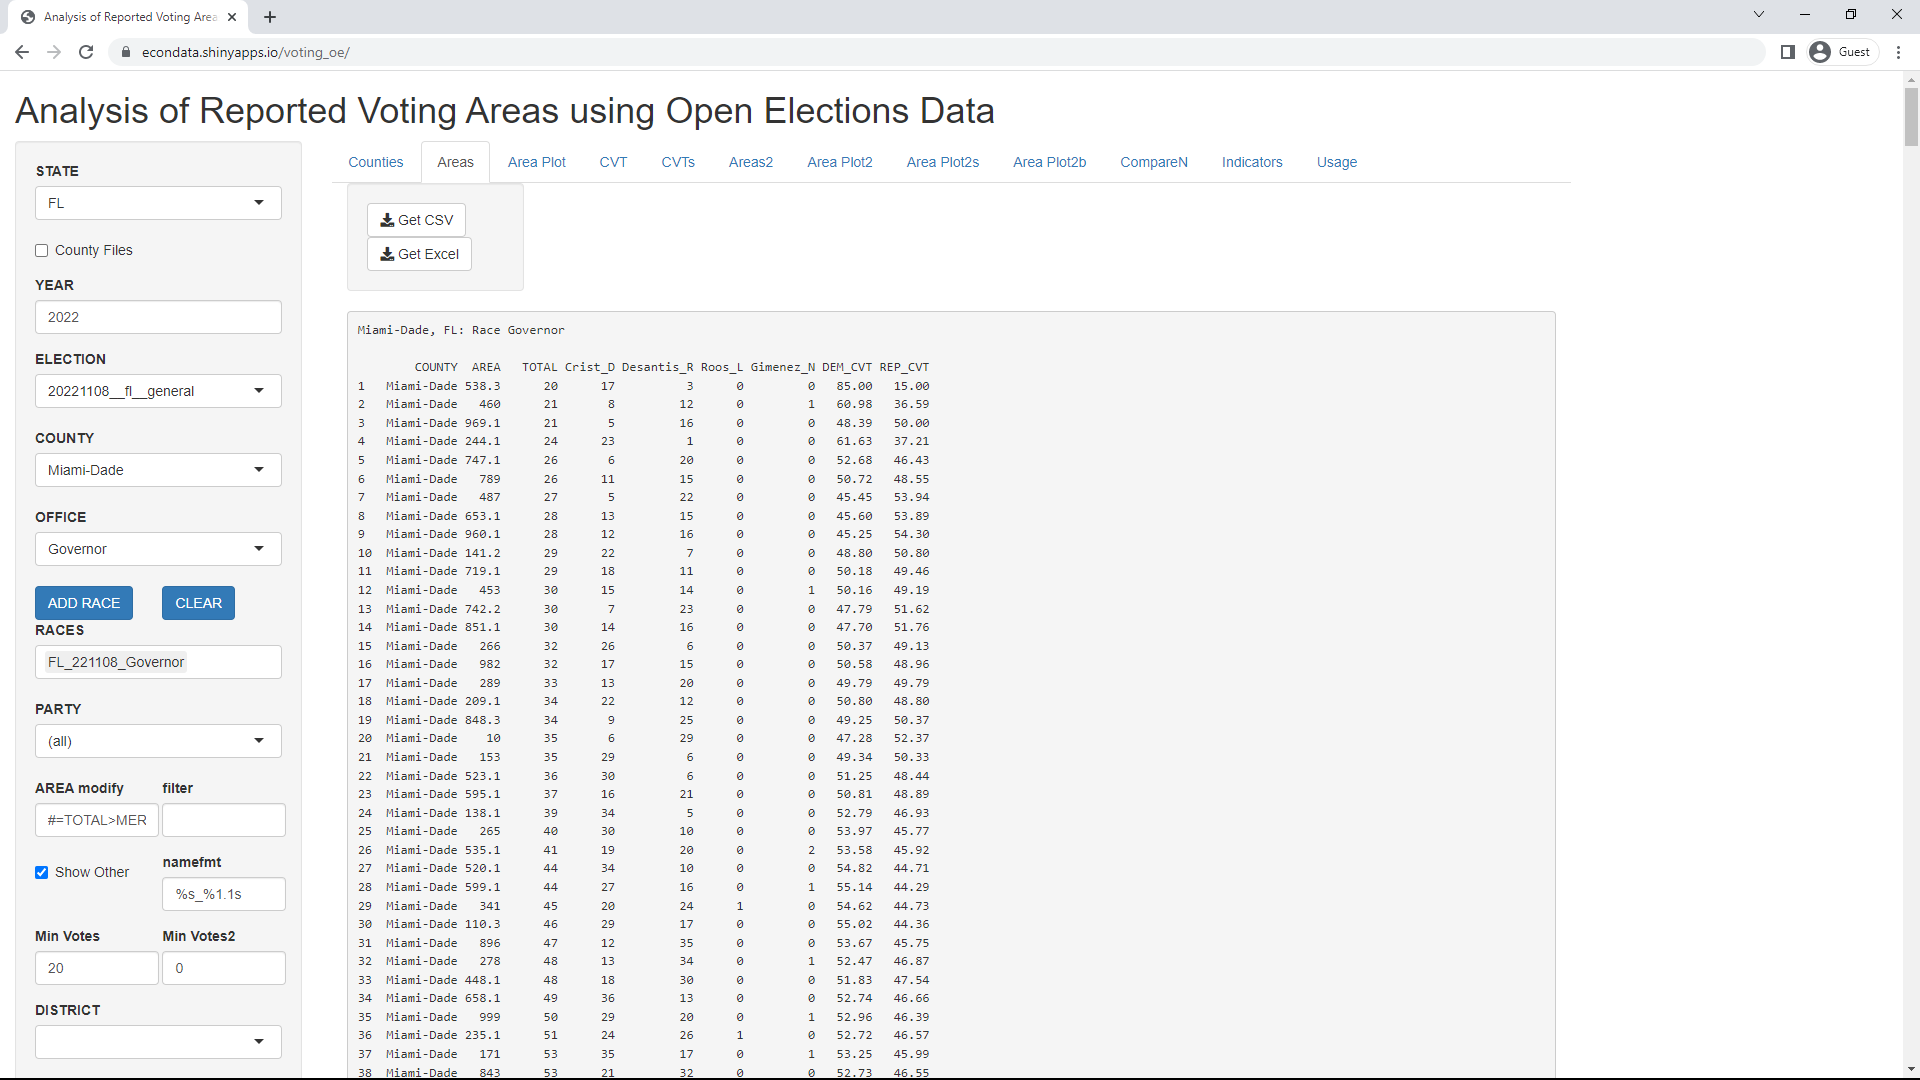
As can be seen, the columns consist of COUNTY, AREA, TOTAL, Crist_D, Desantis_R, Roos_L, Gimenez_N, DEM_CVT, and REP_CVT. COUNTY is Miami-Dade in this case and AREA refers to the precinct names (except for Wisconsin where it refers to the ward names). TOTAL is the total votes and the next four columns are the last names of the candidates followed by an underscore and a character to indicate the party (Democrat, Republican, LPF, and NPA in this case). DEM_CVT and REP_CVT are cumulative vote shares used in CVTs (cumulative vote tallys).
Clicking on the "Area Plot" tab will then display the following page:
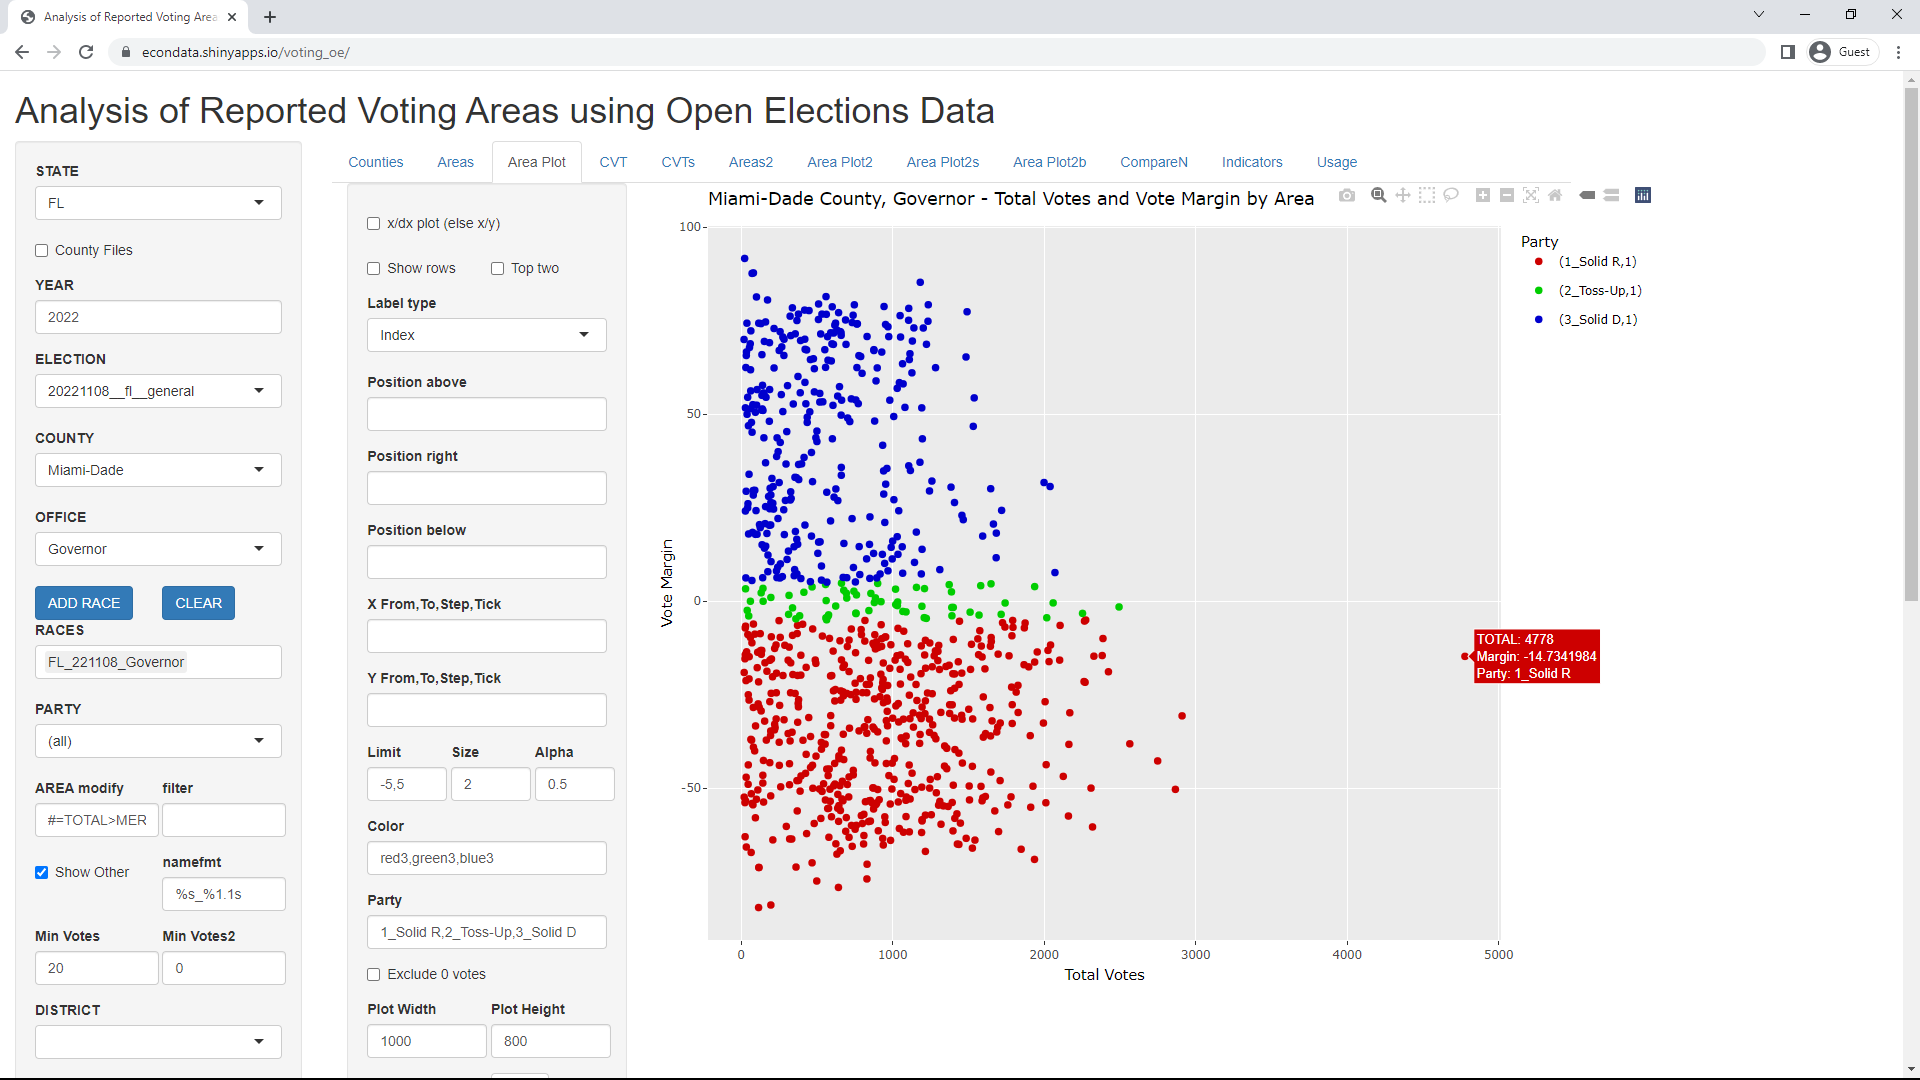
This shows the total votes versus the vote margin in every precinct in Miami in the Governor's race. Hovering over any of the precincts causes a popup to be displayed which shows the total votes and percent margin. That is the cause of the popup visible next to the far right precinct. Looking at the bottom of the list on the Areas tab shows this to be precint 51.
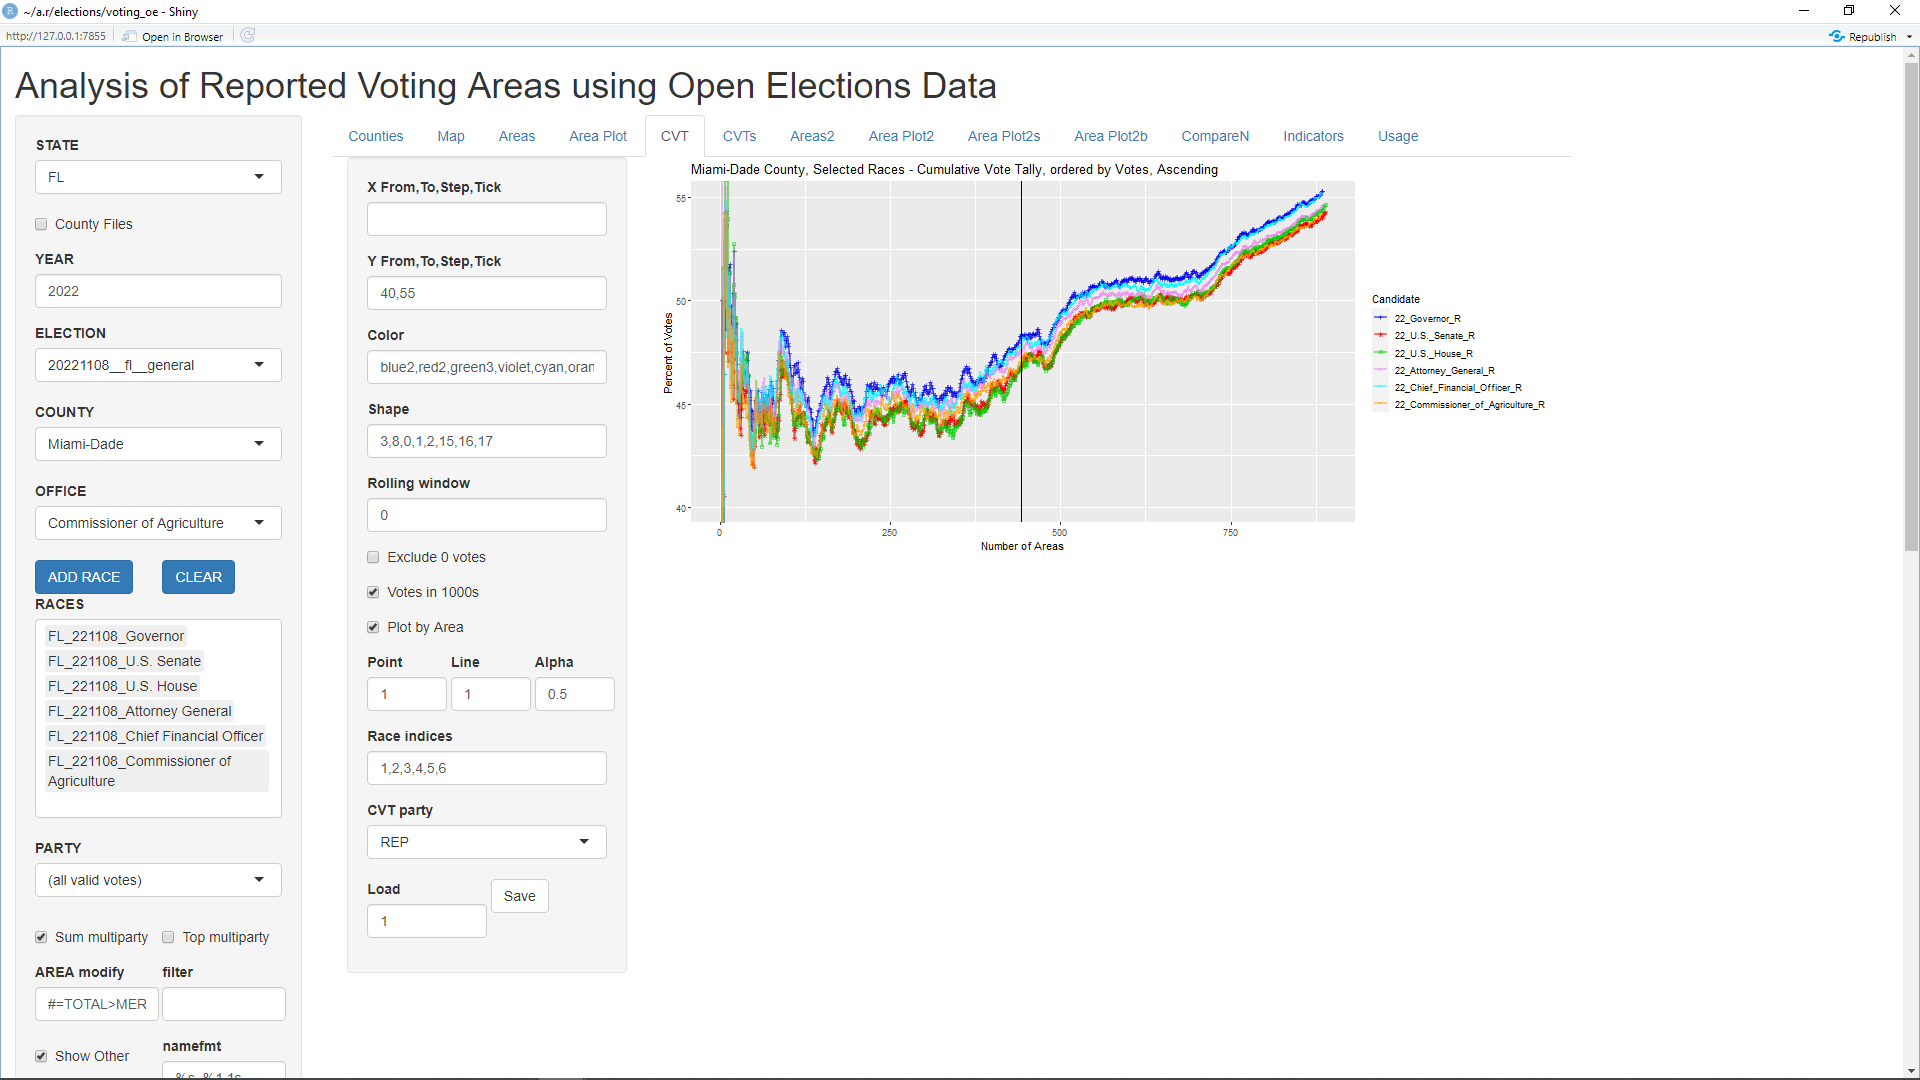
Clicking on the CVT tab will display the following page:
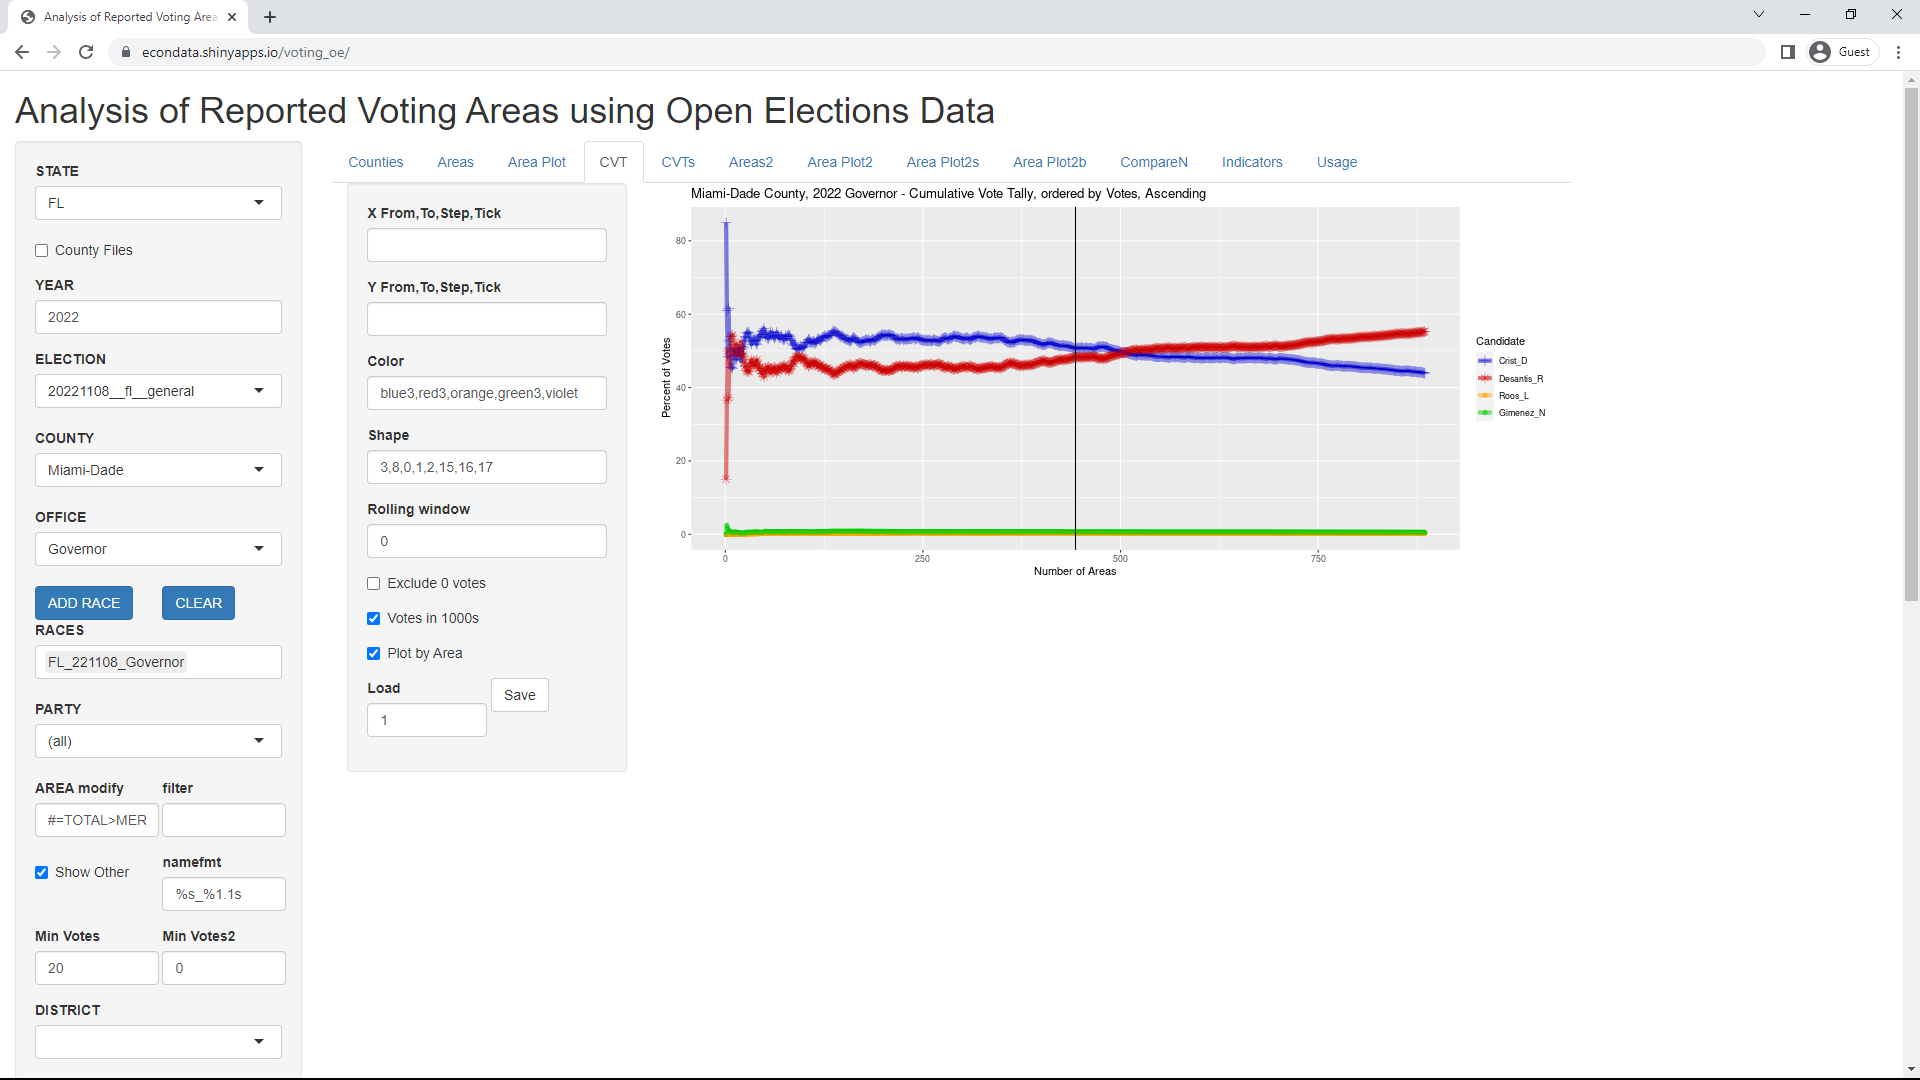
The use of CVTs (Cumulative Vote Tallies) are described at this link. The rising red line in the CVT above indicates that the precincts in Miami with the most votes tend to lean Republican. This can be seen in the prior plot on the "Area Plot" tab which seems to show more votes, on average, in the red Republican precincts than in the blue Democrat precincts.
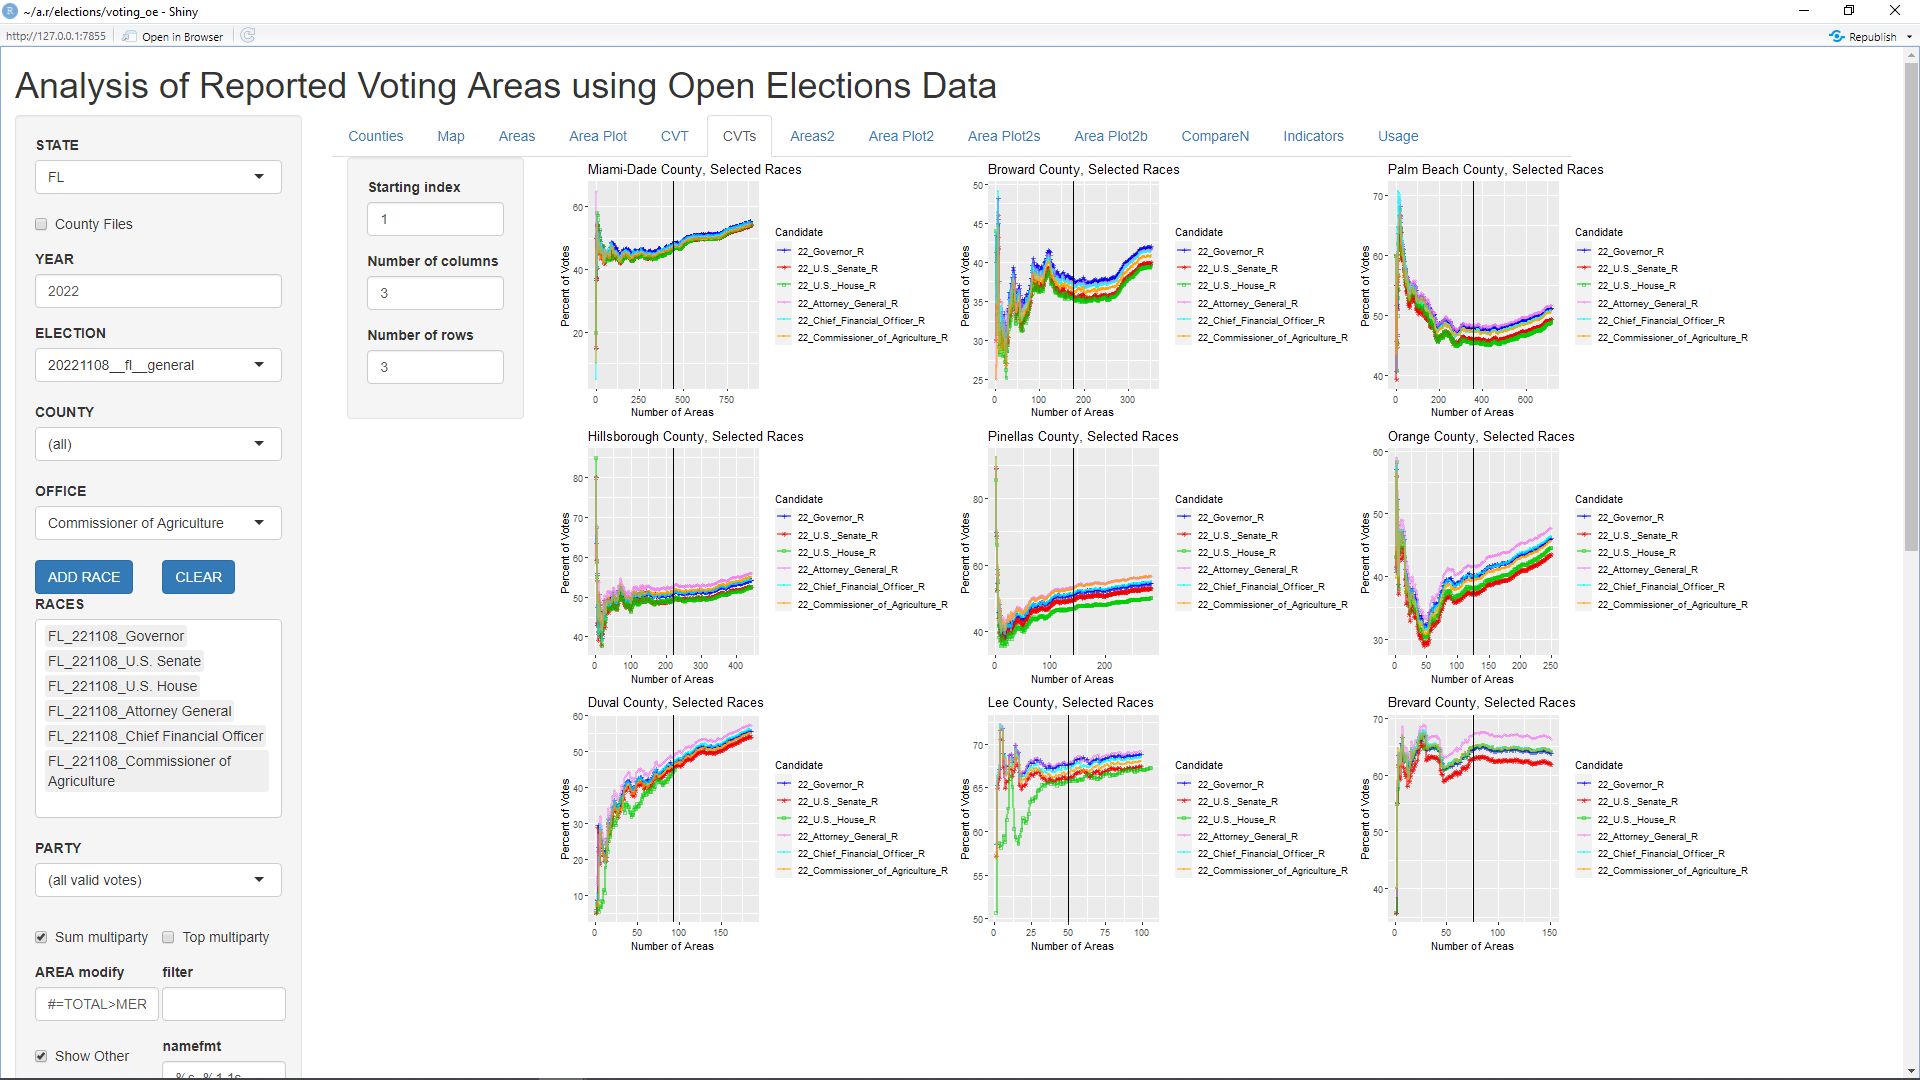
Clicking on the CVTs tab and changing COUNTY to (all) will display the first 9 counties alphabetically. In order to display the 9 counties with the most votes, change the "Sort Counties" select box from COUNTY to VOTES. This will cause the following 9 counties to display:
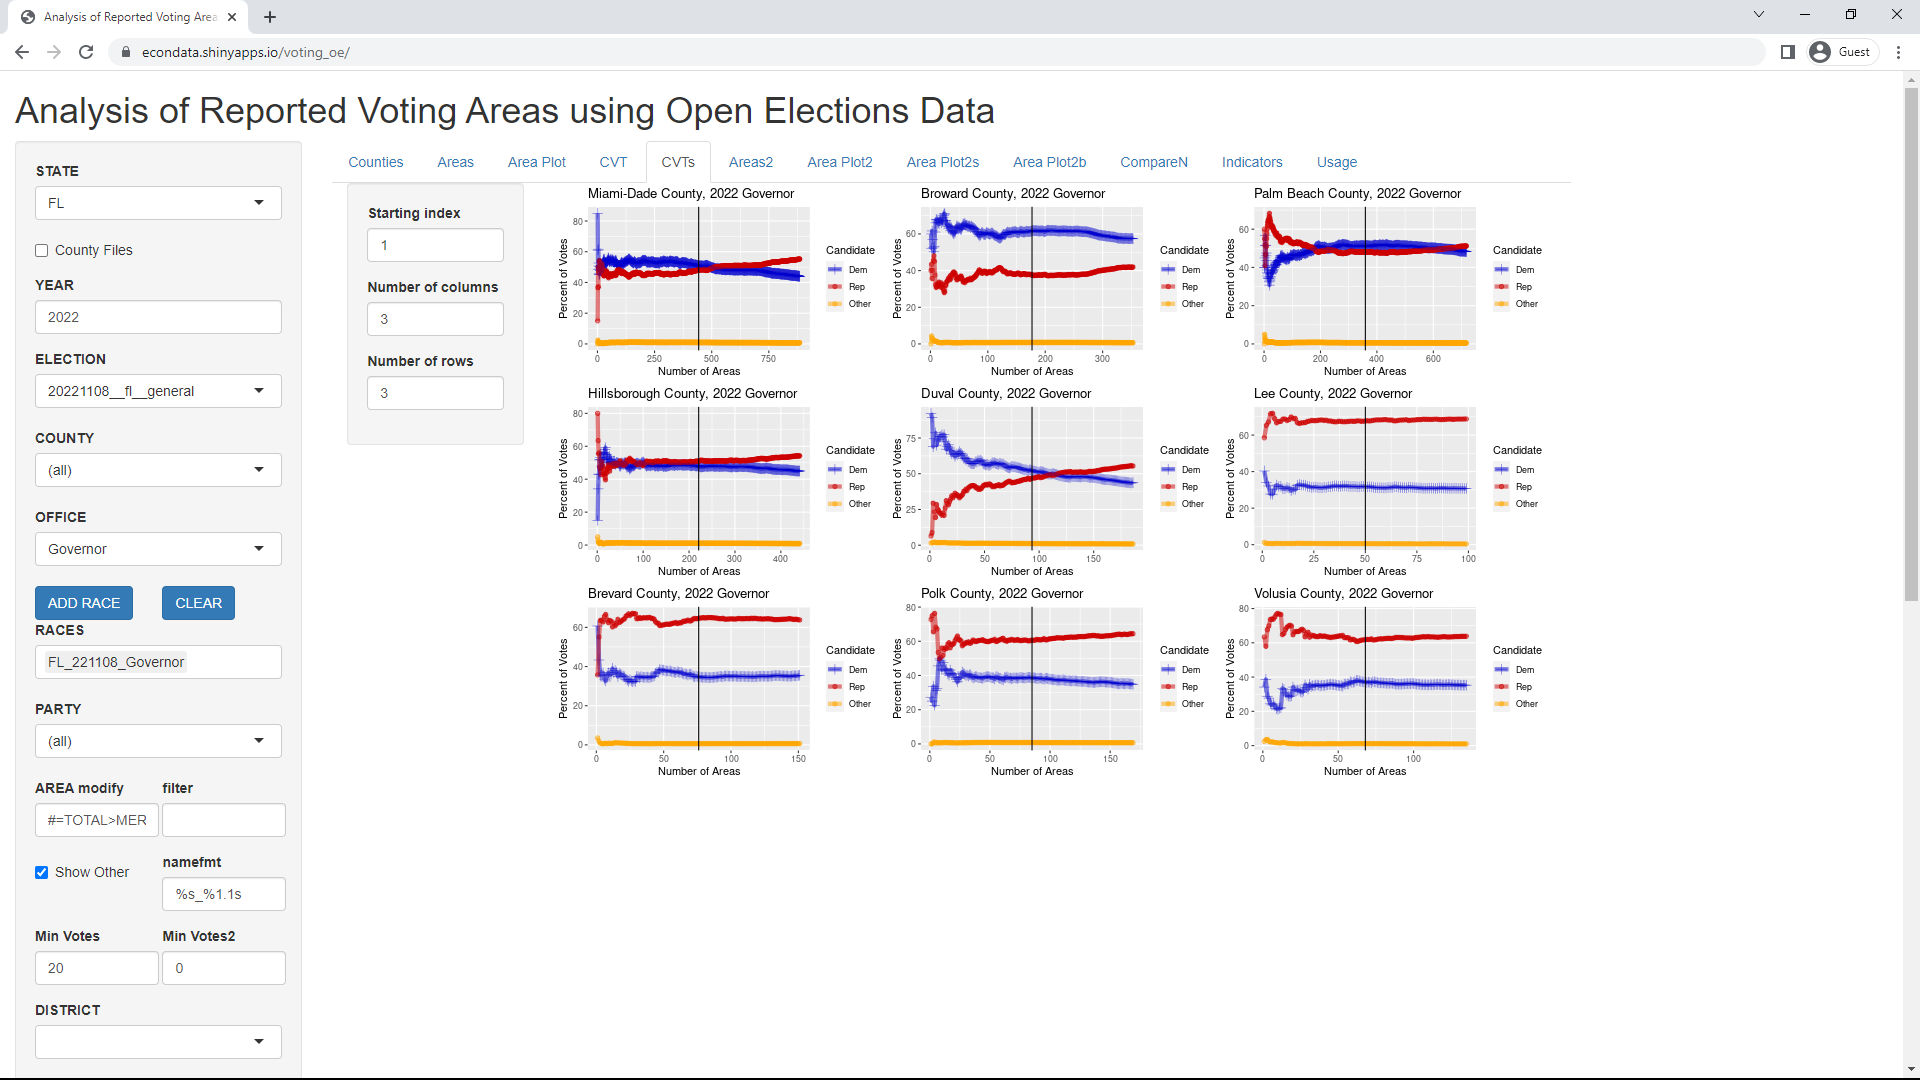
As can seen, the red line tends to slope up in each of the 9 counties except for Lee and Brevard and slopes up very slightly in Volusia County. The steepest slope seems to be in Duval County.
Analyzing Voter Turnout and Registration
Analyzing the Turnout of a Single Race
The turnout of a single race can be displayed via the following steps:
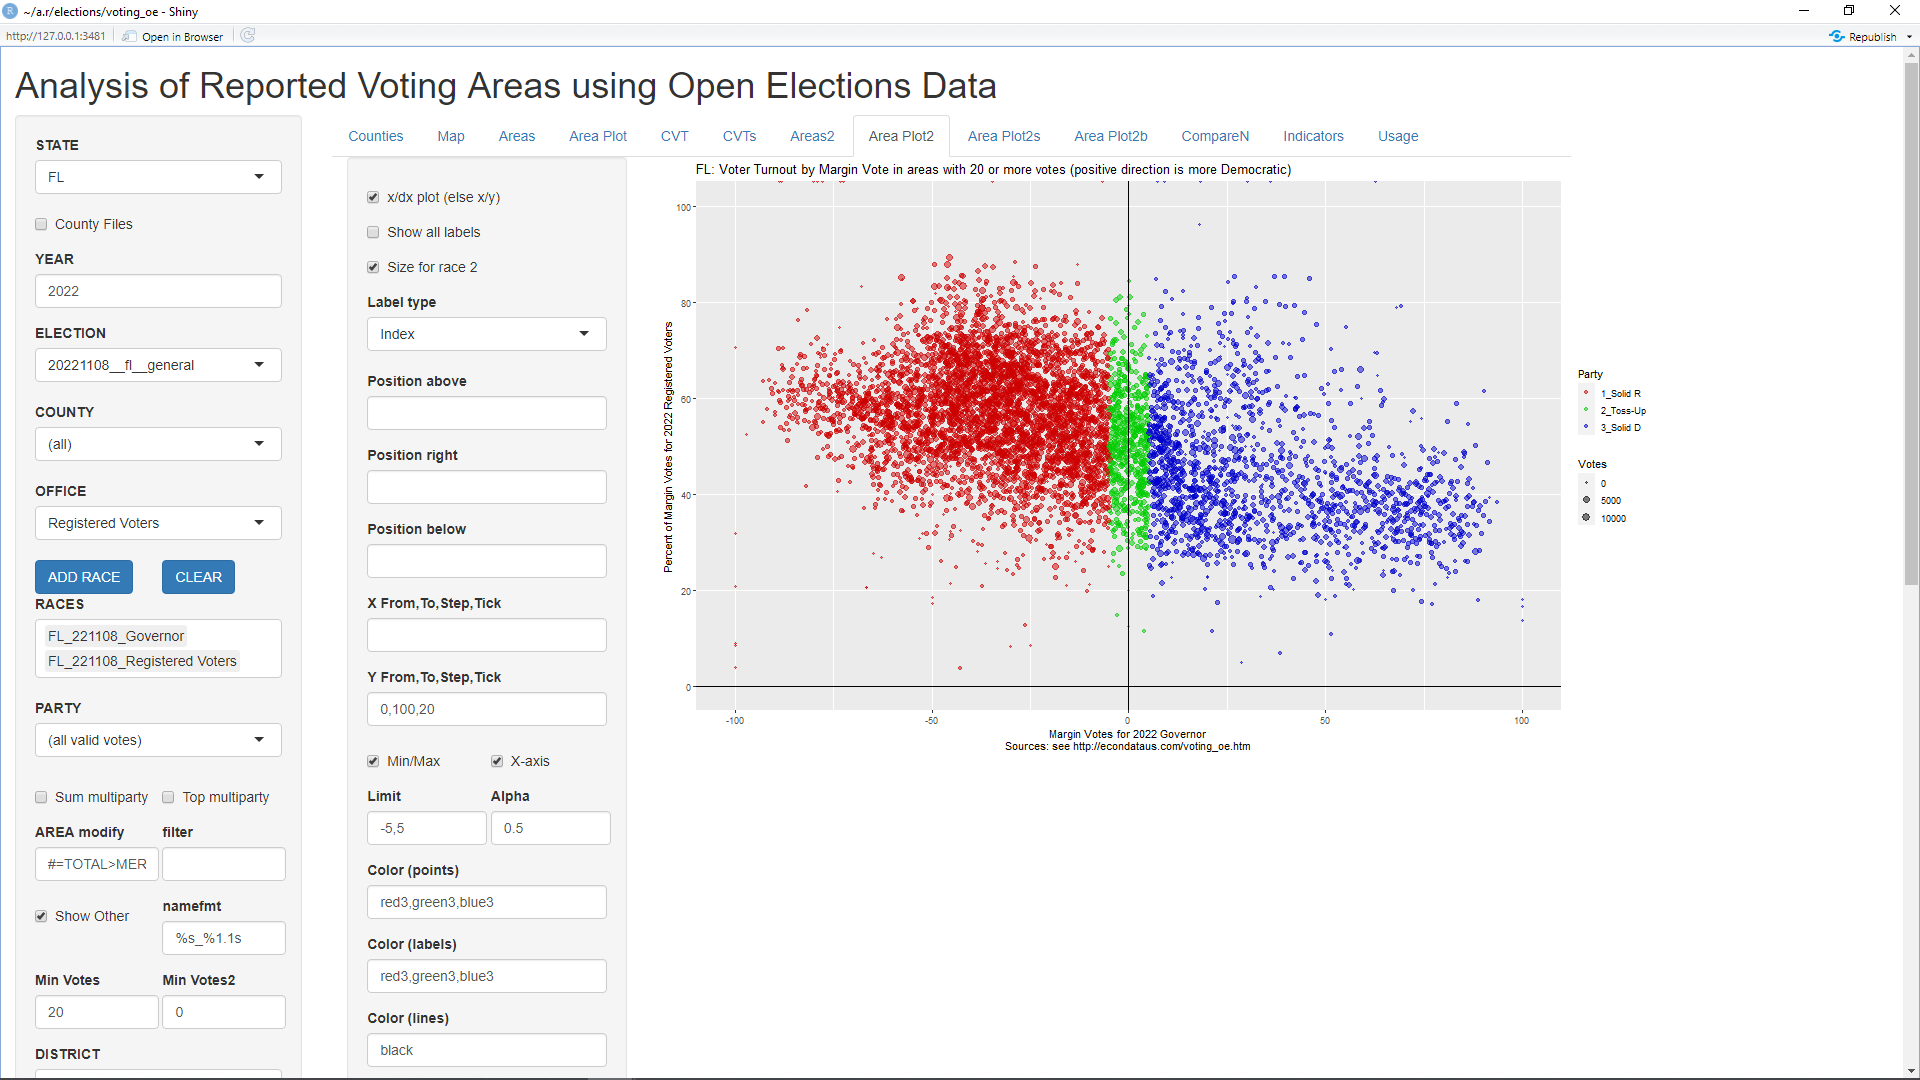
The y-axis shows the turnout in every precinct and is calculated by dividing the total votes by the total number of registered voters in each precinct. This should be fairly accurate in Florida because a Florida statute described at this link states the following:
A person is not permitted to vote in any election precinct or district other than the one in which the person has his or her legal residence and in which the person is registered.
However, the statute goes on to list some exceptions such as if the voter has recently moved and some other conditions are satisfied. In any case, the plot seems to show a higher average turnout in solid Republican (red) precincts than in solid Democratic (blue) precincts. In fact, the turnout seems to average closer to 60 in the solid Republican precincts but closer to 40 in the solid Democratic precincts.
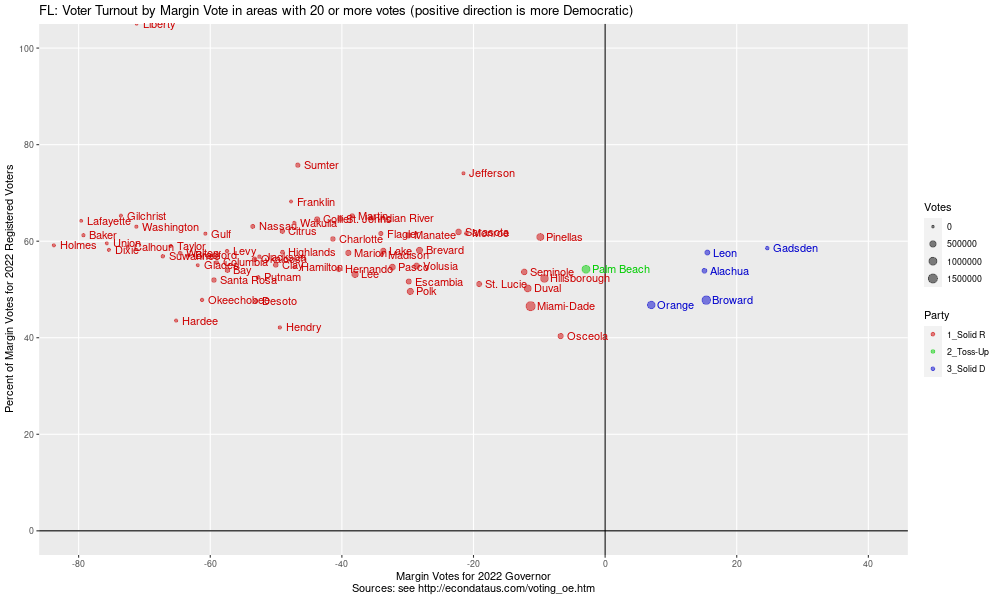
The plot can be changed to show the turnout by county via the following steps:
This will display the following plot:
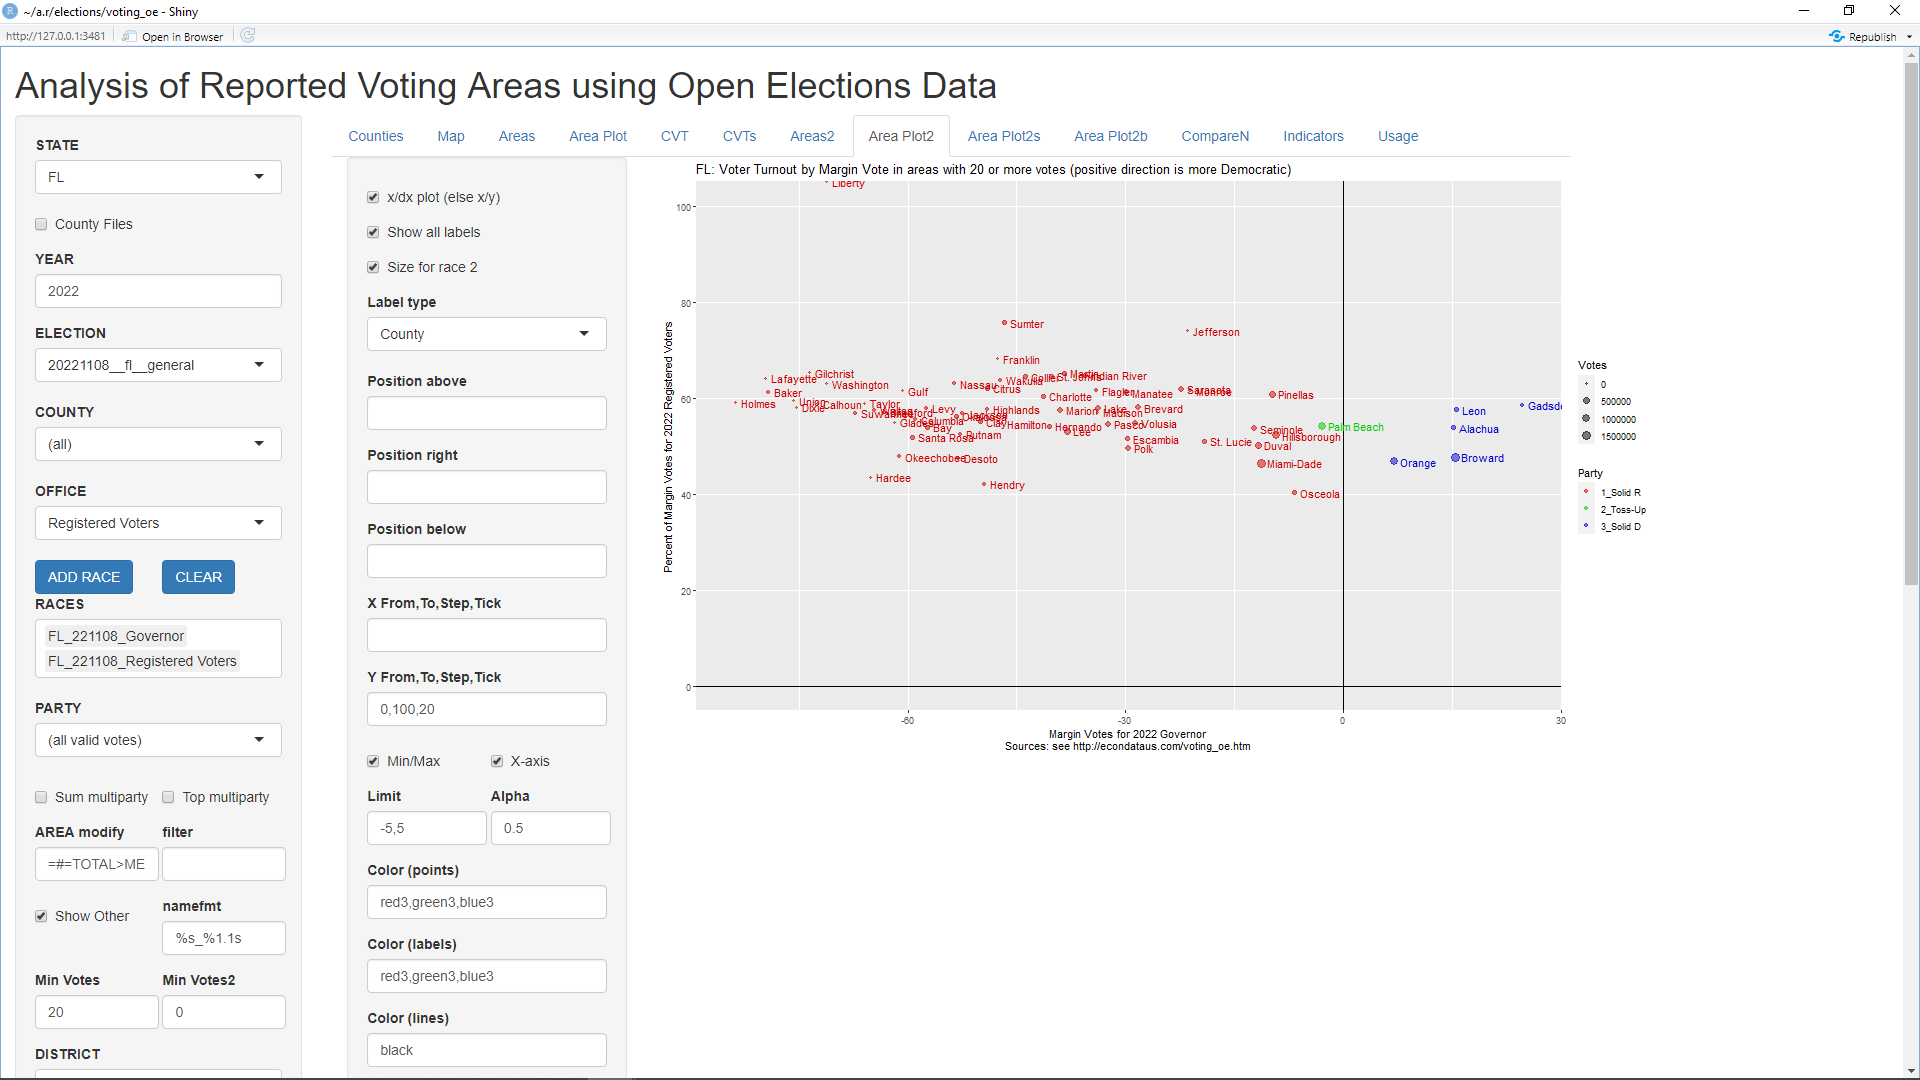
As can be seen, the turnout still looks to be higher on average in solid Republican precincts but not by quite as much. The turnout seems to average just under 60 in the solid Republican precincts and just under 50 in the solid Democratic precincts. By the way, Liberty County appears at the very top of the plot because the number of registered voters in that county is listed as zero, producing an infinite turnout. This can be seen by clicking on the Areas2 tab.
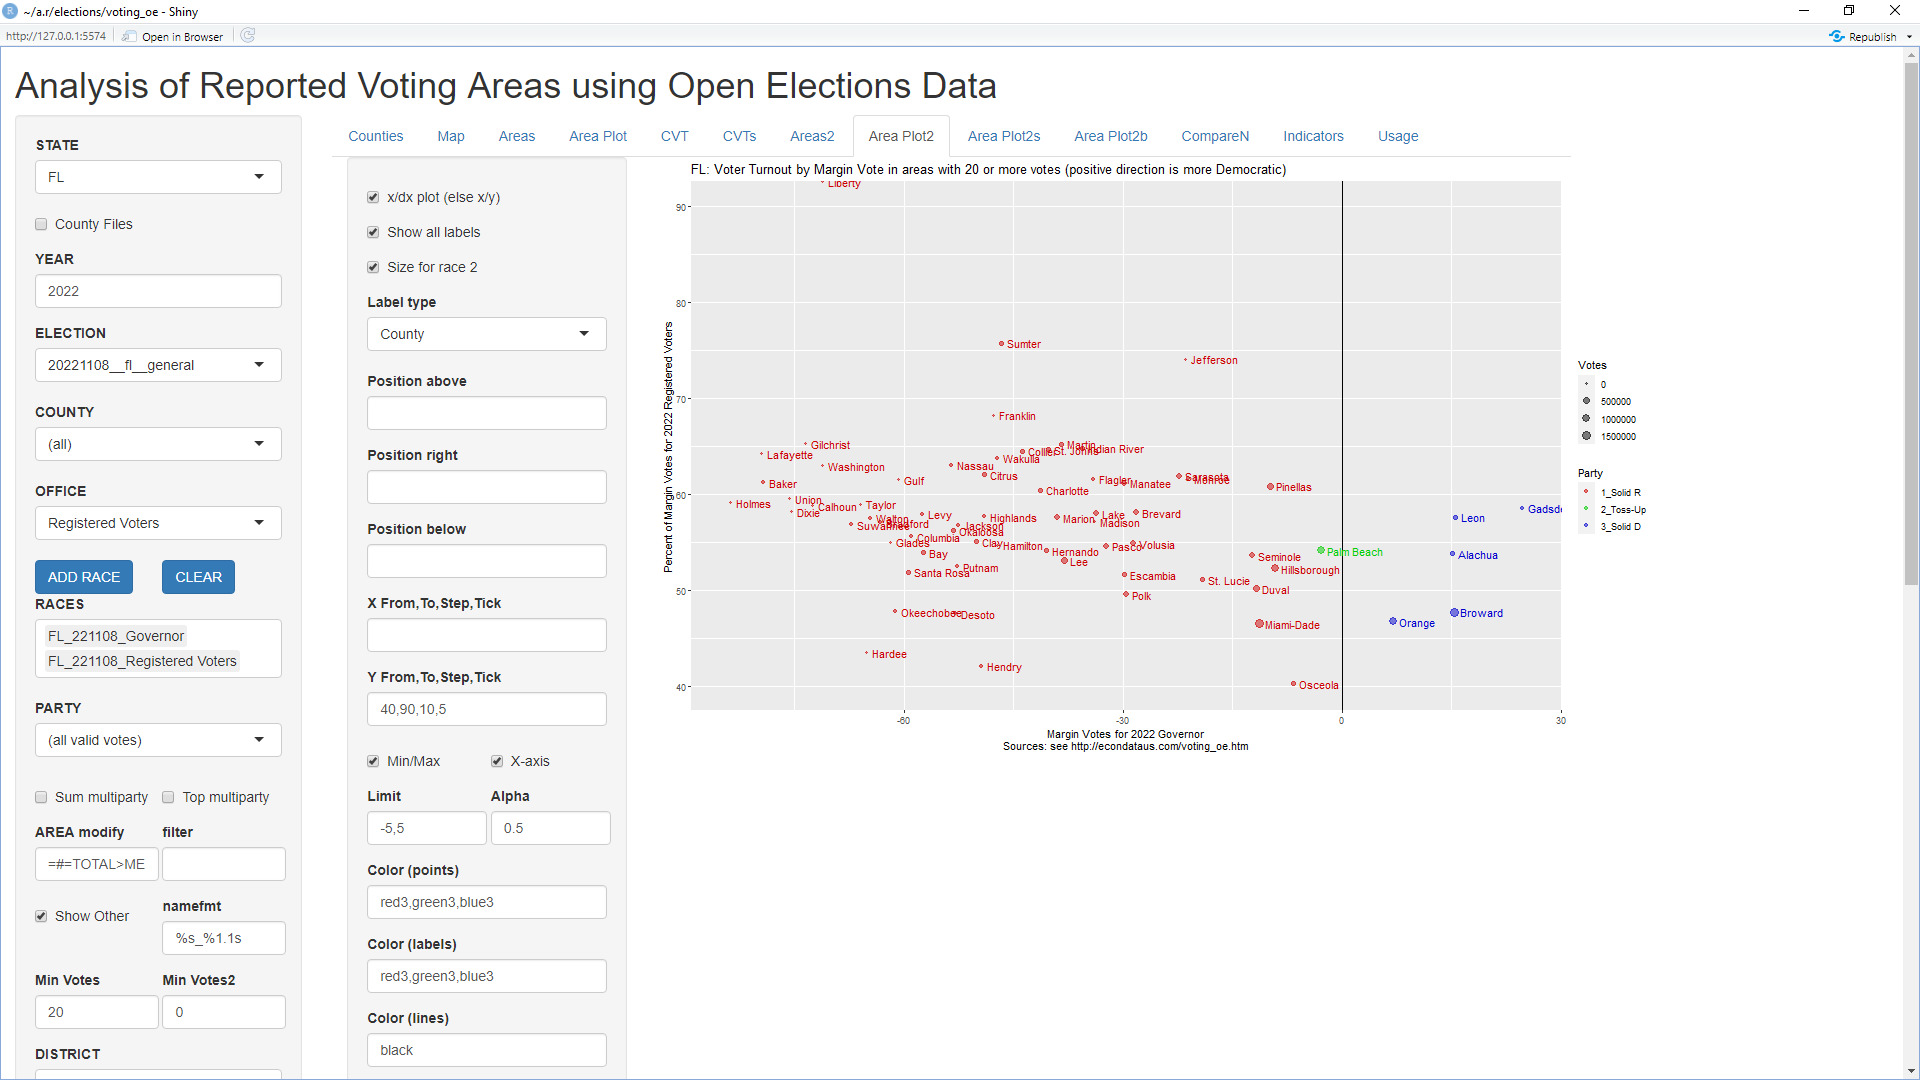
Changing the "Y From, To, Step, Tick" text box to "40,90,10,5" makes the differences in turnout a little more visible, displaying the following plot:
Using this same scale but looking at the Presidential race in 2020 displays the following plot:
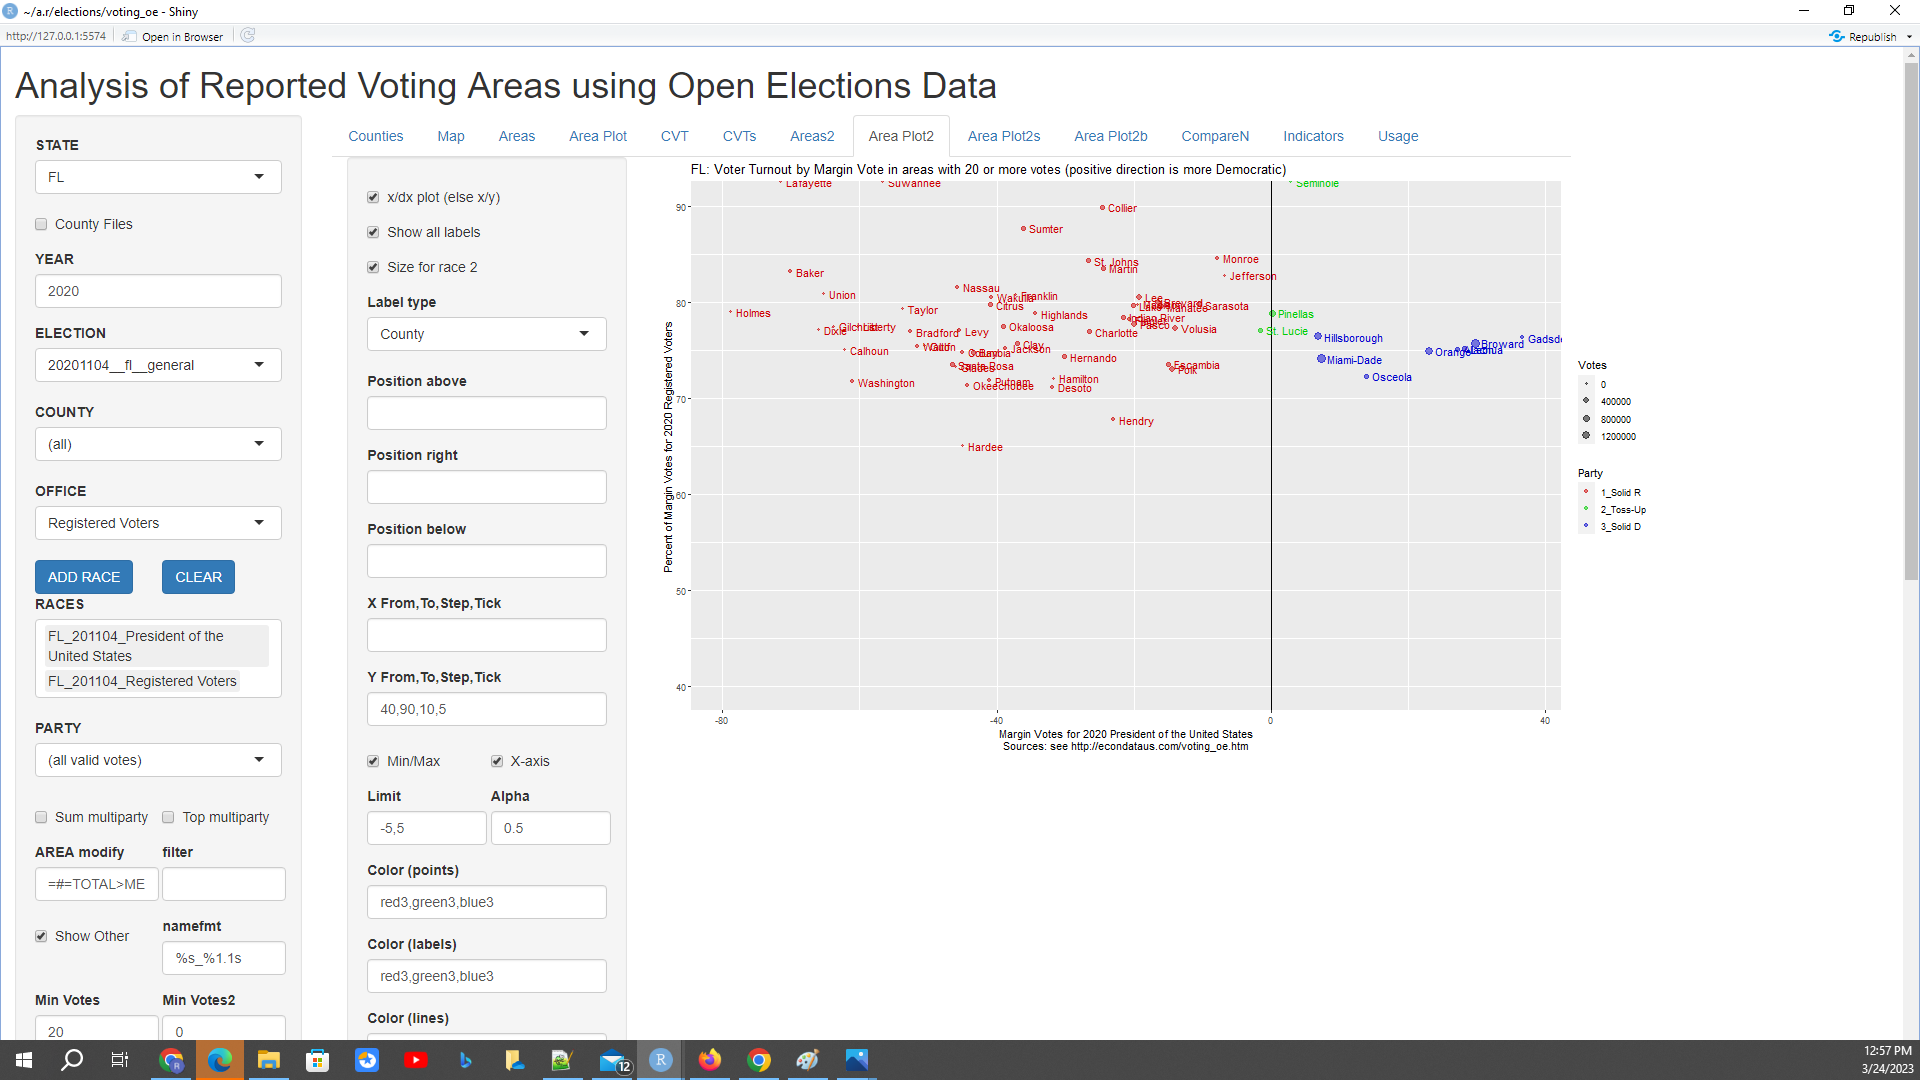
Comparing this to the previous plot shows that the turnout in the 2020 Presidential election was higher than the 2022 Governor race, on average. This is not a surprise. However, it again looks to be higher on average in solid Republican precincts. The turnout looks to average about 75 in solid Democratic precincts but a few points more than that in solid Republican precincts. However, this does seem to be a bit less of a difference than in the 2022 Governor race.
Going back to the first plot in this section which shows the turnout by all precincts in Florida, it's very easy to look at precinct turnout by county. Simply changing the "Sort Counties" select list to VOTES and clicking the "Area Plot2s" tab will display the following plots:
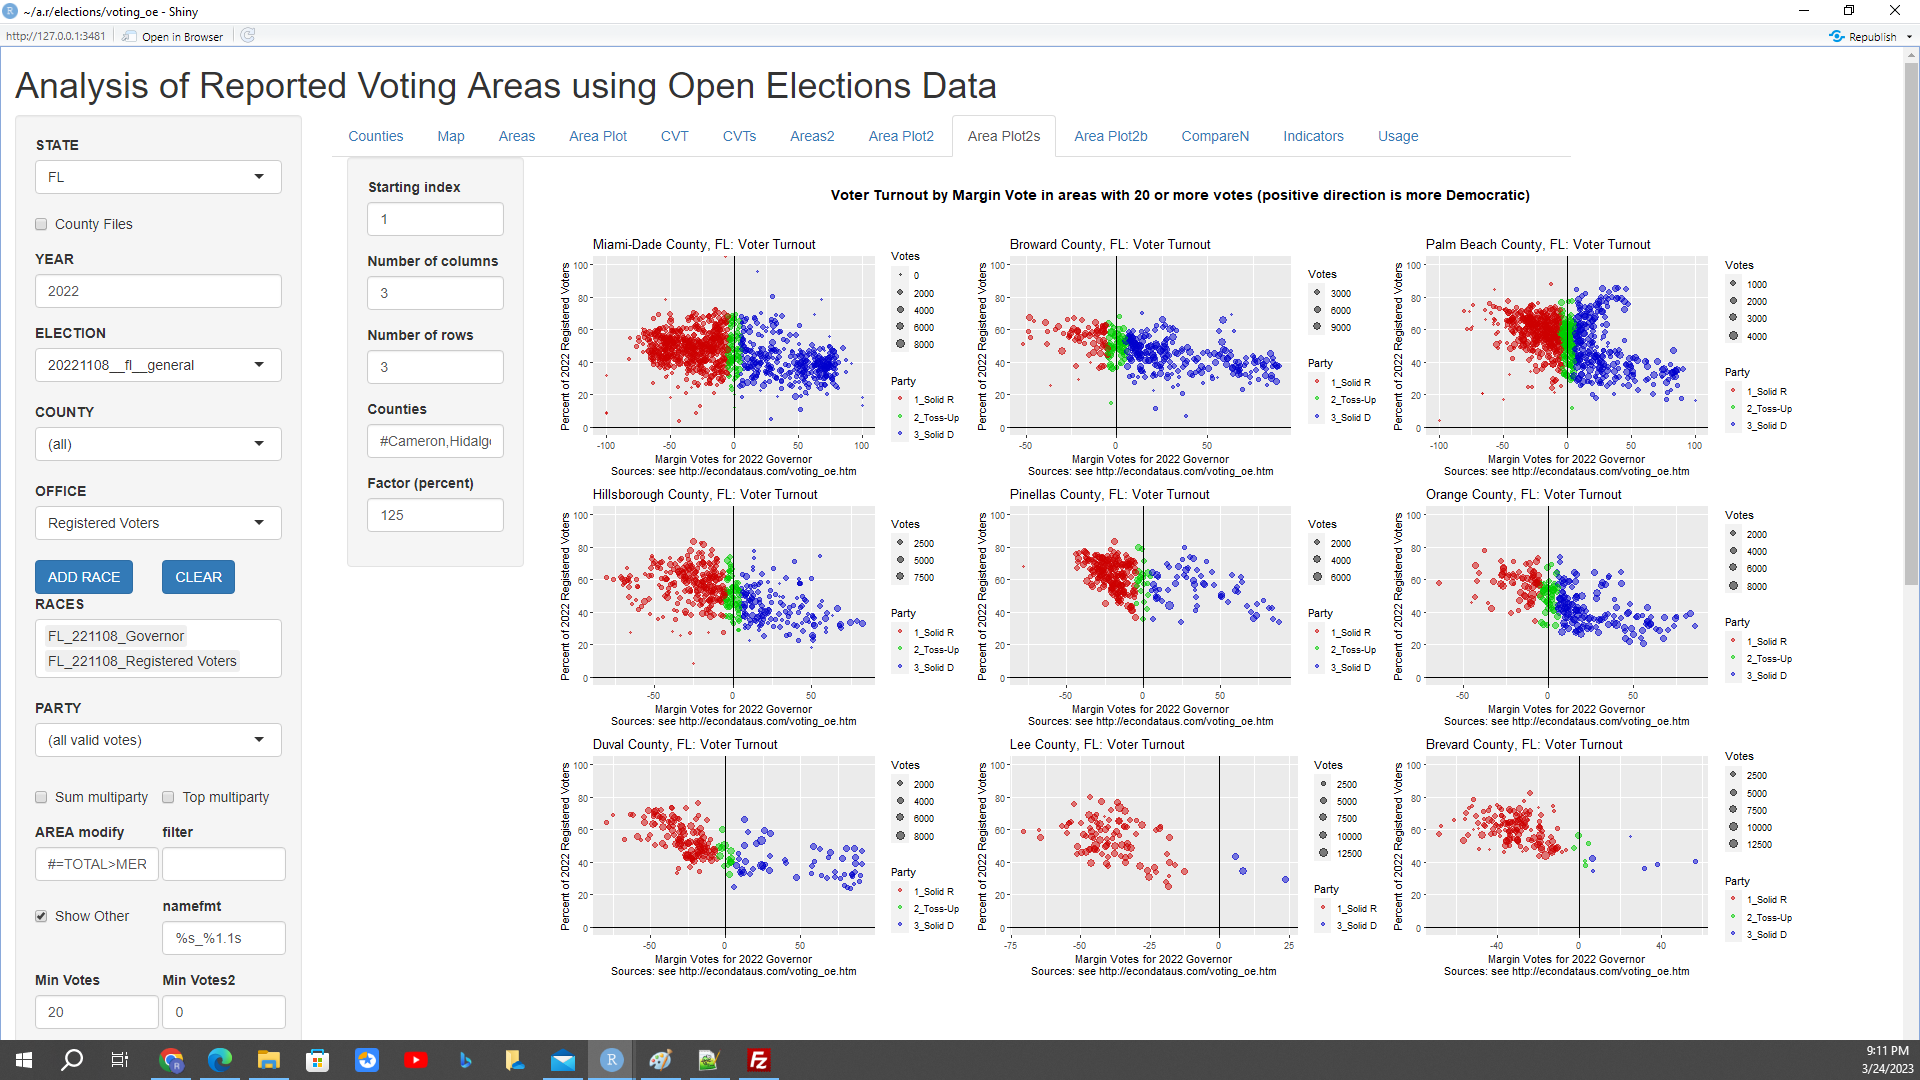
As can be seen, solid Republican turnout looks visibly higher than solid Democratic turnout in Miami-Dade County. However, that difference seems much more noticeable in others of the top 9 counties.
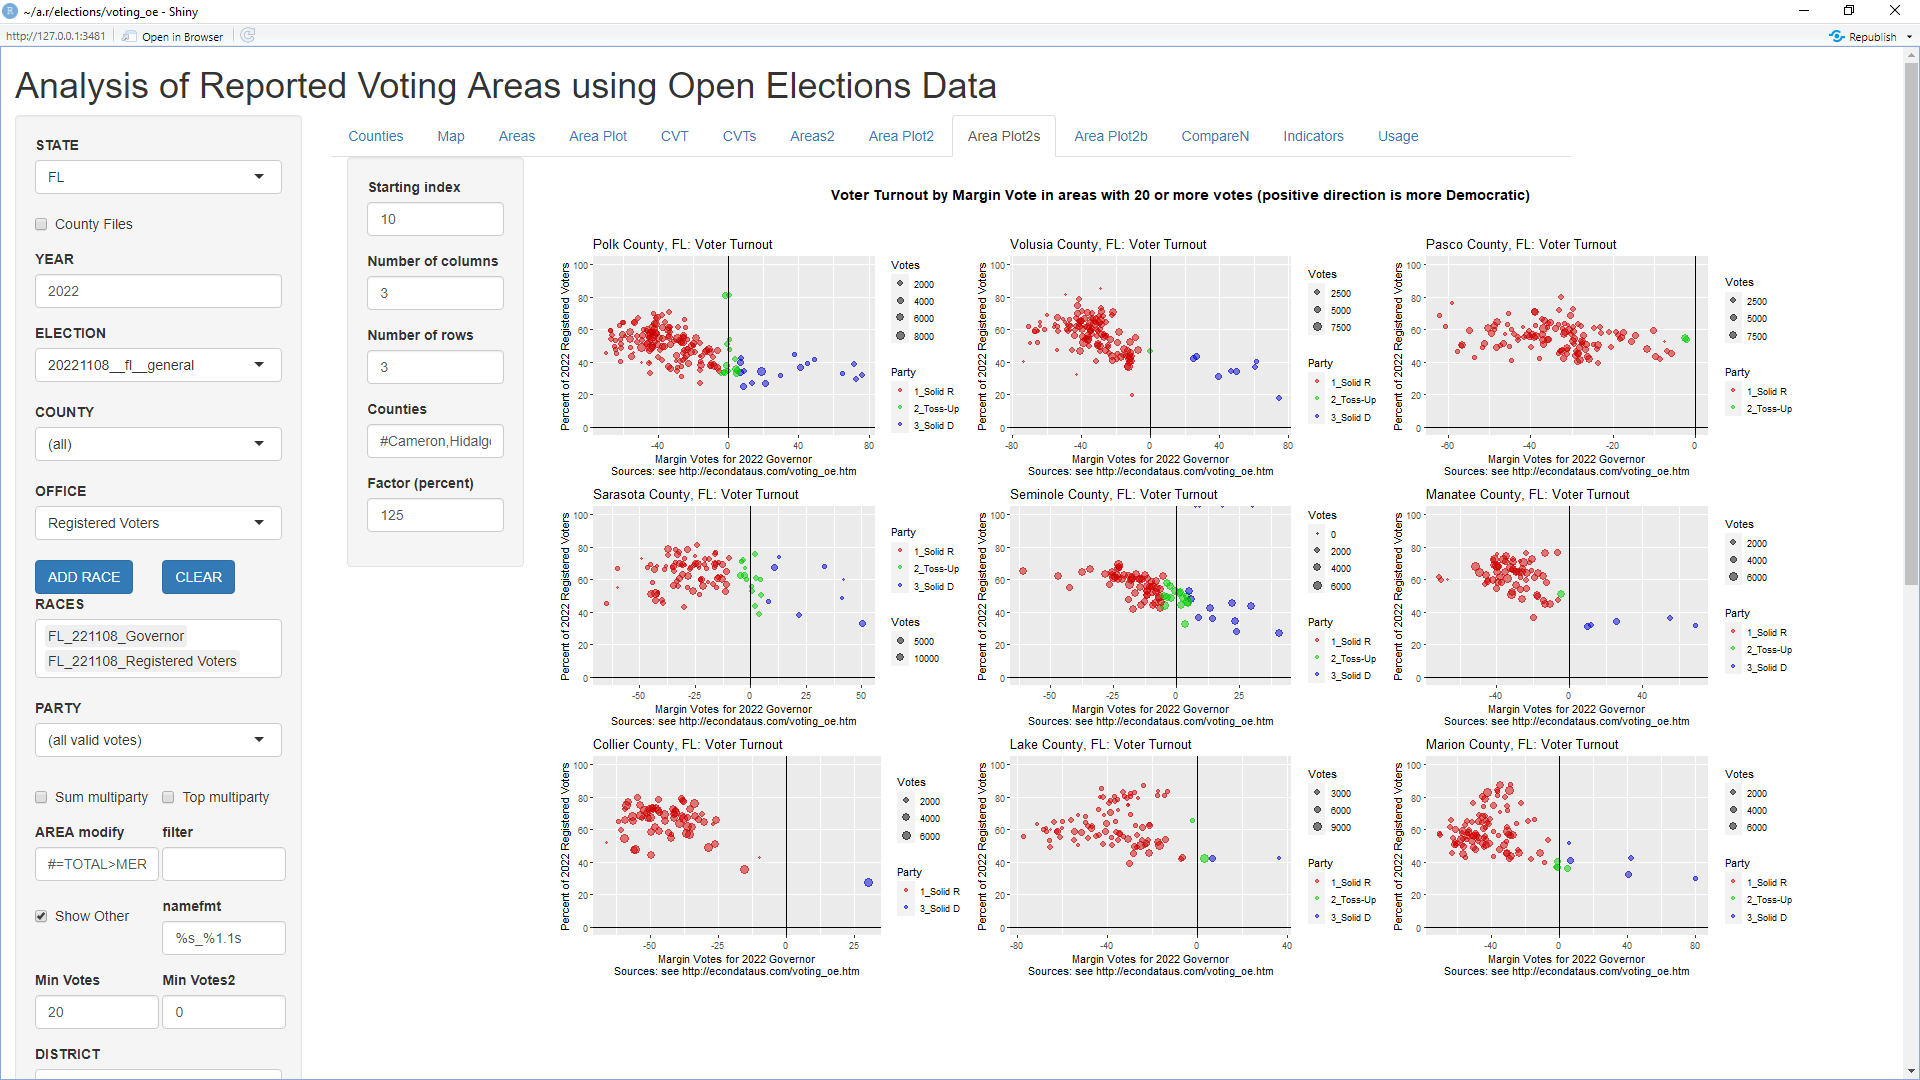
Clicking the up arrow on the "Starting index" input changes that index from 1 to 10 and displays the second 9 counties as follows:
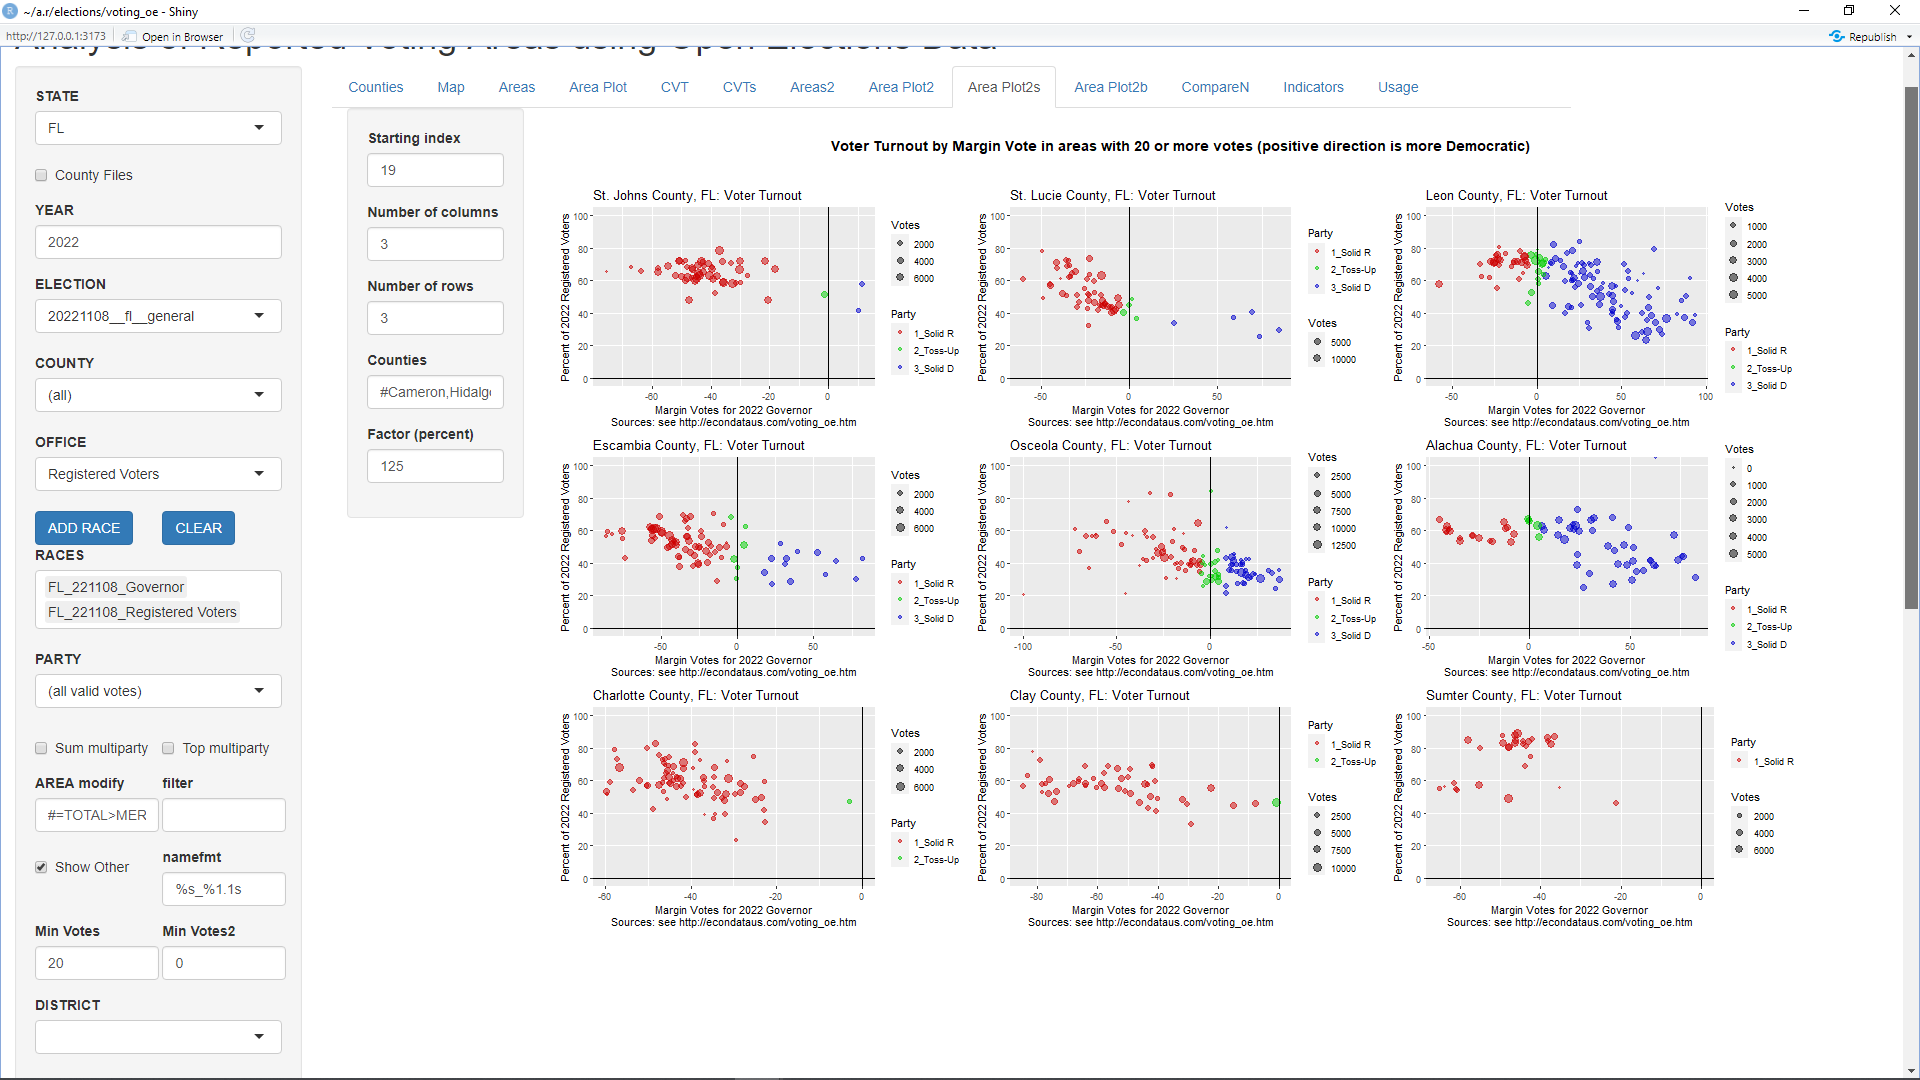
Clicking the up arrow again changes that index to 19 and displays the third 9 counties as follows:
Comparing the Turnout of Two Races
The turnout of a for the 2018 Governor's race in Florida can be displayed via the following steps:
As can be seen, the turnout for the majority of precincts is less than 100 percent as expected. However, there are many precincts that have higher turnouts. Those at the very top of the plot (such as Liberty, Seminole, and Washington) were found to be precincts for which the data contained zero for the number of registered voters, resulting in a turnout of infinity. Those precincts below the top but above 100 percent appear to be chiefly in Miami-Dade and Palm Beach counties. It would seem likely that these counties allowed voting and/or the counting of votes to take place in precincts other than where the voter was registered in 2018. The following steps will focus in on those precincts with turnouts less than 100 percent:
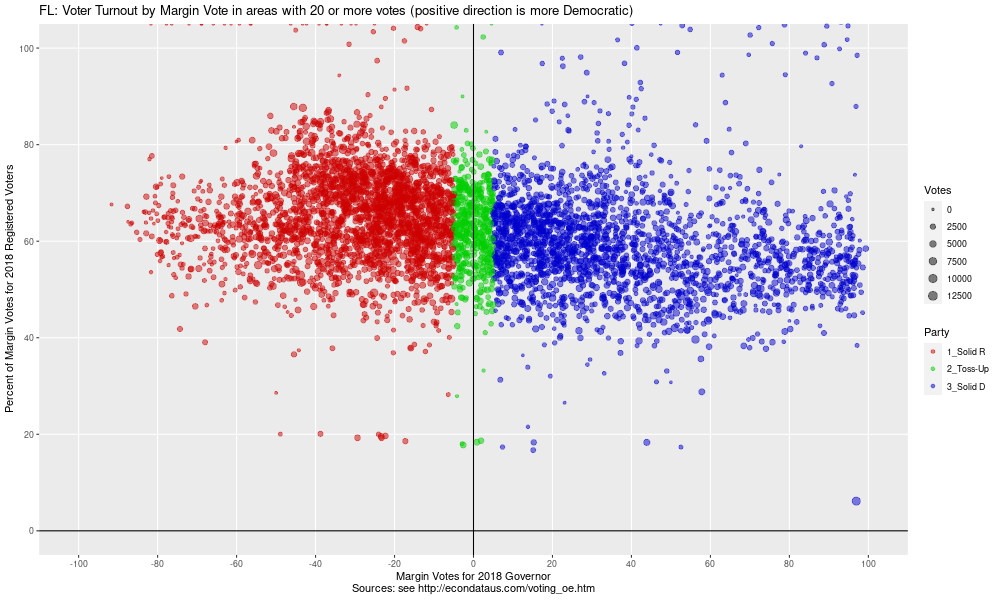
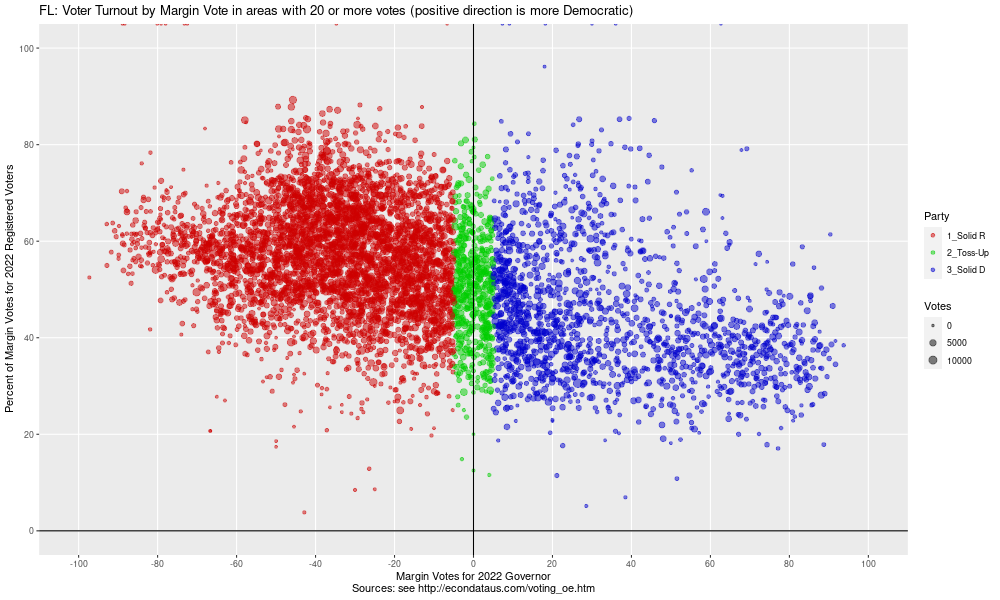
As can be seen, the plot for 2018 slants down very slightly from left to right. The average turnout for 2018 appears to be just above 60 for the majority Republican precincts and just below 60 for the majority Democrat precincts. However, the average turnout for 2022 appears to be about 60 for the majority Republican precincts and closer to 60 for the majority Democrat precincts. Hence, the majority Republican turnout may have gone down slightly but the majority Democrat turnout went down much more, by nearly 20 percent.
It's possible to look at the turnout by county via the following steps:
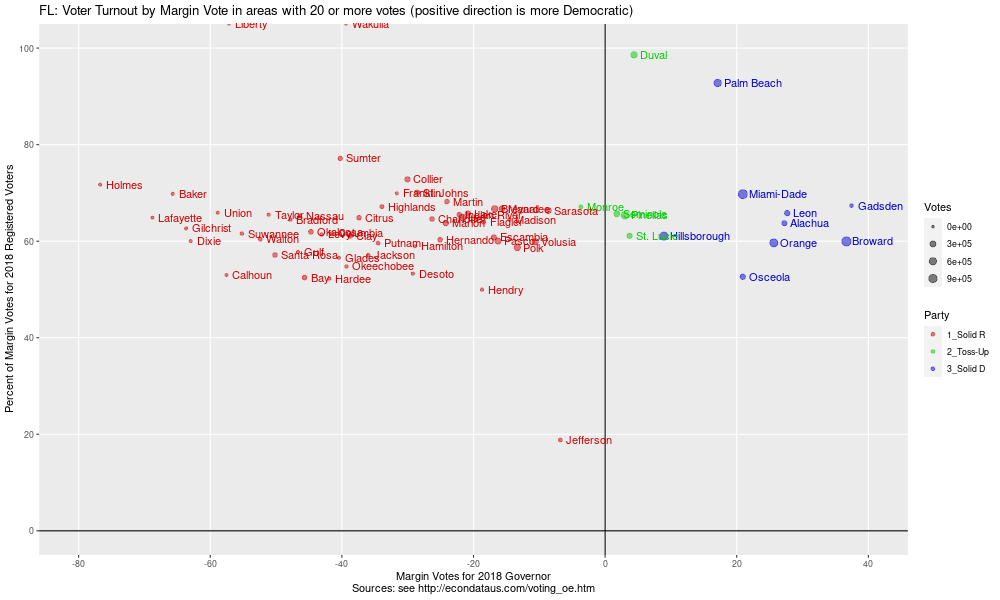
As can be seen, the average turnout in 2018 appears to have been just above 60 for both the majority Republican counties and the majority Democrat counties. For 2022, however, the average turnout appears to have been about 60 for counties with Republican majorities above 20 percent and about 50 for counties with Republican majorities below 20 percent and Democratic majorities.
Clicking on the Areas2 tab will display the actual numbers for the 2018 plot with MARGIN1 on the x-axis and MAR_SH on the y-axis:
FL: Voter Turnout by Margin Vote (Percent ratio)

         COUNTY   AREA   Dem   Rep MARGIN1 TOTAL1 Dem.1 Rep.1 MARGIN2     TOTAL2 DEM_SH REP_SH MAR_SH TOT_SH
1       ALACHUA COUNTY 63.04 35.80   27.24  98.84     0     0       0    180,938    Inf    Inf  63.73  63.73
2         BAKER COUNTY 16.69 82.38  -65.69  99.07     0     0       0     15,108    Inf    Inf  69.80  69.80
3           BAY COUNTY 26.43 72.10  -45.66  98.53     0     0       0    120,851    Inf    Inf  52.46  52.46
4      BRADFORD COUNTY 25.41 73.22  -47.82  98.63     0     0       0     16,312    Inf    Inf  64.45  64.45
5       BREVARD COUNTY 40.76 57.54  -16.78  98.30     0     0       0    422,606    Inf    Inf  66.71  66.71
6       BROWARD COUNTY 67.95 31.29   36.66  99.24     0     0       0  1,183,455    Inf    Inf  59.96  59.96
7       CALHOUN COUNTY 20.02 77.55  -57.54  97.57     0     0       0      8,703    Inf    Inf  52.98  52.98
8     CHARLOTTE COUNTY 35.96 62.26  -26.30  98.22     0     0       0    134,539    Inf    Inf  64.59  64.59
9        CITRUS COUNTY 29.87 67.27  -37.39  97.14     0     0       0    109,388    Inf    Inf  64.87  64.87
10         CLAY COUNTY 30.09 68.84  -38.75  98.93     0     0       0    153,119    Inf    Inf  61.10  61.10
11      COLLIER COUNTY 34.46 64.49  -30.03  98.95     0     0       0    213,664    Inf    Inf  72.80  72.80
12     COLUMBIA COUNTY 28.58 70.06  -41.48  98.64     0     0       0     40,375    Inf    Inf  61.60  61.60
13       DESOTO COUNTY 34.31 63.53  -29.22  97.83     0     0       0     16,735    Inf    Inf  53.27  53.27
14        DIXIE COUNTY 17.35 80.32  -62.97  97.67     0     0       0      9,670    Inf    Inf  60.02  60.02
15        DUVAL COUNTY 51.71 47.32    4.40  99.03     0     0       0    385,513    Inf    Inf  98.62  98.62
16     ESCAMBIA COUNTY 40.81 57.72  -16.90  98.53     0     0       0    212,987    Inf    Inf  60.78  60.78
17      FLAGLER COUNTY 40.07 58.55  -18.48  98.62     0     0       0     82,611    Inf    Inf  63.99  63.99
18     FRANKLIN COUNTY 32.97 64.62  -31.65  97.59     0     0       0      7,783    Inf    Inf  69.91  69.91
19      GADSDEN COUNTY 68.36 30.91   37.44  99.27     0     0       0     29,791    Inf    Inf  67.36  67.36
20    GILCHRIST COUNTY 17.39 81.06  -63.67  98.45     0     0       0     11,767    Inf    Inf  62.64  62.64
21       GLADES COUNTY 28.53 68.97  -40.44  97.50     0     0       0      6,784    Inf    Inf  56.57  56.57
22         GULF COUNTY 25.61 72.29  -46.68  97.90     0     0       0     10,216    Inf    Inf  57.75  57.75
23     HAMILTON COUNTY 34.92 63.83  -28.91  98.75     0     0       0      7,727    Inf    Inf  58.96  58.96
24       HARDEE COUNTY 28.14 70.03  -41.90  98.17     0     0       0     12,258    Inf    Inf  52.24  52.24
25       HENDRY COUNTY 39.59 58.29  -18.70  97.87     0     0       0     17,774    Inf    Inf  49.97  49.97
26     HERNANDO COUNTY 36.45 61.53  -25.07  97.98     0     0       0    133,862    Inf    Inf  60.31  60.31
27    HIGHLANDS COUNTY 32.11 66.03  -33.92  98.14     0     0       0     59,272    Inf    Inf  67.16  67.16
28 HILLSBOROUGH COUNTY 53.79 44.86    8.93  98.66     0     0       0    857,266    Inf    Inf  61.06  61.06
29       HOLMES COUNTY 10.87 87.60  -76.73  98.47     0     0       0      9,454    Inf    Inf  71.73  71.73
30 INDIAN RIVER COUNTY 38.30 60.46  -22.16  98.77     0     0       0    113,426    Inf    Inf  65.51  65.51
31      JACKSON COUNTY 31.39 67.37  -35.98  98.76     0     0       0     27,996    Inf    Inf  57.11  57.11
32    JEFFERSON COUNTY 45.82 52.62   -6.80  98.44     0     0       0     39,156    Inf    Inf  18.82  18.82
33    LAFAYETTE COUNTY 14.83 83.62  -68.79  98.44     0     0       0      4,356    Inf    Inf  64.88  64.88
34         LAKE COUNTY 38.86 59.71  -20.85  98.57     0     0       0    236,080    Inf    Inf  65.71  65.71
35          LEE COUNTY 38.37 60.07  -21.70  98.44     0     0       0    446,254    Inf    Inf  64.94  64.94
36         LEON COUNTY 63.26 35.59   27.67  98.85     0     0       0    213,195    Inf    Inf  65.82  65.82
37         LEVY COUNTY 27.59 70.65  -43.07  98.24     0     0       0     27,859    Inf    Inf  61.39  61.39
38      LIBERTY COUNTY 19.61 76.77  -57.16  96.38     0     0       0          0    Inf    Inf    Inf    Inf
39      MADISON COUNTY 42.41 56.96  -14.54  99.37     0     0       0     11,841    Inf    Inf  64.45  64.45
40      MANATEE COUNTY 41.36 57.03  -15.67  98.39     0     0       0    245,088    Inf    Inf  66.70  66.70
41       MARION COUNTY 37.02 61.22  -24.20  98.25     0     0       0    243,088    Inf    Inf  63.76  63.76
42       MARTIN COUNTY 37.46 61.49  -24.03  98.94     0     0       0    114,094    Inf    Inf  68.21  68.21
43   MIAMI-DADE COUNTY 59.90 38.98   20.93  98.88     0     0       0  1,147,121    Inf    Inf  69.74  69.74
44       MONROE COUNTY 47.51 51.19   -3.68  98.71     0     0       0     53,869    Inf    Inf  67.11  67.11
45       NASSAU COUNTY 26.32 72.73  -46.41  99.05     0     0       0     66,798    Inf    Inf  65.25  65.25
46     OKALOOSA COUNTY 26.69 71.39  -44.70  98.08     0     0       0    135,563    Inf    Inf  61.93  61.93
47   OKEECHOBEE COUNTY 29.38 68.69  -39.31  98.06     0     0       0     20,552    Inf    Inf  54.76  54.76
48       ORANGE COUNTY 62.22 36.59   25.63  98.82     0     0       0    798,374    Inf    Inf  59.64  59.64
49      OSCEOLA COUNTY 59.69 38.77   20.92  98.46     0     0       0    218,754    Inf    Inf  52.63  52.63
50   PALM BEACH COUNTY 58.16 41.06   17.10  99.22     0     0       0    632,740    Inf    Inf  92.77  92.77
51        PASCO COUNTY 40.90 57.17  -16.27  98.07     0     0       0    351,949    Inf    Inf  60.01  60.01
52     PINELLAS COUNTY 50.67 47.65    3.02  98.32     0     0       0    666,876    Inf    Inf  65.35  65.35
53         POLK COUNTY 42.49 55.83  -13.34  98.32     0     0       0    417,217    Inf    Inf  58.69  58.69
54       PUTNAM COUNTY 32.01 66.51  -34.50  98.53     0     0       0     47,219    Inf    Inf  59.61  59.61
55   SANTA ROSA COUNTY 24.07 74.23  -50.16  98.30     0     0       0    132,357    Inf    Inf  57.15  57.15
56     SARASOTA COUNTY 44.99 53.63   -8.64  98.61     0     0       0    318,384    Inf    Inf  66.34  66.34
57     SEMINOLE COUNTY 50.25 48.46    1.79  98.70     0     0       0    303,669    Inf    Inf  65.67  65.67
58    ST. JOHNS COUNTY 35.25 63.82  -28.57  99.07     0     0       0    187,125    Inf    Inf  70.05  70.05
59    ST. LUCIE COUNTY 51.24 47.52    3.72  98.76     0     0       0    203,131    Inf    Inf  61.11  61.11
60       SUMTER COUNTY 29.34 69.58  -40.24  98.92     0     0       0     96,497    Inf    Inf  77.15  77.15
61     SUWANNEE COUNTY 21.68 76.87  -55.19  98.55     0     0       0     25,847    Inf    Inf  61.57  61.57
62       TAYLOR COUNTY 23.61 74.74  -51.13  98.35     0     0       0     12,142    Inf    Inf  65.48  65.48
63        UNION COUNTY 19.96 78.83  -58.86  98.79     0     0       0      7,396    Inf    Inf  65.90  65.90
64      VOLUSIA COUNTY 43.88 54.50  -10.62  98.38     0     0       0    382,408    Inf    Inf  59.88  59.88
65      WAKULLA COUNTY 29.45 68.83  -39.38  98.28     0     0       0          0    Inf    Inf    Inf    Inf
66       WALTON COUNTY 23.12 75.53  -52.40  98.65     0     0       0     50,263    Inf    Inf  60.39  60.39
67   WASHINGTON COUNTY 20.58 77.45  -56.87  98.04     0     0       0      8,375    Inf    Inf 108.18 108.18
68        TOTAL  TOTAL 49.15 49.54   -0.39  98.69     0     0       0 24,955,174    Inf    Inf  65.94  65.94
Following are the corresponding numbers for the 2022 turnout:
FL: Voter Turnout by Margin Vote (Percent ratio)

         COUNTY   AREA   Dem   Rep MARGIN1 TOTAL1 Dem.1 Rep.1 MARGIN2     TOTAL2 DEM_SH REP_SH MAR_SH TOT_SH
1       ALACHUA COUNTY 57.14 42.04   15.09  99.18     0     0       0    178,046    Inf    Inf  53.86  53.86
2         BAKER COUNTY 10.18 89.45  -79.27  99.64     0     0       0     17,512    Inf    Inf  61.24  61.24
3           BAY COUNTY 21.00 78.38  -57.38  99.39     0     0       0    124,338    Inf    Inf  53.96  53.96
4      BRADFORD COUNTY 18.04 81.29  -63.25  99.33     0     0       0     17,986    Inf    Inf  57.08  57.08
5       BREVARD COUNTY 35.57 63.77  -28.20  99.34     0     0       0    460,372    Inf    Inf  58.09  58.09
6       BROWARD COUNTY 57.35 41.97   15.38  99.32     0     0       0  1,252,776    Inf    Inf  47.78  47.78
7       CALHOUN COUNTY 13.52 86.04  -72.52  99.57     0     0       0      8,255    Inf    Inf  58.85  58.85
8     CHARLOTTE COUNTY 29.13 70.50  -41.37  99.63     0     0       0    153,332    Inf    Inf  60.46  60.46
9        CITRUS COUNTY 25.19 74.23  -49.04  99.42     0     0       0    122,182    Inf    Inf  62.06  62.06
10         CLAY COUNTY 24.62 74.67  -50.05  99.29     0     0       0    163,573    Inf    Inf  55.09  55.09
11      COLLIER COUNTY 27.98 71.74  -43.76  99.71     0     0       0    253,830    Inf    Inf  64.52  64.52
12     COLUMBIA COUNTY 20.18 79.19  -59.01  99.38     0     0       0     42,683    Inf    Inf  55.59  55.59
13       DESOTO COUNTY 23.25 76.28  -53.03  99.53     0     0       0     18,285    Inf    Inf  47.59  47.59
14        DIXIE COUNTY 11.90 87.30  -75.40  99.19     0     0       0     10,617    Inf    Inf  58.20  58.20
15        DUVAL COUNTY 43.68 55.44  -11.76  99.12     0     0       0    655,820    Inf    Inf  50.21  50.21
16     ESCAMBIA COUNTY 34.63 64.46  -29.84  99.09     0     0       0    224,099    Inf    Inf  51.65  51.65
17      FLAGLER COUNTY 32.67 66.76  -34.08  99.43     0     0       0     95,306    Inf    Inf  61.59  61.59
18     FRANKLIN COUNTY 25.84 73.56  -47.72  99.39     0     0       0      7,977    Inf    Inf  68.22  68.22
19      GADSDEN COUNTY 62.01 37.36   24.64  99.37     0     0       0     29,752    Inf    Inf  58.57  58.57
20    GILCHRIST COUNTY 12.93 86.50  -73.58  99.43     0     0       0     12,050    Inf    Inf  65.29  65.29
21       GLADES COUNTY 18.83 80.73  -61.90  99.56     0     0       0      6,959    Inf    Inf  55.02  55.02
22         GULF COUNTY 19.41 80.16  -60.75  99.56     0     0       0     10,439    Inf    Inf  61.55  61.55
23     HAMILTON COUNTY 26.09 73.26  -47.17  99.35     0     0       0      7,846    Inf    Inf  54.72  54.72
24       HARDEE COUNTY 17.14 82.33  -65.19  99.48     0     0       0     12,710    Inf    Inf  43.56  43.56
25       HENDRY COUNTY 24.84 74.25  -49.41  99.09     0     0       0     19,607    Inf    Inf  42.13  42.13
26     HERNANDO COUNTY 29.47 69.95  -40.47  99.42     0     0       0    148,486    Inf    Inf  54.16  54.16
27    HIGHLANDS COUNTY 25.09 74.12  -49.02  99.21     0     0       0     69,023    Inf    Inf  57.70  57.70
28 HILLSBOROUGH COUNTY 44.95 54.17   -9.22  99.13     0     0       0    924,891    Inf    Inf  52.28  52.28
29       HOLMES COUNTY  7.86 91.62  -83.77  99.48     0     0       0     11,468    Inf    Inf  59.14  59.14
30 INDIAN RIVER COUNTY 31.97 67.53  -35.56  99.50     0     0       0    119,433    Inf    Inf  64.81  64.81
31      JACKSON COUNTY 23.49 76.03  -52.54  99.52     0     0       0     28,745    Inf    Inf  56.80  56.80
32    JEFFERSON COUNTY 38.95 60.47  -21.52  99.42     0     0       0      9,622    Inf    Inf  74.07  74.07
33    LAFAYETTE COUNTY 10.08 89.68  -79.61  99.76     0     0       0      4,544    Inf    Inf  64.22  64.22
34         LAKE COUNTY 32.83 66.54  -33.72  99.37     0     0       0    276,151    Inf    Inf  58.00  58.00
35          LEE COUNTY 30.79 68.79  -38.00  99.58     0     0       0    518,035    Inf    Inf  53.13  53.13
36         LEON COUNTY 57.35 41.82   15.53  99.17     0     0       0    204,259    Inf    Inf  57.65  57.65
37         LEVY COUNTY 20.98 78.42  -57.45  99.40     0     0       0     30,920    Inf    Inf  57.94  57.94
38      LIBERTY COUNTY 14.18 85.36  -71.19  99.54     0     0       0          0    Inf    Inf    Inf    Inf
39      MADISON COUNTY 32.85 66.77  -33.92  99.61     0     0       0     12,213    Inf    Inf  57.16  57.16
40      MANATEE COUNTY 34.82 64.70  -29.88  99.52     0     0       0    280,604    Inf    Inf  61.20  61.20
41       MARION COUNTY 30.20 69.23  -39.02  99.43     0     0       0    271,032    Inf    Inf  57.58  57.58
42       MARTIN COUNTY 30.58 69.01  -38.43  99.58     0     0       0    119,066    Inf    Inf  65.23  65.23
43   MIAMI-DADE COUNTY 43.97 55.28  -11.32  99.25     0     0       0  1,529,439    Inf    Inf  46.54  46.54
44       MONROE COUNTY 39.15 60.23  -21.07  99.38     0     0       0     55,183    Inf    Inf  61.62  61.62
45       NASSAU COUNTY 22.97 76.52  -53.55  99.50     0     0       0     75,750    Inf    Inf  63.05  63.05
46     OKALOOSA COUNTY 22.92 76.18  -53.26  99.11     0     0       0    144,013    Inf    Inf  56.25  56.25
47   OKEECHOBEE COUNTY 19.10 80.34  -61.24  99.44     0     0       0     22,757    Inf    Inf  47.84  47.84
48       ORANGE COUNTY 53.10 46.08    7.02  99.18     0     0       0    870,296    Inf    Inf  46.79  46.79
49      OSCEOLA COUNTY 46.09 52.84   -6.75  98.92     0     0       0    254,867    Inf    Inf  40.34  40.34
50   PALM BEACH COUNTY 48.30 51.21   -2.91  99.51     0     0       0  1,003,675    Inf    Inf  54.18  54.18
51        PASCO COUNTY 33.49 65.82  -32.33  99.31     0     0       0    411,946    Inf    Inf  54.61  54.61
52     PINELLAS COUNTY 44.76 54.61   -9.85  99.37     0     0       0    695,798    Inf    Inf  60.86  60.86
53         POLK COUNTY 34.85 64.45  -29.60  99.31     0     0       0    463,894    Inf    Inf  49.58  49.58
54       PUTNAM COUNTY 23.30 76.02  -52.72  99.32     0     0       0     50,658    Inf    Inf  52.50  52.50
55   SANTA ROSA COUNTY 19.94 79.38  -59.44  99.32     0     0       0    145,720    Inf    Inf  51.95  51.95
56     SARASOTA COUNTY 38.65 60.92  -22.27  99.58     0     0       0    353,493    Inf    Inf  61.92  61.92
57     SEMINOLE COUNTY 43.48 55.78  -12.30  99.27     0     0       0    341,548    Inf    Inf  53.64  53.64
58    ST. JOHNS COUNTY 29.64 69.87  -40.23  99.51     0     0       0    223,775    Inf    Inf  64.64  64.64
59    ST. LUCIE COUNTY 40.17 59.31  -19.14  99.48     0     0       0    238,645    Inf    Inf  51.12  51.12
60       SUMTER COUNTY 26.51 73.21  -46.70  99.72     0     0       0    118,110    Inf    Inf  75.75  75.75
61     SUWANNEE COUNTY 16.19 83.39  -67.20  99.58     0     0       0     28,779    Inf    Inf  56.87  56.87
62       TAYLOR COUNTY 16.74 82.76  -66.02  99.50     0     0       0     12,916    Inf    Inf  59.01  59.01
63        UNION COUNTY 11.94 87.65  -75.71  99.58     0     0       0      7,654    Inf    Inf  59.55  59.55
64      VOLUSIA COUNTY 35.34 63.99  -28.64  99.33     0     0       0    412,402    Inf    Inf  54.86  54.86
65      WAKULLA COUNTY 26.02 73.25  -47.22  99.27     0     0       0     23,620    Inf    Inf  63.77  63.77
66       WALTON COUNTY 17.51 82.08  -64.57  99.59     0     0       0     60,674    Inf    Inf  57.52  57.52
67   WASHINGTON COUNTY 14.08 85.32  -71.24  99.40     0     0       0     14,486    Inf    Inf  63.00  63.00
68        TOTAL  TOTAL 39.97 59.37  -19.40  99.35     0     0       0 28,989,884    Inf    Inf  53.61  53.61
The plot and tables above show that Miami-Dade had an especially large change in its turnout, from 69.74 percent in 2018 to 46.54 percent in 2022.
The following plot shows the change in the number of registered Democrats and Republicans in Florida since 2017.
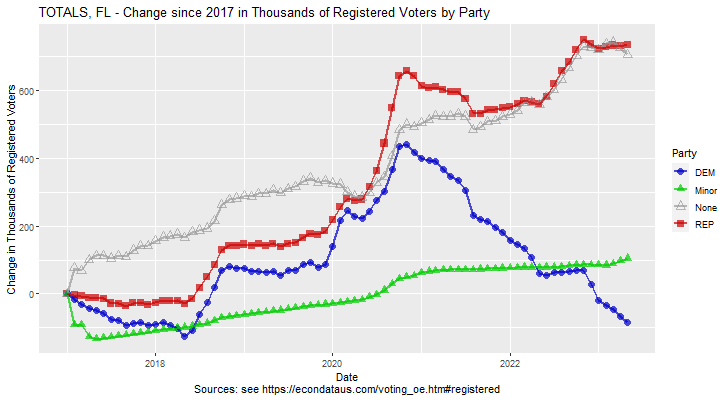
As can be seen, the number of both registered Republicans and Democrats dropped from the 2020 election through September of 2021. After that, however, the number of Republican registered voters began to rise while the number of Democrat registered voters continued to drop. From September of 2021 through May of 2023, the number of registered Republicans has risen by 203,987 while the number of registered Democrats has fallen by 304,862. That's a combined difference of over half of a million registered voters. In May of 2023, there were 84,969 fewer registered Democrats in Florida than there were in January of 2017.
The following plot shows the same information for just Miami-Dade County, FL.
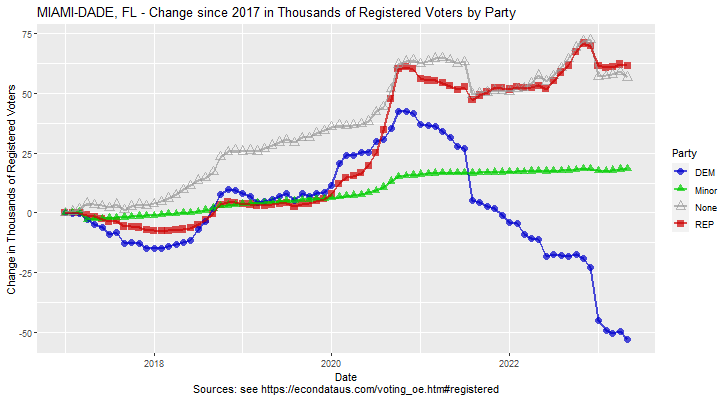
As can be seen, the number of both registered Republicans and Democrats dropped from the 2020 election through August of 2021 in Miami-Dade County. After that, the number of Republican registered voters began to rise while the number of Democrat registered voters continued to drop. From August of 2021 through May of 2023, the number of registered Republicans in Miami-Dade has risen by 14,340 while the number of registered Democrats has fallen by 57,932. That's a combined difference of over 72 thousand registered voters. In May of 2023, there were 52,676 fewer registered Democrats in Miami-Dade County than there were in January of 2017.
Sources: Voter Registration Reports
The change in voter registration leads one to investigate whether there was a similar change in vote counts. The change in the vote margins from the 2018 to the 2022 Governor's races can be displayed via the following steps:
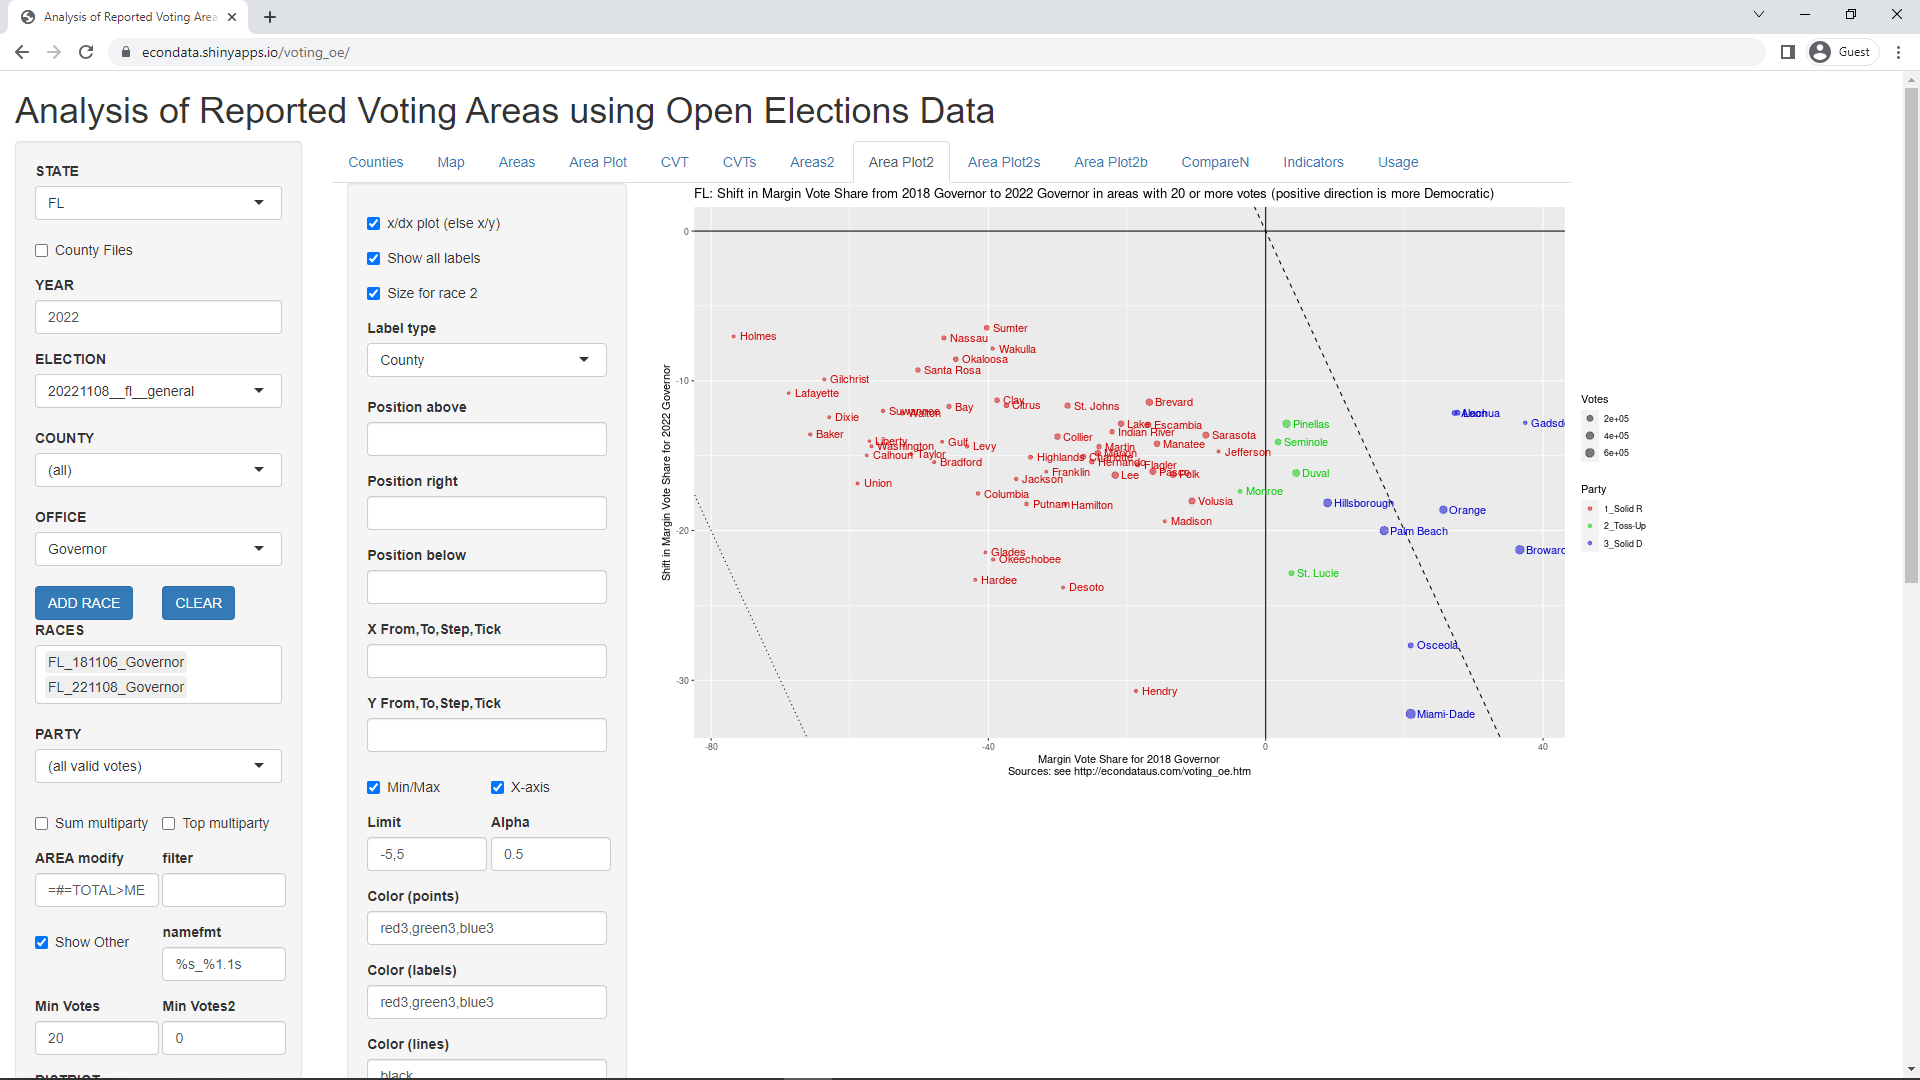
The above plot shows the shift in the margin vote share from the 2018 to the 2022 Governor's race, by county. The fact that all of the points are below the x-axis indicates that the vote margin share (percent) in all of the counties became more Republican. The shift appeared to average about 15 percent for majority Republican (red) counties and upwards of 20 percent for majority Democrat (blue) counties. Miami-Dade County shows to have shifted by over 30 percent.
Changing "Units" from Percent to Count and changing "Party" to Total will display the following plot:
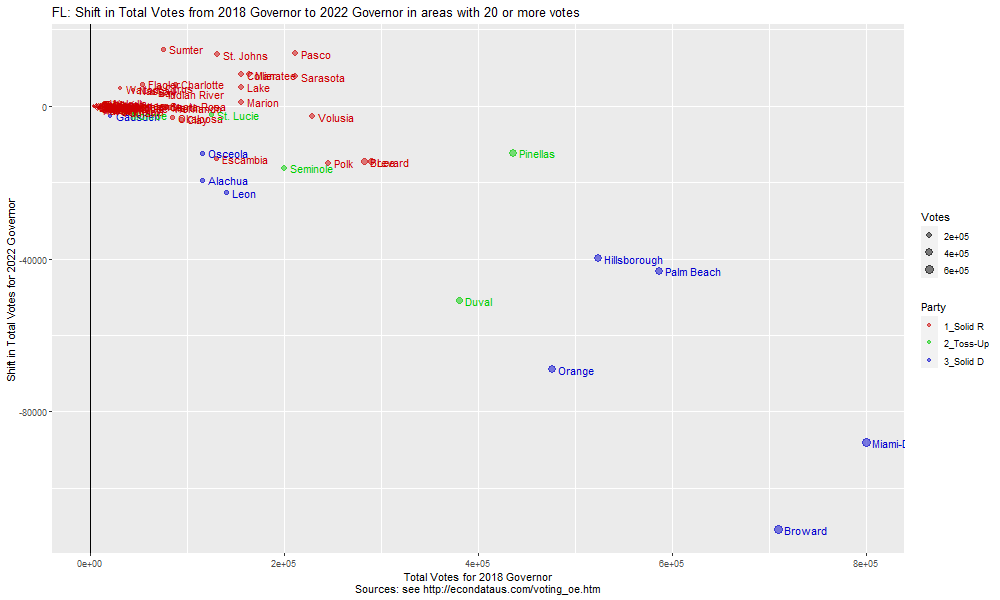
The above plot shows that the total vote counts in most of the red majority Republican counties went up while the vote counts in all of the blue majority Democrat counties went down. One can focus in on just the Democrat votes by changing "Party" to Democrat. This will display the following plot:
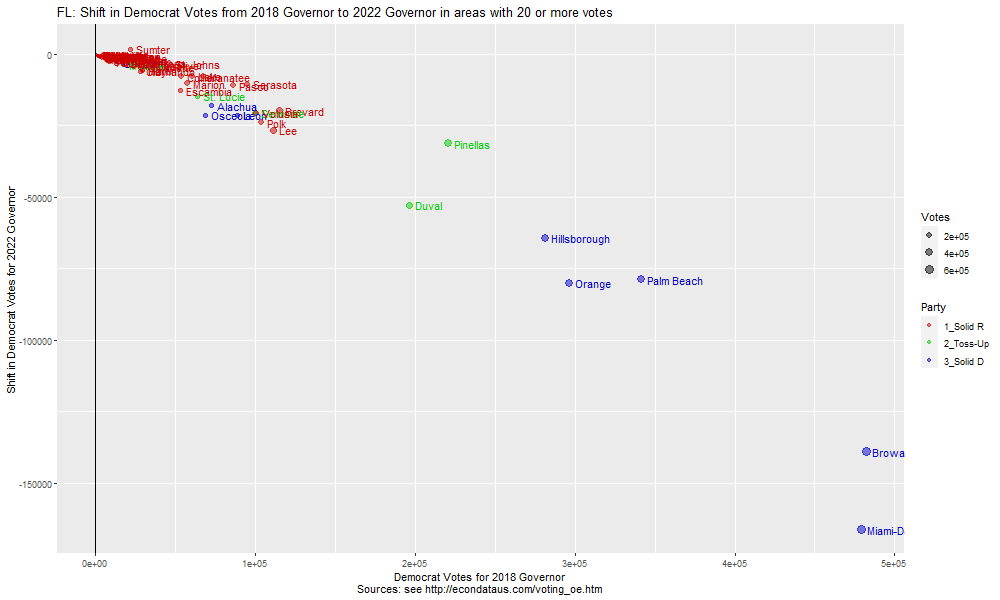
As can be seen, Democrat votes appear to have decreased from the 2018 to the 2022 Governor's race in every county except for Sumter. The votes in Miami-Dade County decreased by over 150 thousand votes. One can then focus in on just the Republican votes by changing "Party" to Republican. This will display the following plot:
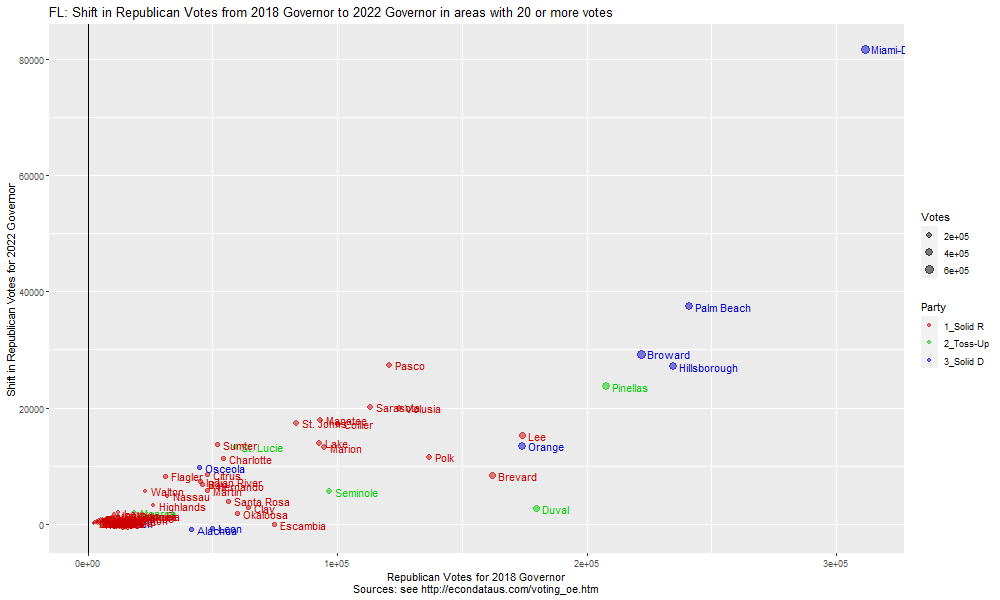
As can be seen, Republican votes appear to have increased from the 2018 to the 2022 Governor's race in every county except for Alachua, Leon, and perhaps Escambia. All of this seems consistent with the fact that the number of registered Republican went up from 2018 to 2022 but the number of registered Democrats went down (or stayed about even). In the latter case, the vote count would also seem to have been affected by the fact that the voter turnout generally went down in majority Democrat counties, as shown earlier.
Comparing Multiple Races from a Single Election
Comparing the Margin Vote Shares of Two Races
Changing COUNTY back to Miami_Dade and clicking on the Areas2 tab now will display the message "Error: 'names' attribute [5] must be the same length as the vector [1]". This is because the tab compares two races and requires at least two races in the RACES select box. Selecting "U.S. Senate" in the OFFICE select list and clicking the "ADD RACE" button will add the U.S. Senate race and display the following page:
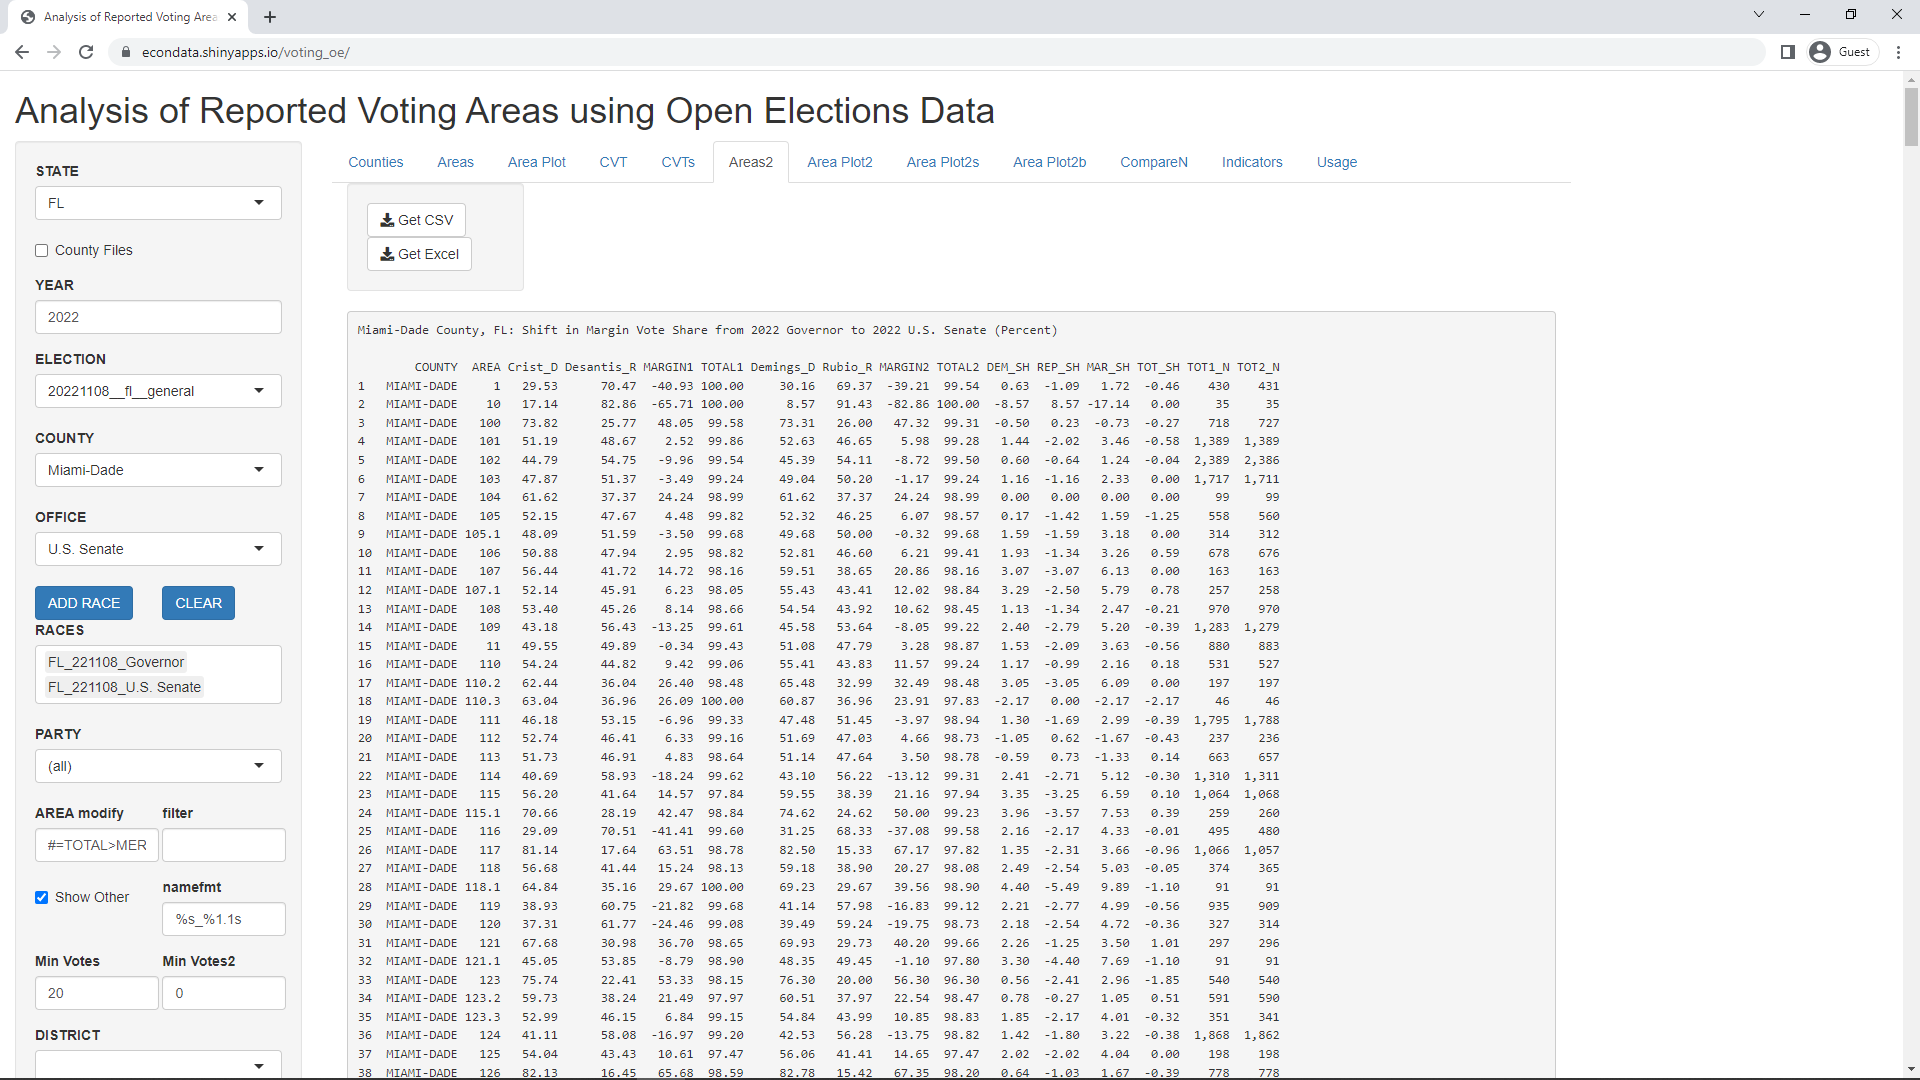
As can be seen, the columns consist of COUNTY, AREA, Crist_D, Desantis_R, MARGIN1, TOTAL1, Demings_D, Rubio_R, MARGIN2, TOTAL2, DEM_SH, REP_SH, MAR_SH, TOT_SH, TOT1_N, and TOT2_N. As before, COUNTY identifies the county as Miami_Dade and AREA identifies the precinct (or ward in Wisconsin). Crist_D and Desantis_R are the percent vote shares of the Democrat and Republican candidates in the first race (Governor). MARGIN1 is the percent margin (Democrat vote share minus Republican vote share) and TOTAL1 is the total percent vote share of the Democrat and Republican candidates the first race. This total will be 100 if there are no other candidates. The next four columns (Demings_D, Rubio_R, MARGIN2, and TOTAL2) are the same information for the second race (U.S. Senate). DEM_SH, REP_SH, MAR_SH, and TOT_SH is the shift or change in the Democrat, Republican, Margin, and Total vote shares from the first race to the second race. Finally, TOT1_N and TOT2_N are the vote totals for the first and second races, respectively.
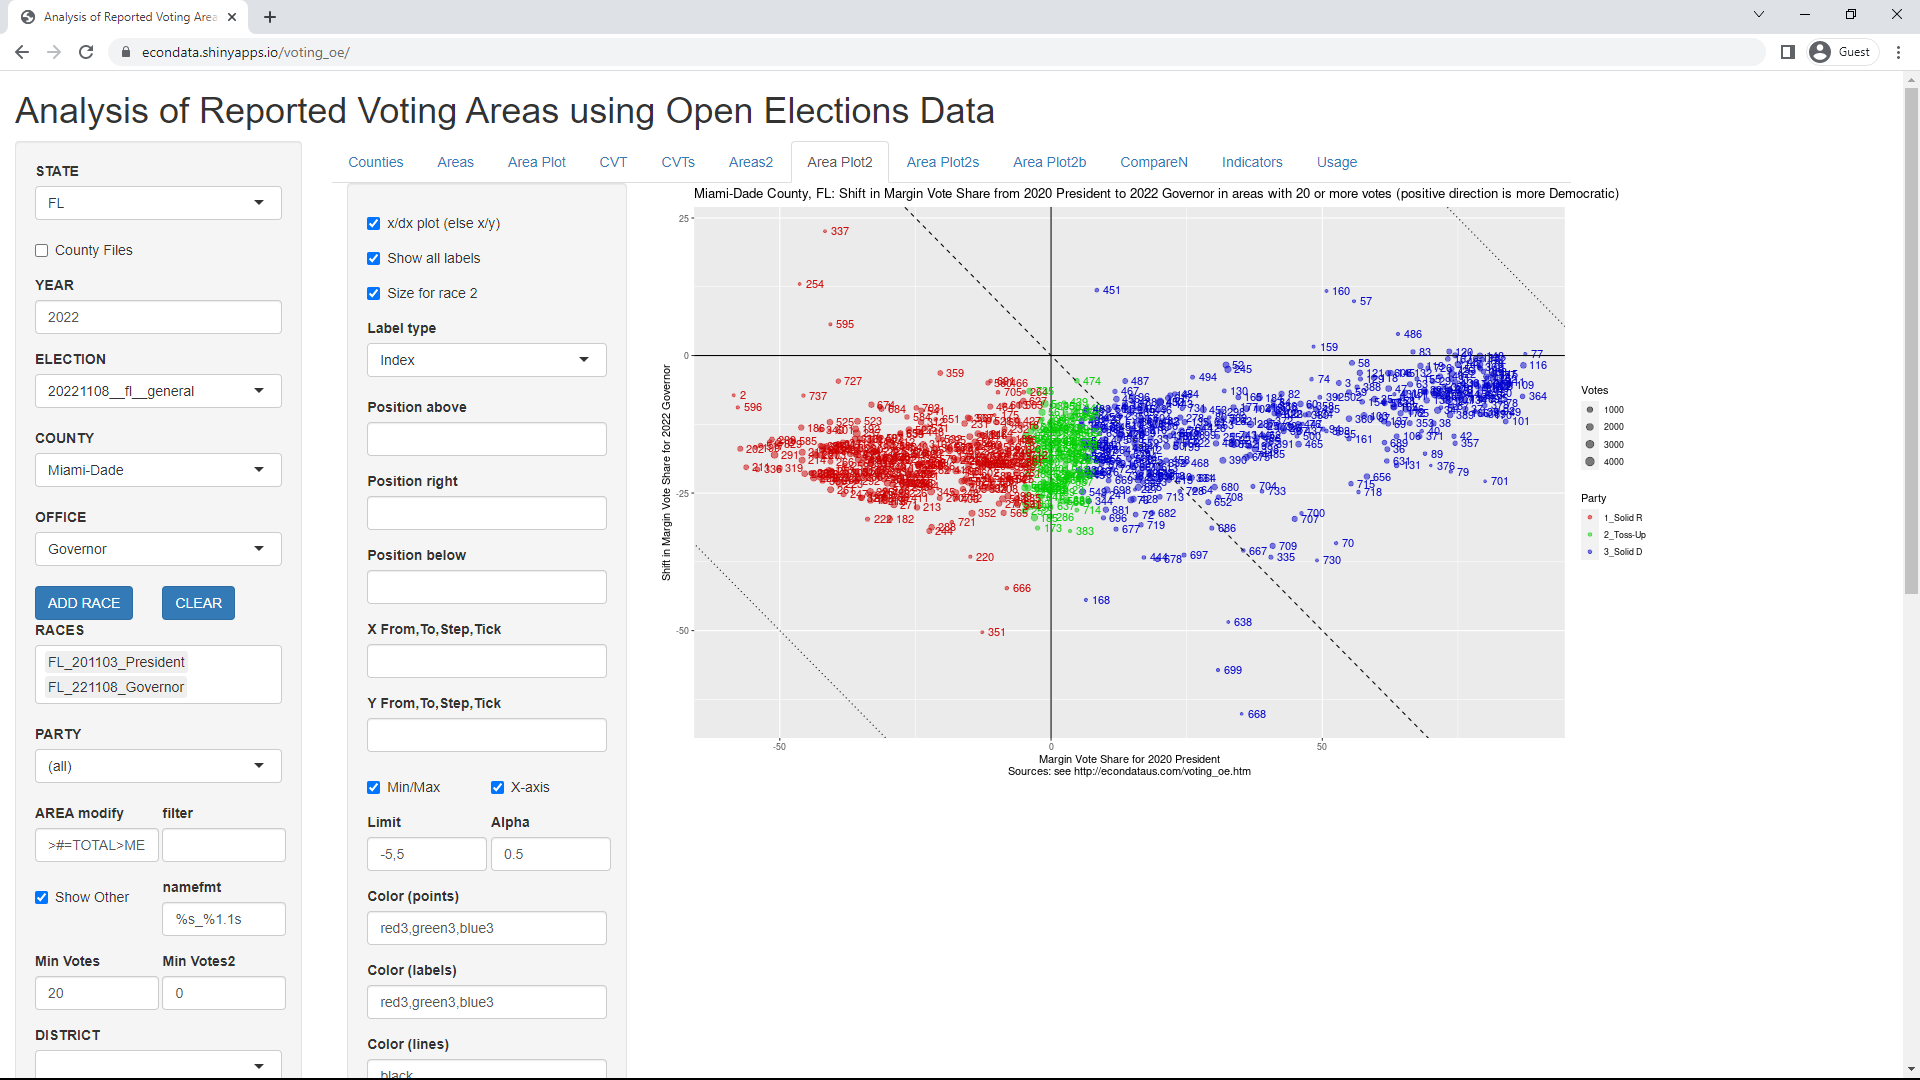
Clicking on the "Area Plot2" tab will display the following page:
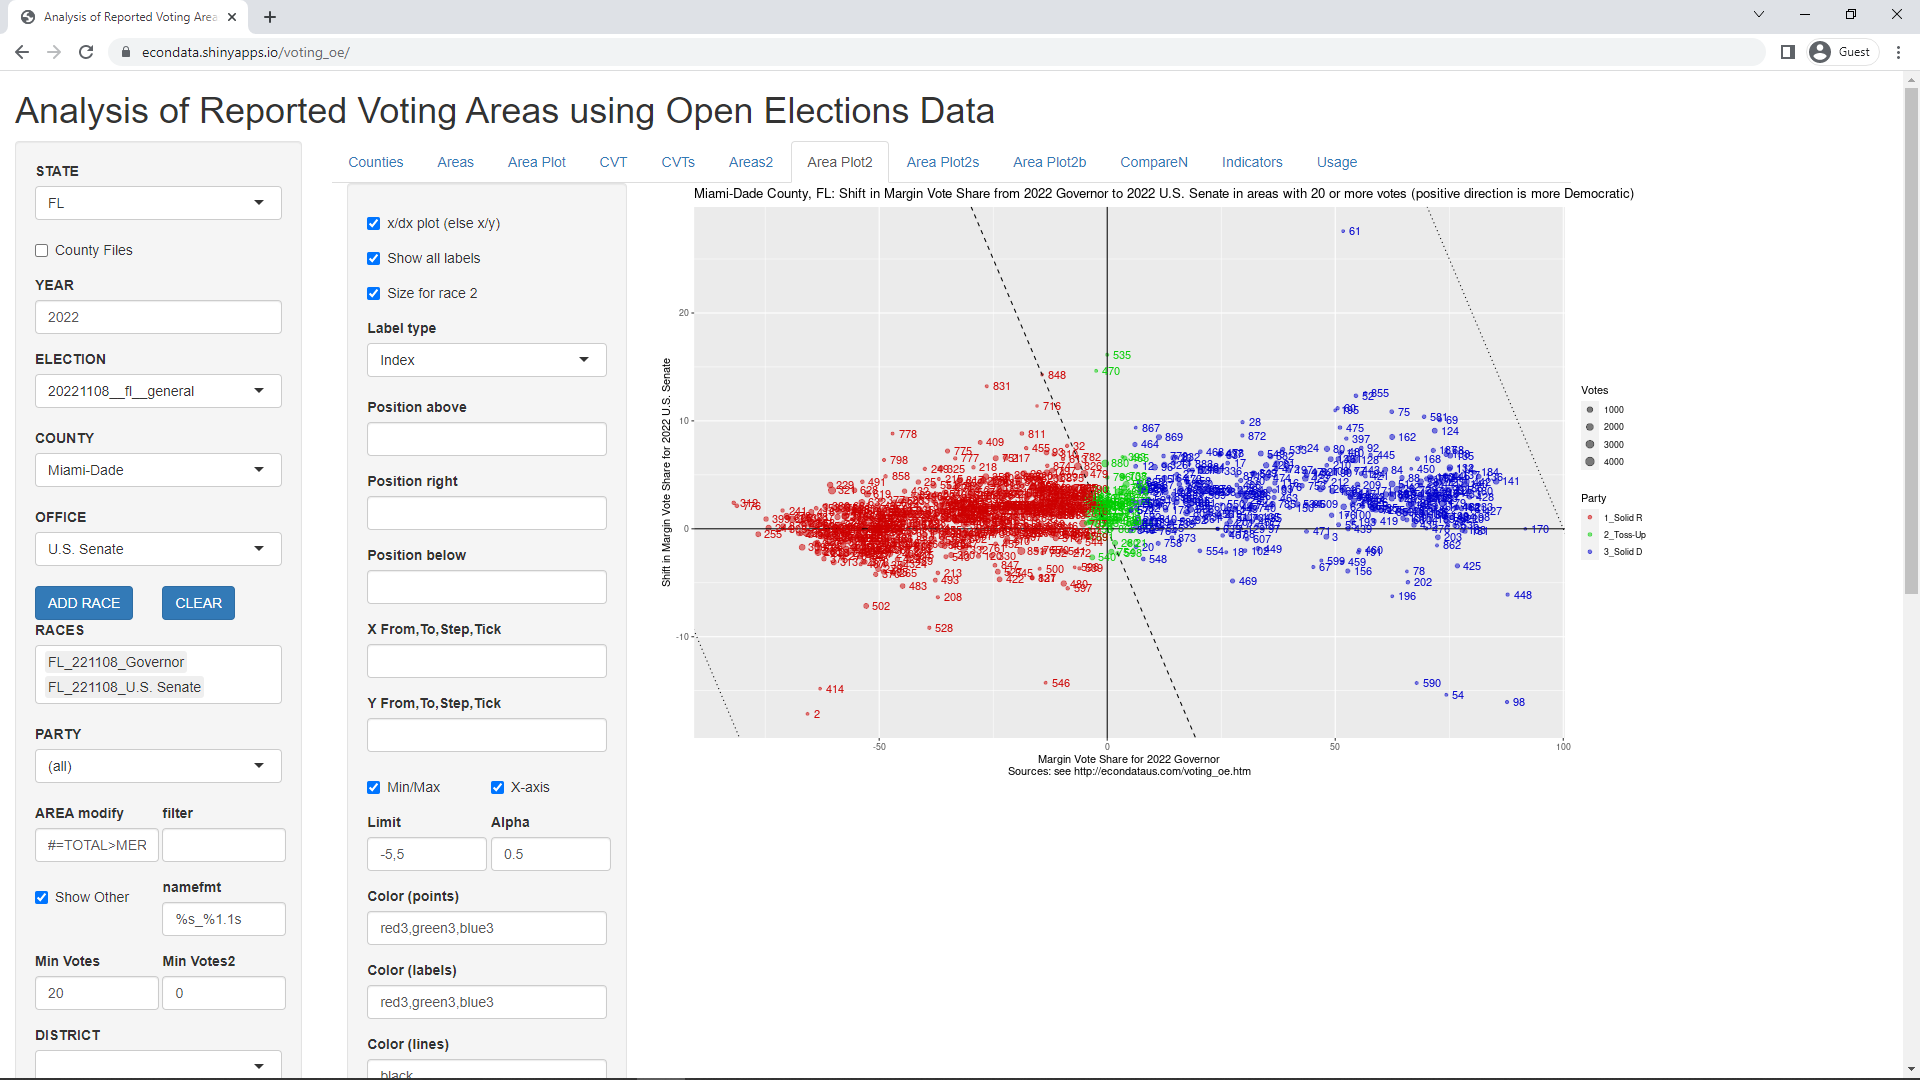
This is plotting the Margin Vote Share of the first race (Governor) against the shift in the Margin Vote Share between that and the second race (U.S. Senate). These correspond to MARGIN1 and MAR_SH in the prior table on the Areas2 tab. The plot shows that the Republican candidate for Governor (DeSantis) received greater support than the Republican candidate for the Senate (Rubio) in all but the strongest Republican precincts. Of course, you could also say that the Democrat candidate for Governor (Crist) received less support than the Republican candidate for the Senate (Demings) in all but the strongest Republican precincts.
Clicking on the "Area Plot2s" tab and changing COUNTY to (all) will display the first 9 counties alphabetically. In order to display the 9 counties with the most votes, change the "Sort Counties" select box from COUNTY to VOTES. This will cause the following 9 counties to display:
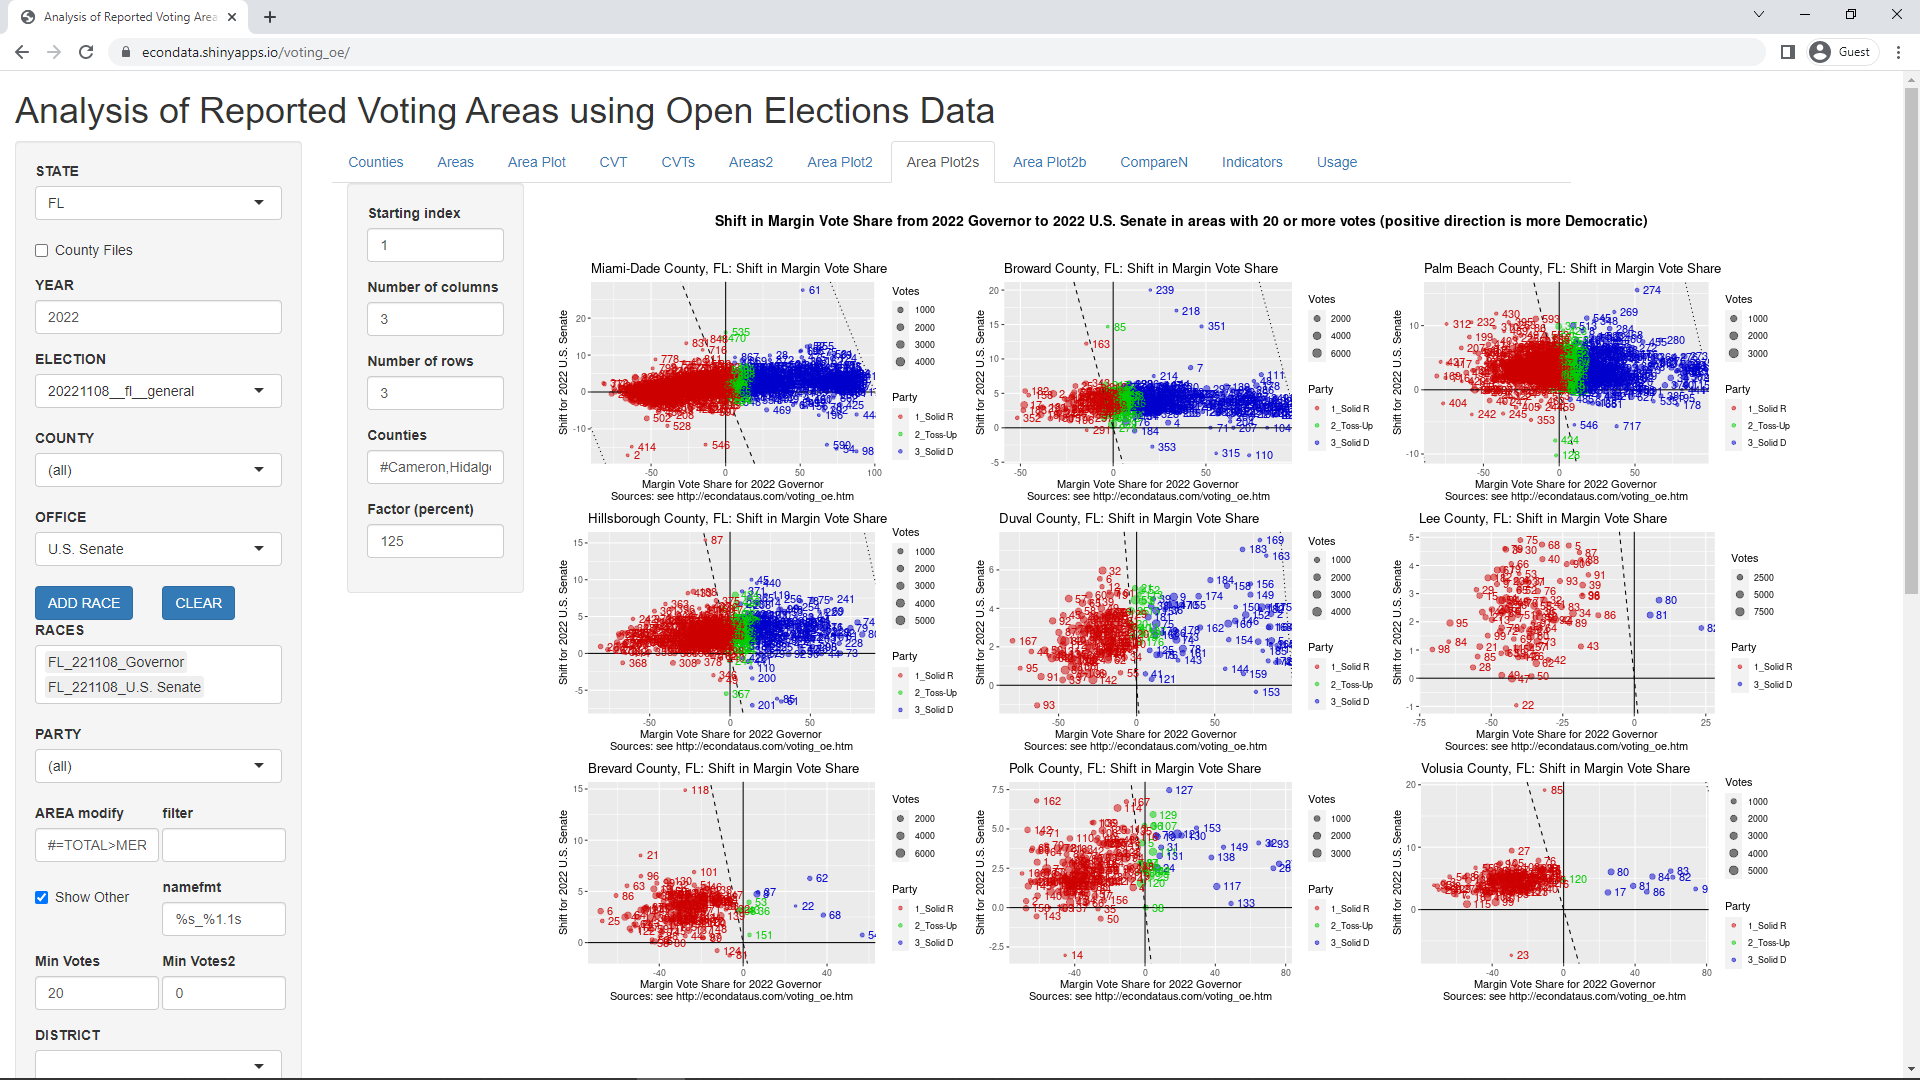
As can be seen, the greater support for DeSantis than Rubio (or less support for Crist than Denings) can be seen in the other 8 top counties by votes. To display all 9 counties on the same scale, it's possible to go back to the "Area Plot2" tab and set the x and y scales there. This is because, at present, the "Area Plot2s" tab is using the same scales for its plots.
Comparing the Margin Vote Shares of Multiple Races
Clicking on the CompareN tab and PlotN subtab will display the Margin Vote Share of both races on the x-axis and list the precincts on the y-axis, sorted by the margin of the race specified in the "Sort AreasN" box. If the Desc checkbox below that is checked, the margins will be sorted in descending order from top to bottom. Otherwise, they will be sorted in ascending order.
Unfortunately, this plot format is not very readable in counties with many precincts, like Miami-Dade. Changing COUNTY to Nassau will display a more readable plot. The main purpose of this plot format is to allow more than two races to be compared. Select "U.S. House" in the OFFICE select list and click the "ADD RACE" button to add the "U.S. House" race. Now repeat this for "Attorney General", "State Senate", and State House". This will display the following page:
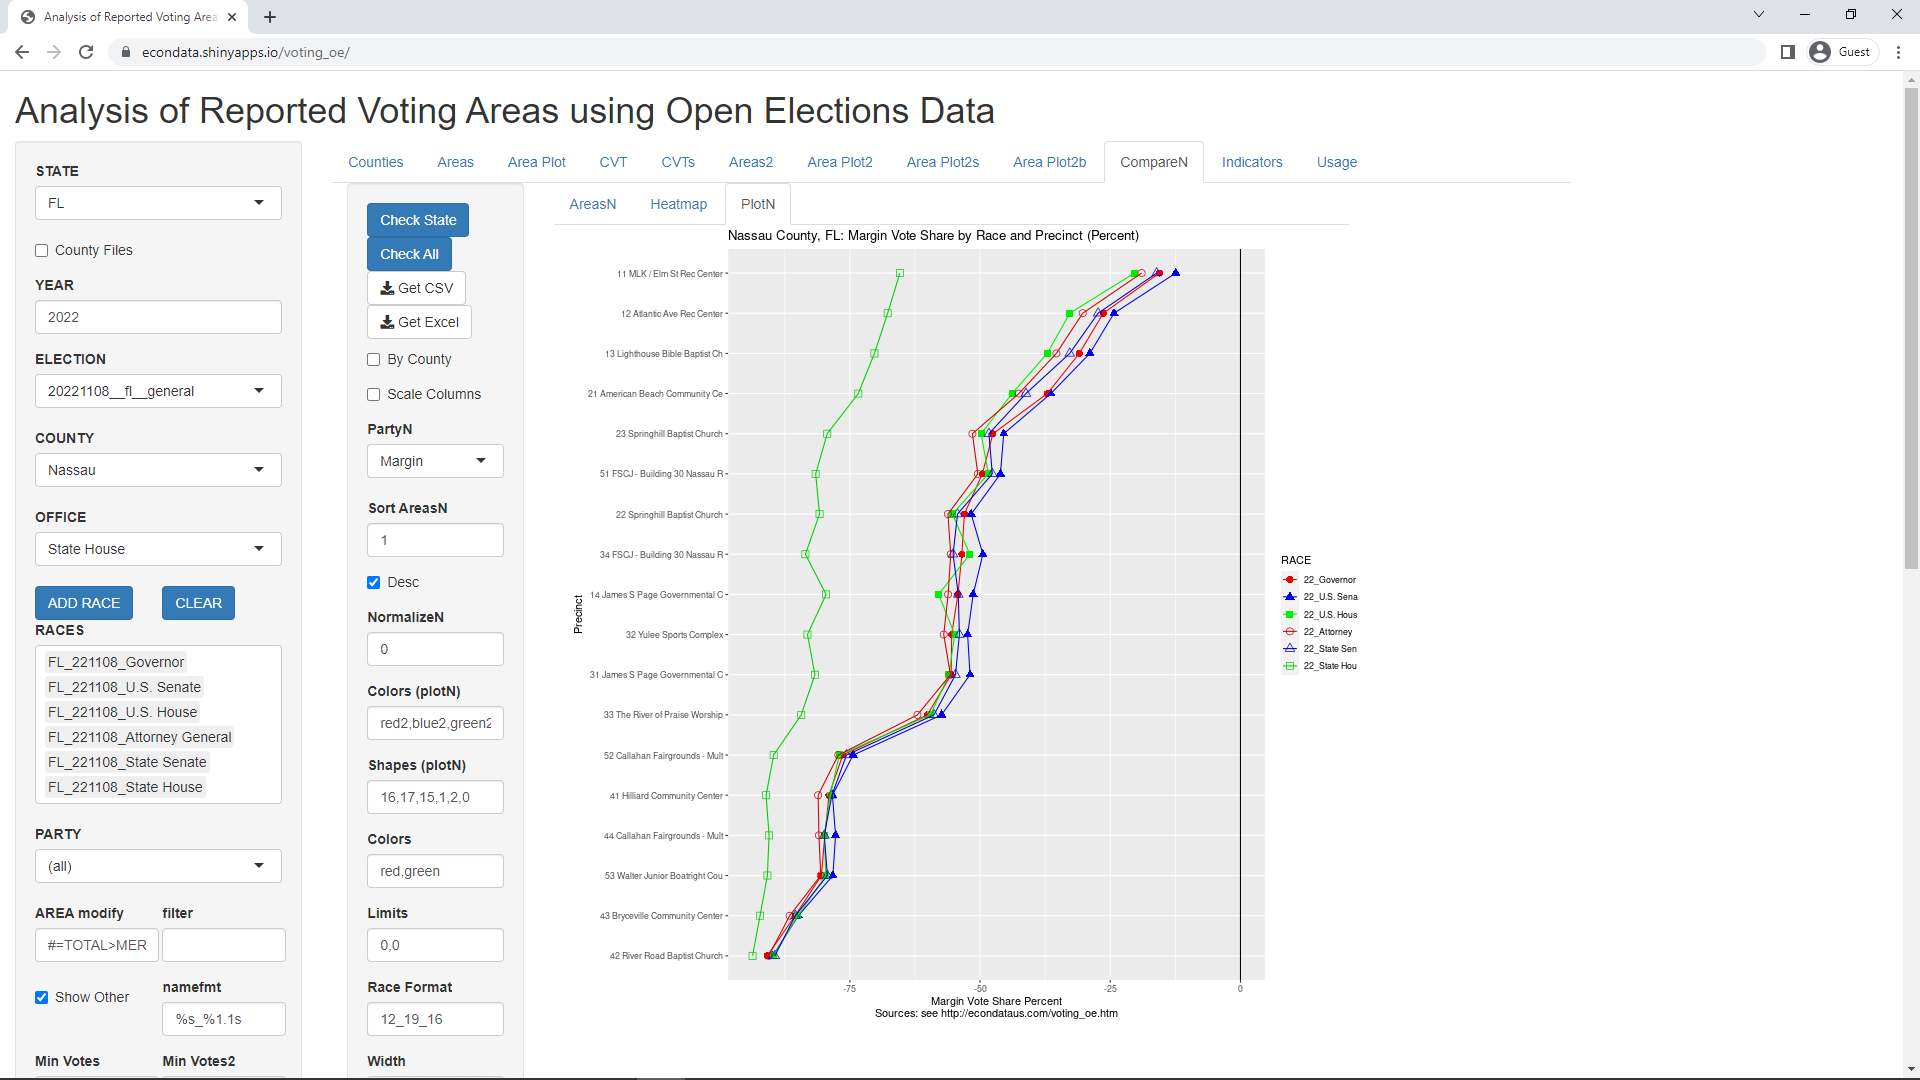
As can be seen, all of the races had similar margins in each precinct except for the State House race. To see that candidates in this race, move the State House race to the top of the races in the RACES select list by clicking on "FL_221108_State_House" in the RACES box, hit the delete key, move the cursor in the RACES box to the top, before the remaining 5 races, with the left-arrow key and then click again on "FL_221108_State_House" from the RACES select list. Now, clicking on the Areas tab should display the following page:
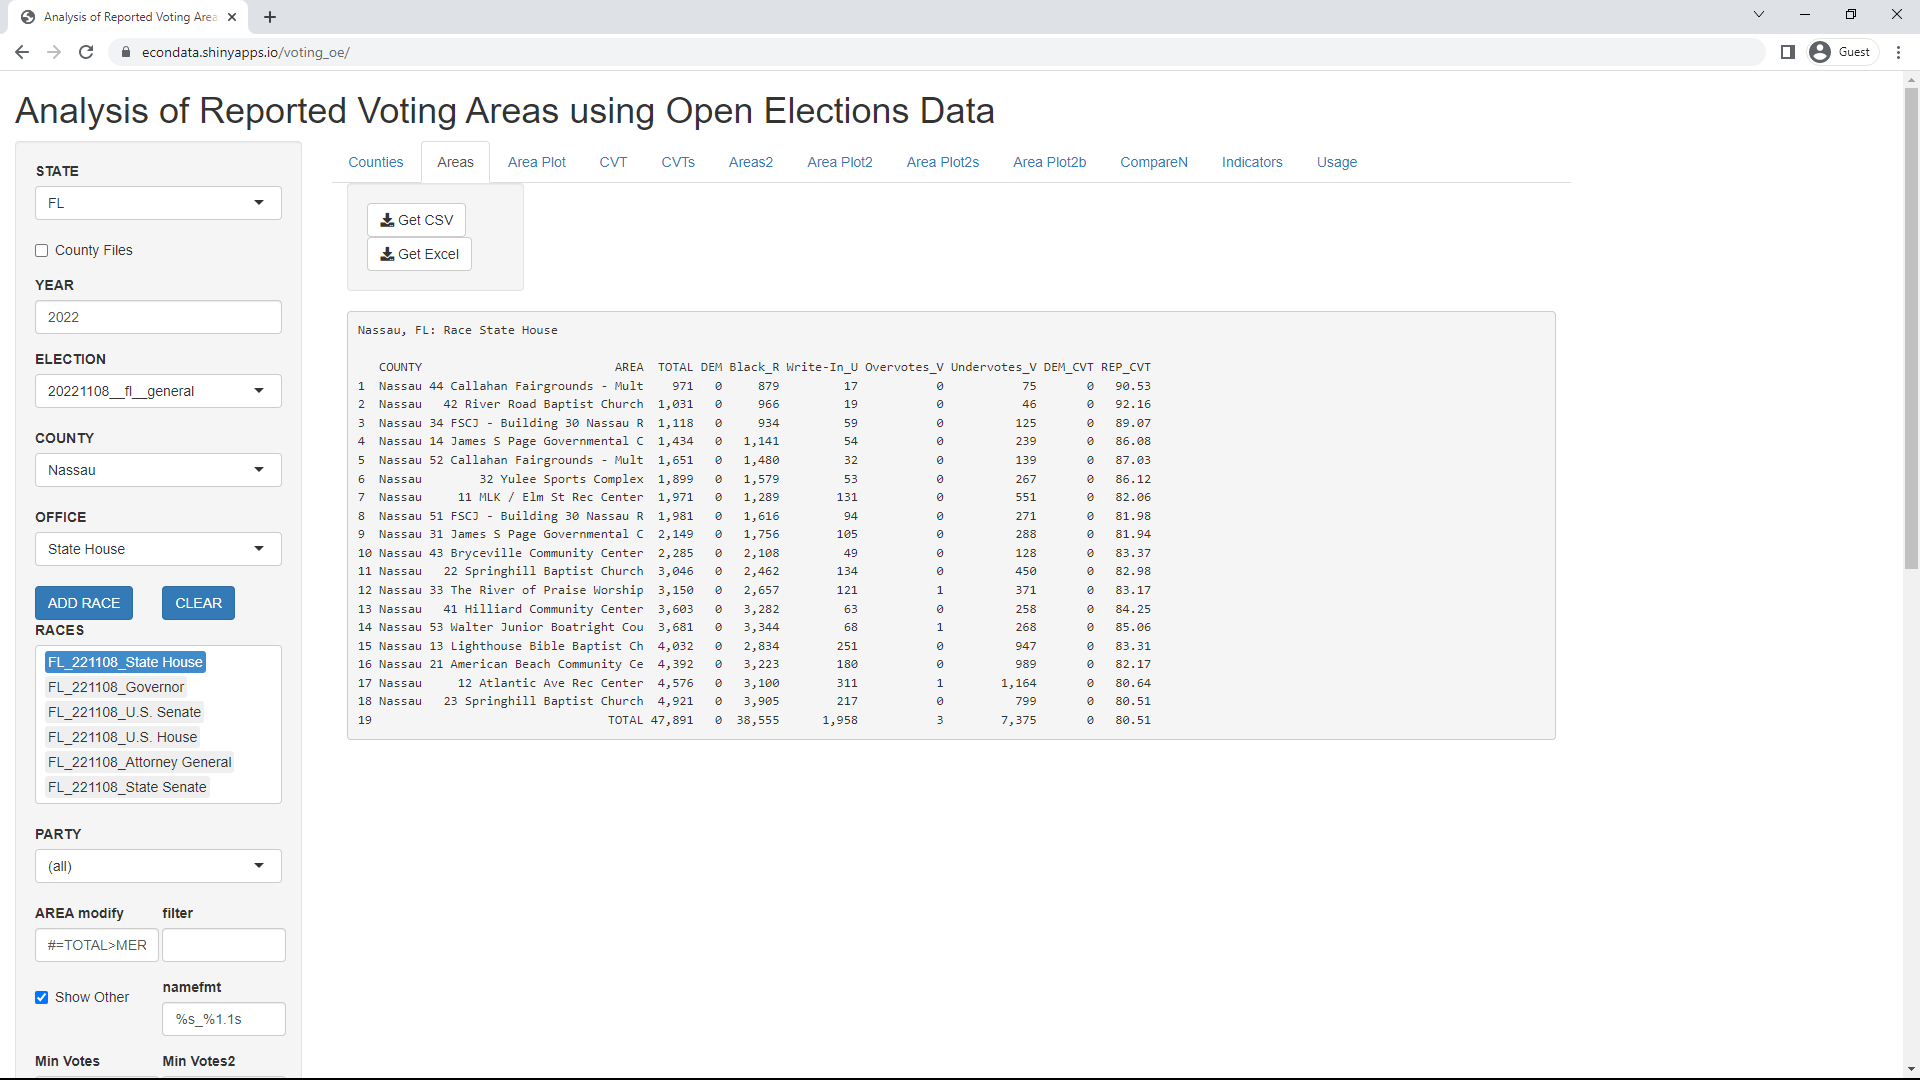
As can be seen, there was no Democrat in that race. This is likely the chief cause for the discrepancy. Also of interest is that this race lists the Write-in, Overvotes, and Undervotes.
Comparing the Cumulative Vote Tallies of Multiple Races
The following steps were previously used to create the CVT (Cumulative Vote Tally) plot for Miami-Dade County above:
As can be seen, the Republican candidate for Governor received very slightly more support than the Republican candidate for Chief Financial Officer. This was generally followed by the Republican candidate for Attorney General, U.S. House, Commissioner of Agriculture, and U.S. Senate. However, the support for all of these offices were within a range of just 2 to 3 percent and their position in relation to each other remained fairly steady well before the mid-plot vertical line.
This same information can be shown for the top 9 counties by votes via the following steps:
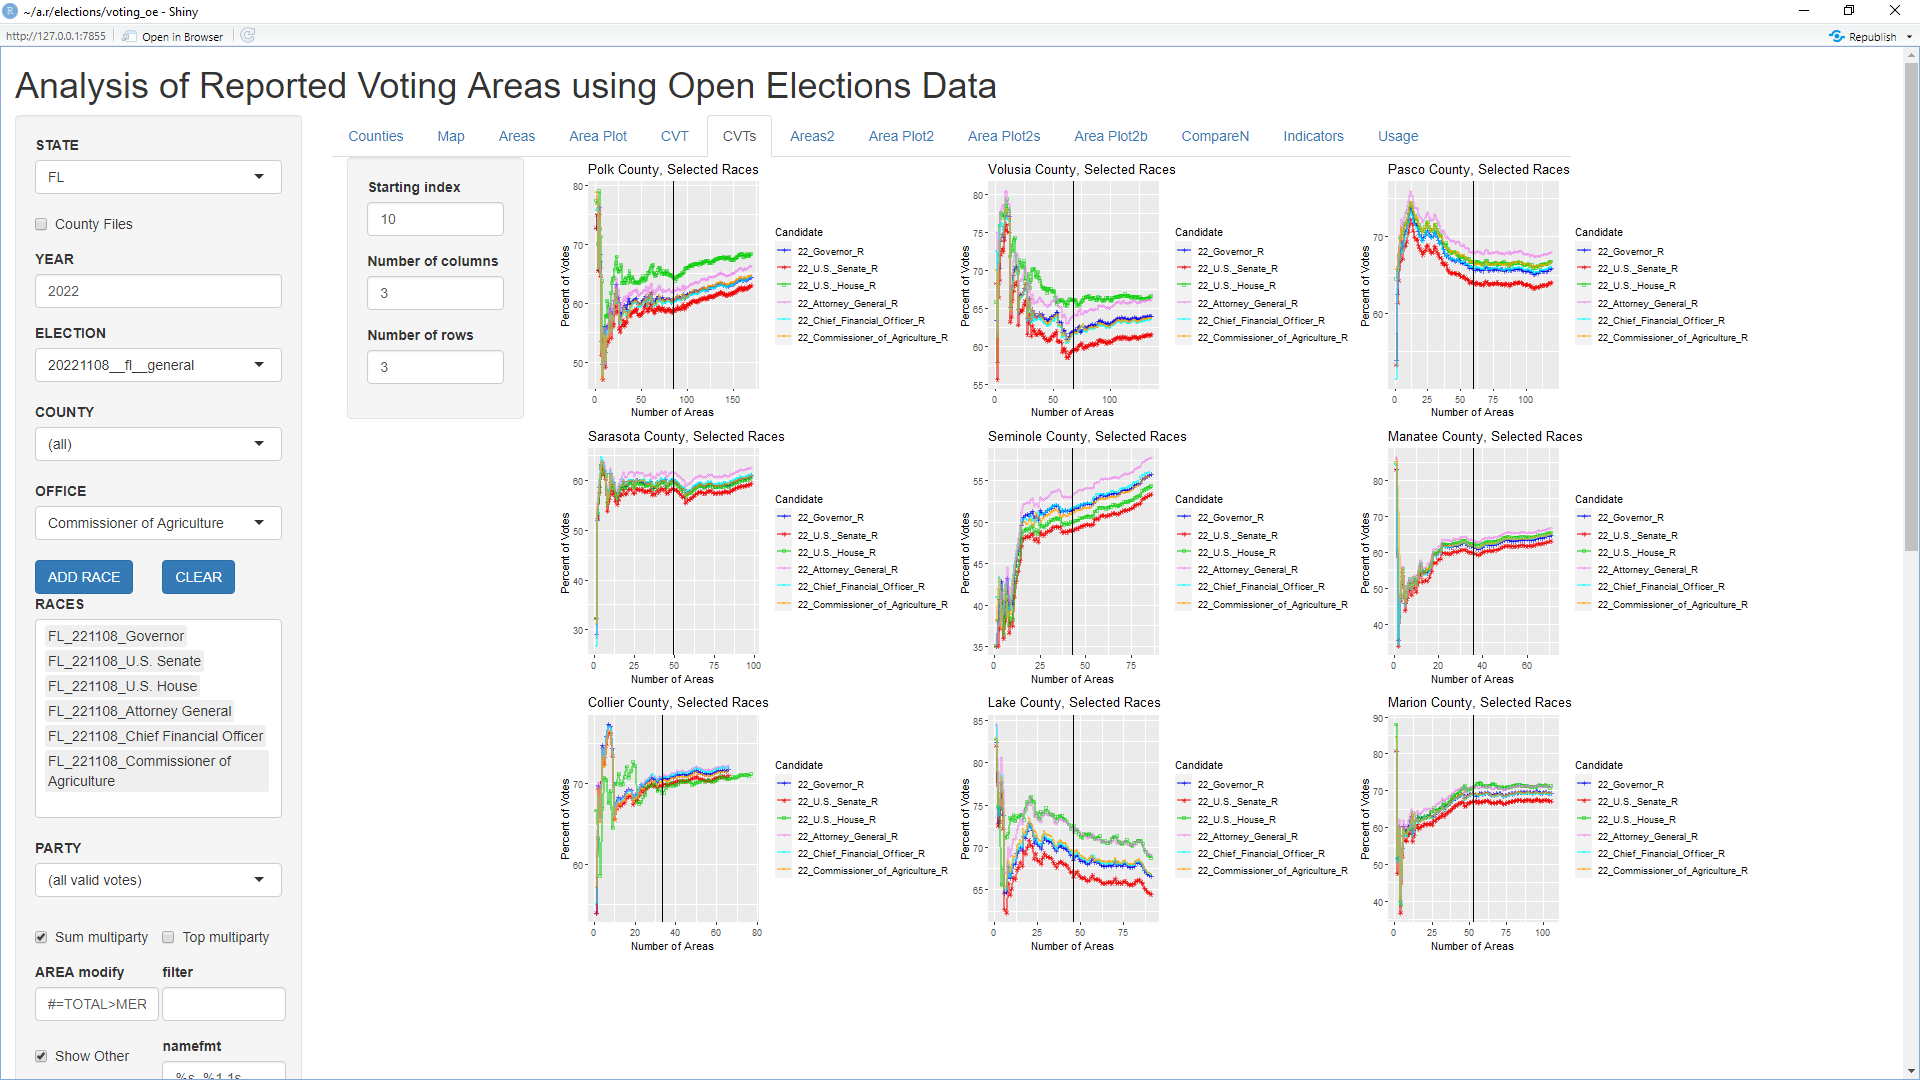
Setting "Starting index" (on the second sidebar from the left) to 10 will display the CVT plots for the second 9 counties by votes:
Next, setting "Starting index" to 19 will display the CVT plots for the third 9 counties by votes:
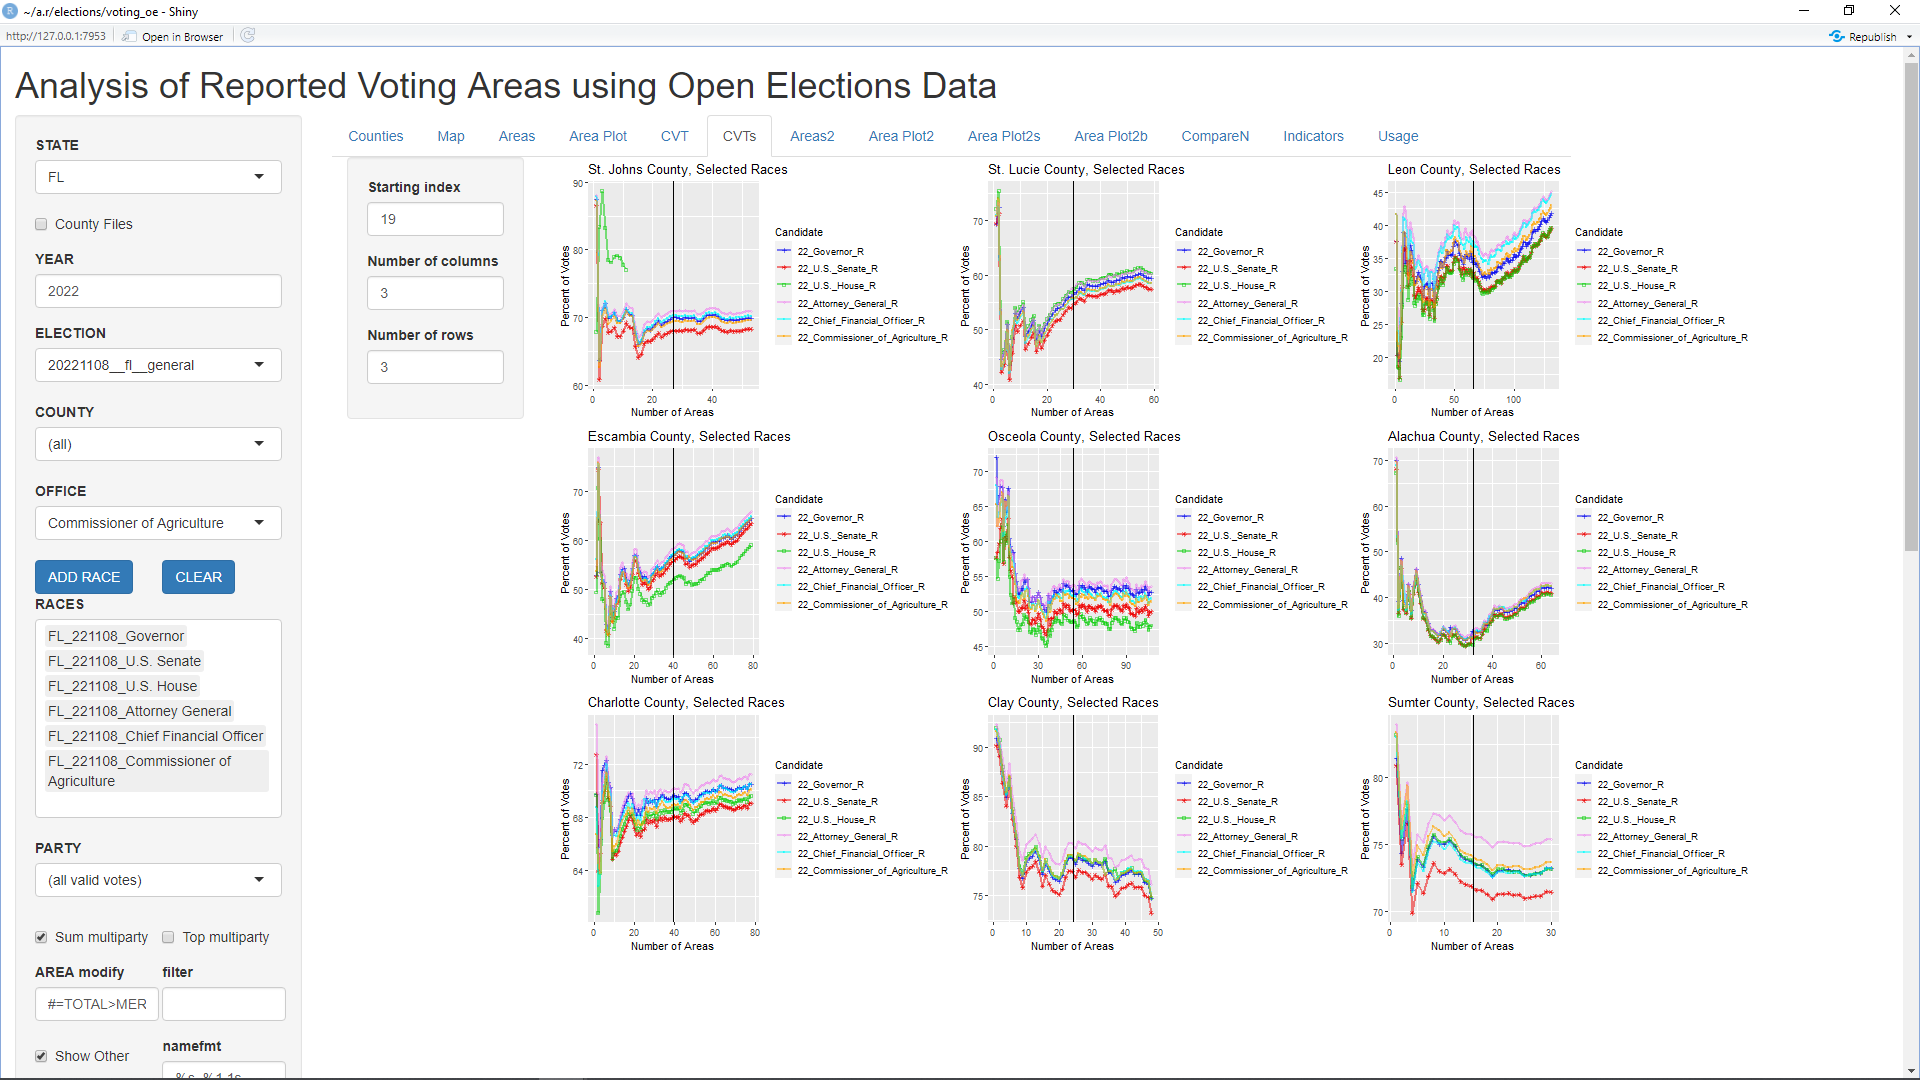
As can be seen, the support for these 6 offices in the other top 26 counties paralleled each other as in Miami-Dade though the range surpassed 5 percent in several of them, notably Pinellas County. Also notable is that the Republican candidate of Attorney General often garnered the most support and the Republican candidate for U.S. Senate (Rubio) garnered the least. Of course, this could also be due to the relative popularity of their Democratic opponents.
Comparing Multiple Races from Multiple Elections
It's also possible to compare races from different elections. Click the CLEAR button above the RACES box to clear all of the races. Now select 2020 in the YEAR box. This will cause the ELECTION select list to change to display all elections available for that state and year in OpenElections. Ensure that it is set to "20201103__fl__general" for the general election on 11/03/2020. Then select Miami_Dade for COUNTY, select President for OFFICE, and click the "ADD RACE" button to add that race to the RACES box.
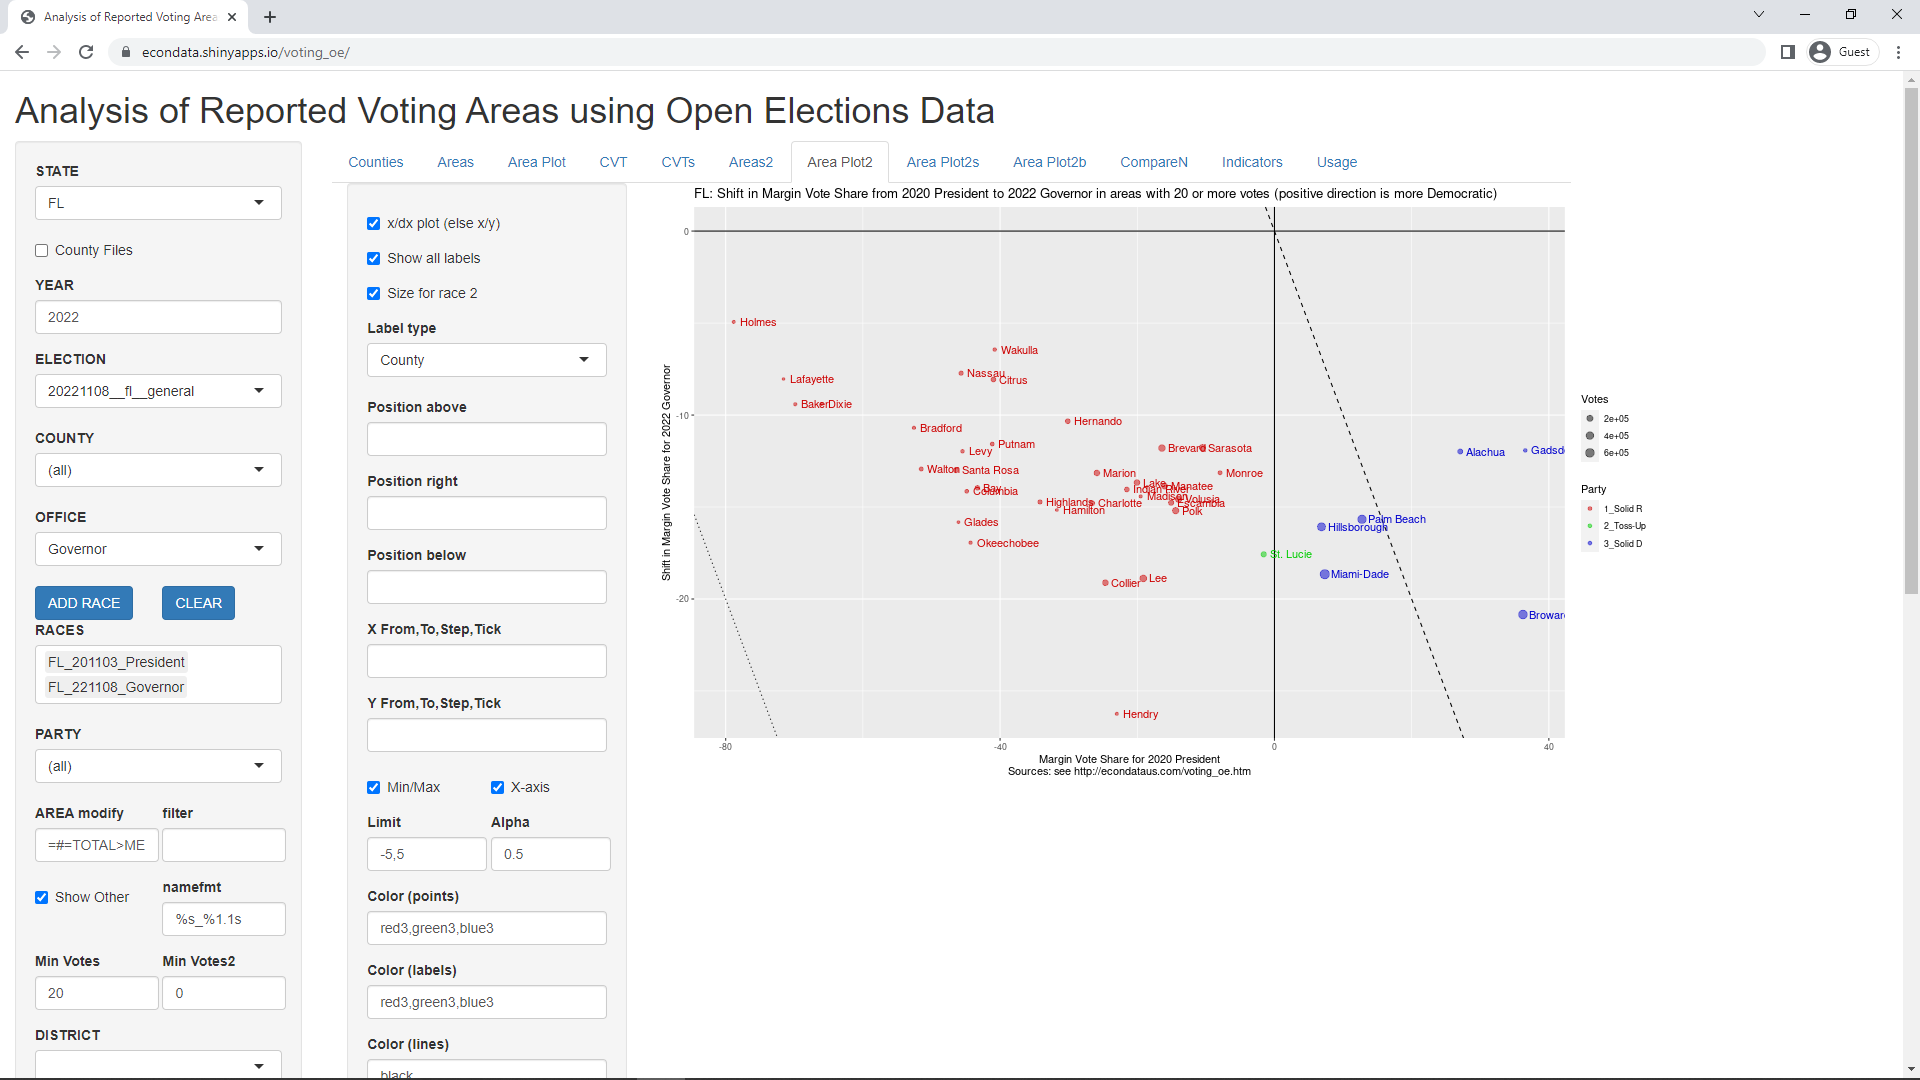
For the second race, set YEAR to 2022, ensure ELECTION is set to "20221108__fl__general", set OFFICE to Governor, and click the "ADD RACE" button. Clicking on the "Area Plot2" tab will now display the following page:
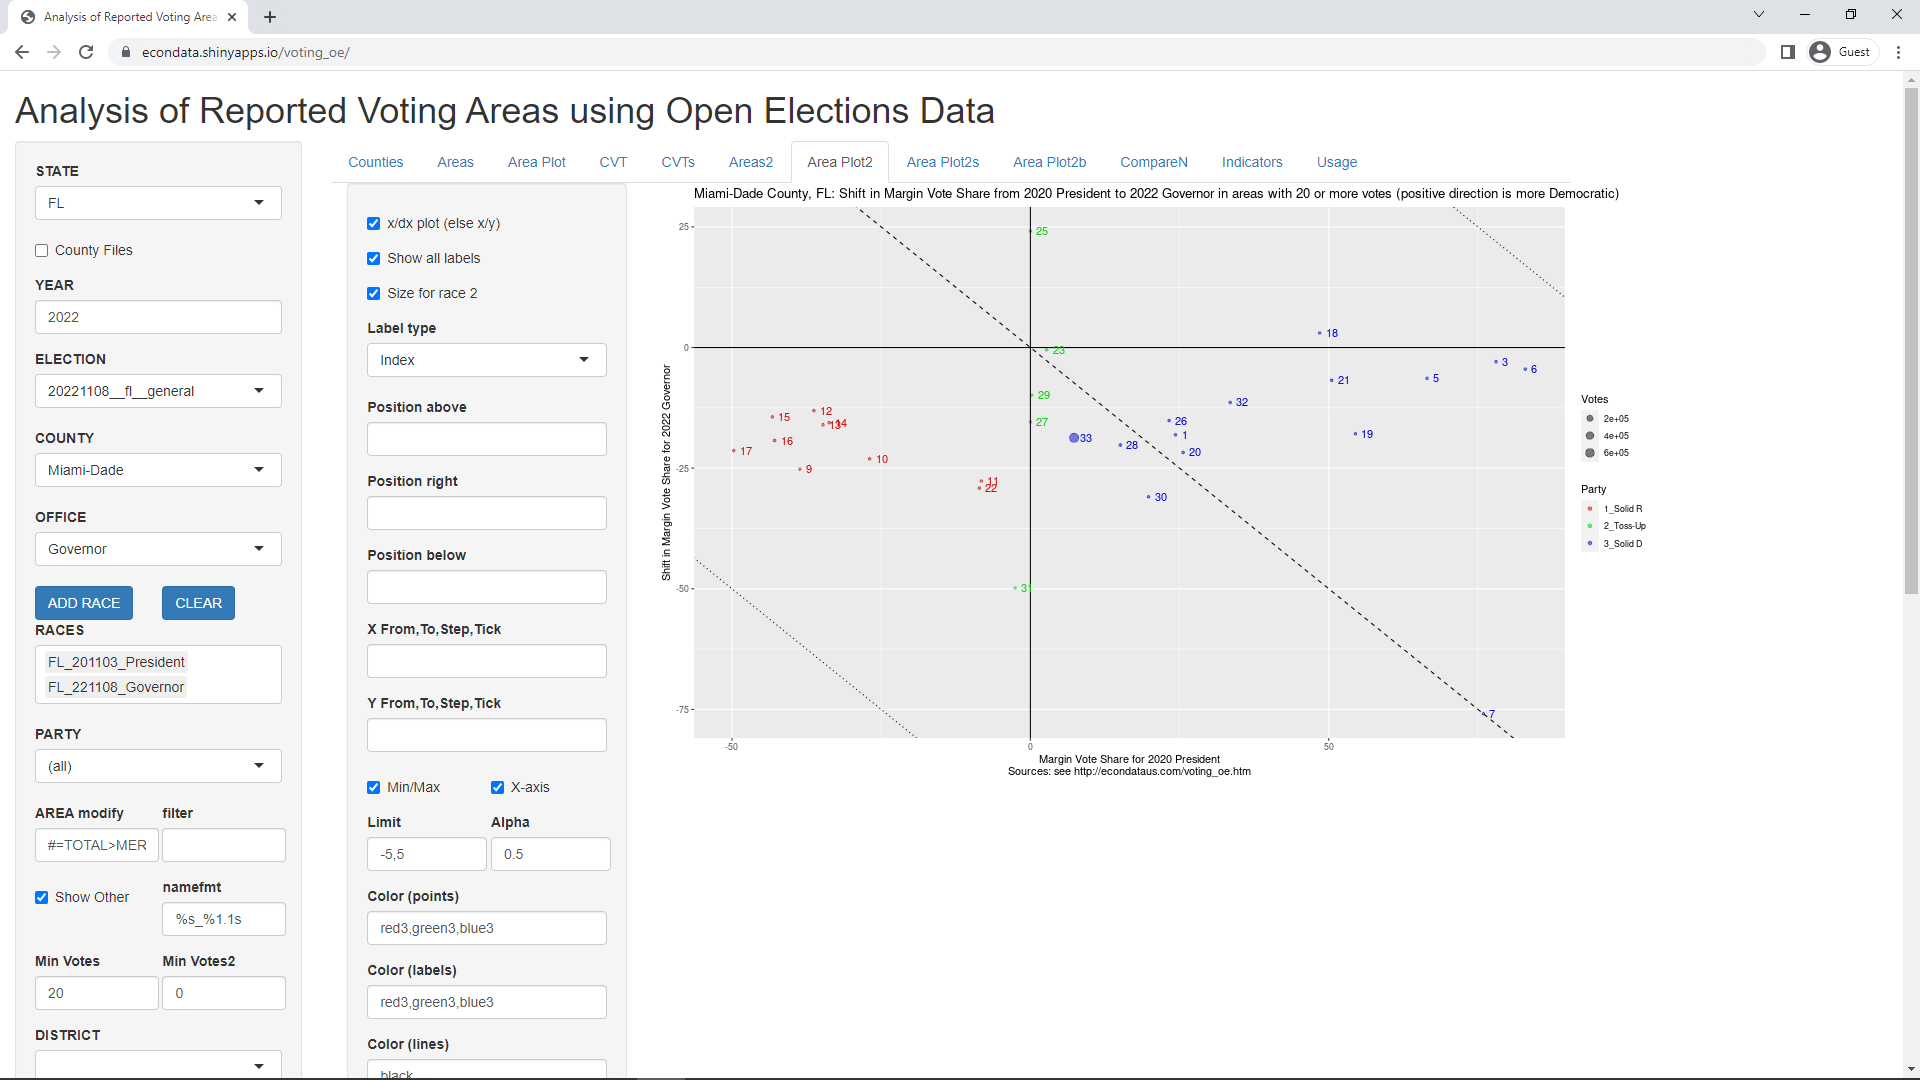
As can be seen, relatively few precincts are visible on the plot. Note that precinct 33 is much larger than the others. Changing "Label type" from Index to Area will change its label to Other. Clicking on the Areas2 tab will now display a page with 33 precincts with this Other precinct at the bottom showing 701,177 total votes in the Governor's race. Now, unchecking the "Show Other" checkbox on the leftmost sidepanel will display the following page:
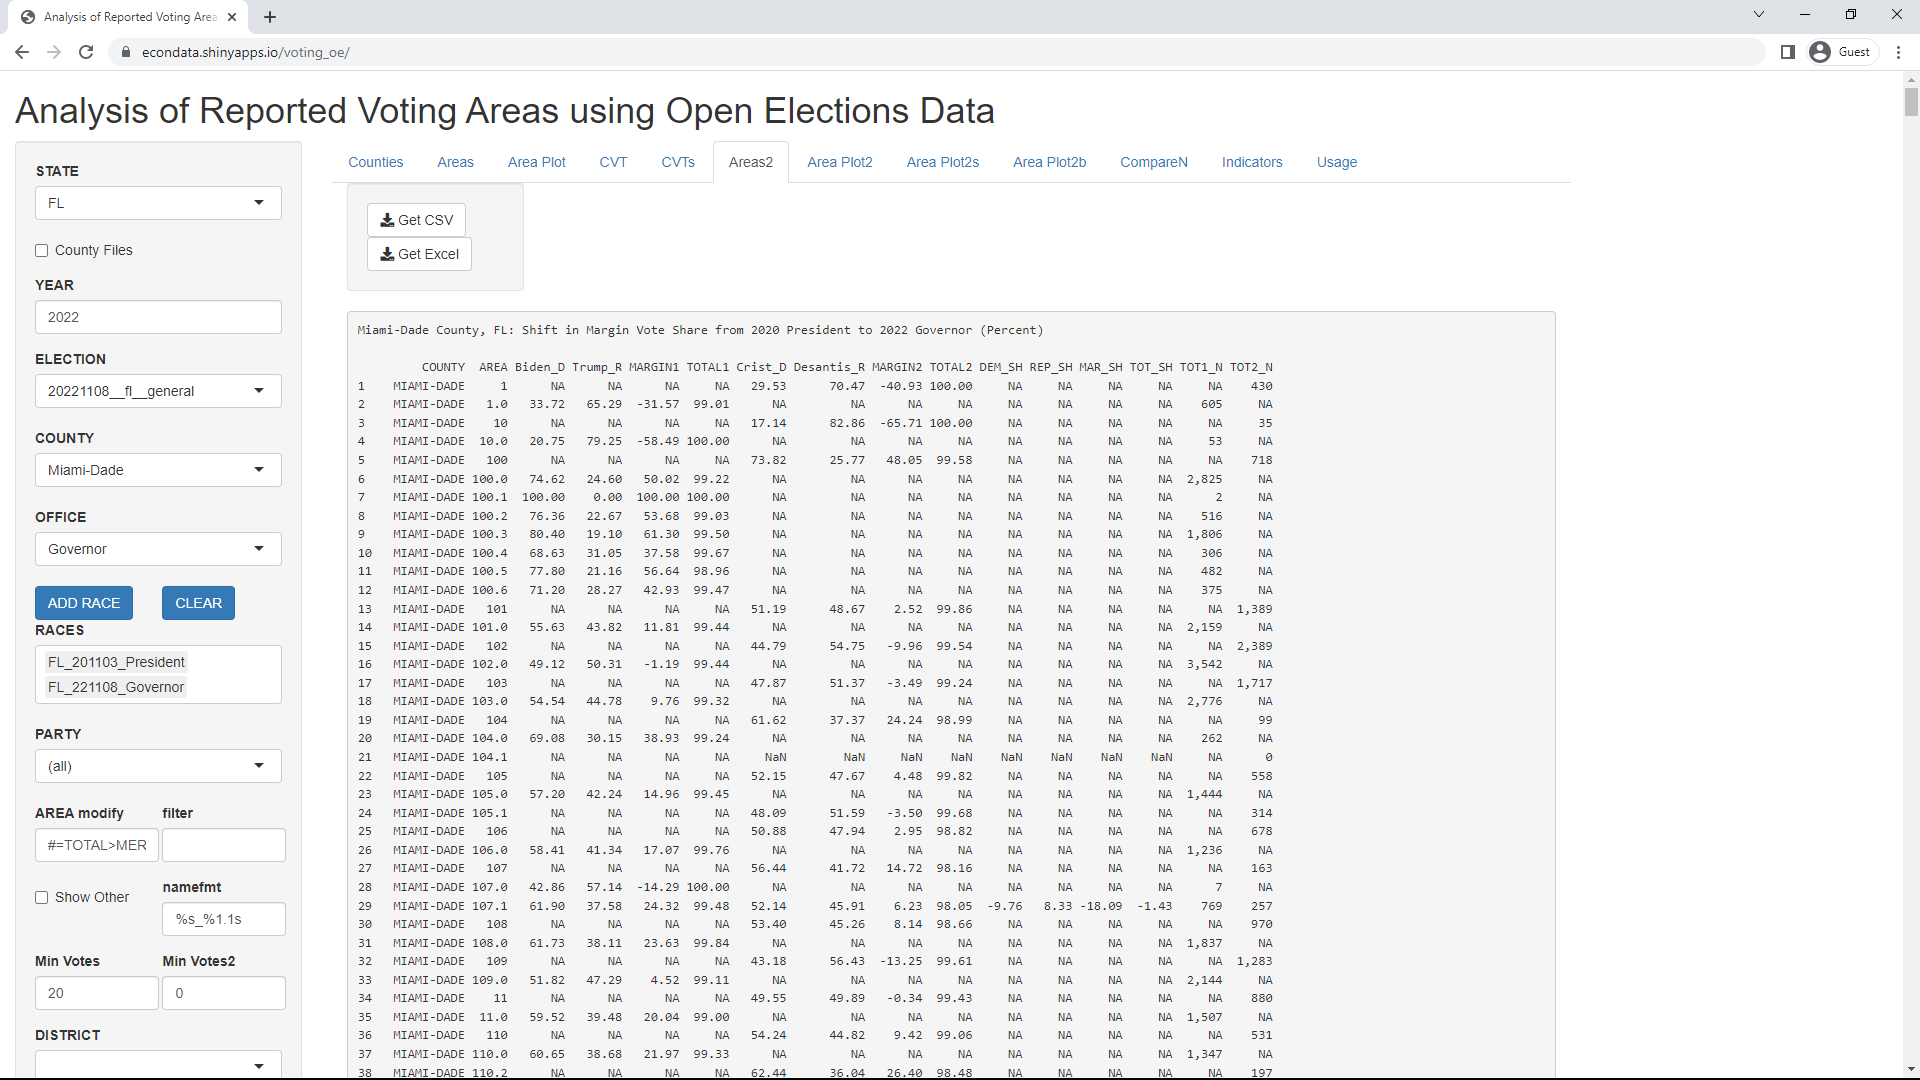
When the "Show Other" checkbox is checked, all AREA names that do not match between the two races will be placed in an AREA labeled "Other". When it is unchecked, all unmatched AREA names will be displayed with NA appearing in the 5 columns for that race (including TOT1_N or TOT2_N) and the 4 shift columns (DEM_SH through TOT_SH). As can be seen, the first race (with values for Biden_D through TOTAL1) has AREA names ending with 1 decimal place whereas those for the second race (with values for Crist_D through TOTAL2) have AREA names with no decimals. The user can cause all decimals, including the point, to be removed by placing a '>' character at the start of the "AREA modify" textbox, just before the '#'. This triggers a built-in operation for all Florida counties to removed decimals and leading zeroes. This will cause the AREAs to be merged according to the values of their whole numbers, resulting in 743 AREAs and no "Other" AREA. Clicking on the "Area Plot2" tab will now display the following page:
As can be seen, the margin vote share for DeSantis in 2022 was nearly 20 percent more than the margin vote share for Trump in 2020 in majority Republican and Toss-Up precincts. This difference in margin vote share decreased from nearly 20 percent for Democrat-leaning precincts to just over 5 percent for very solid Democrat precincts. Of course, these numbers are on average and there are visible outliers.
Changing COUNTY to (all) displays the following page:
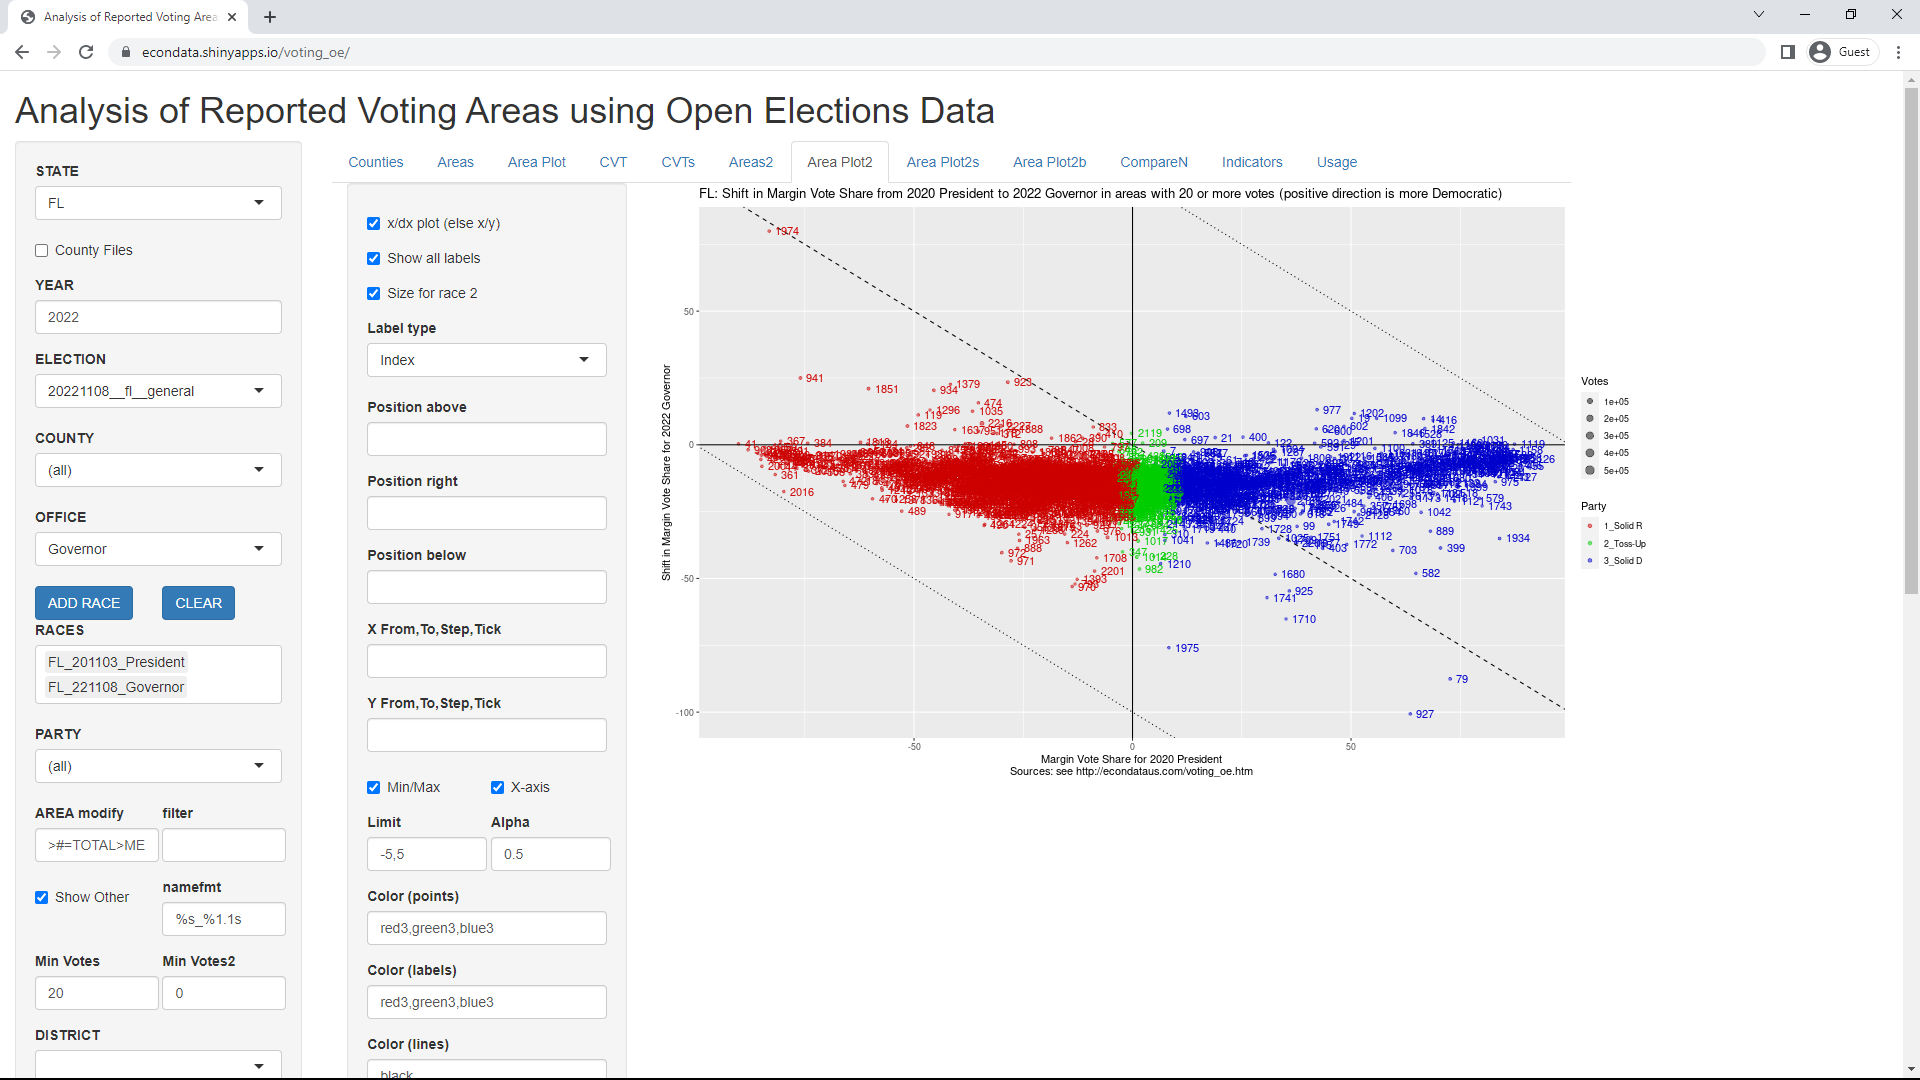
This shows the shift in the margin vote share for all Florida counties for which the OpenElections data has precinct data and for which the precinct names matched following the data cleaning done via adding the '>' character to "AREAS modify". The County tab shows 66 of the 67 counties in Florida but this appears to be based on the first race, the 2020 President race. Temporarily making the 2022 Governor race the first race in the RACES box causes this to drop to 43 counties.
Speaking of counties, it's possible to look at the shift by county by changing the '>' character at the beginning of the "AREA modify" textbox to '='. This will combine all of the precincts in every county and display a page with 43 indices. Changing the "Label type" select box to County will display the following page:
As can be seen, Miami-Dade, Lee, and Collier shifted Republican by about 19 percent, Broward by about 21 percent, and Hendry by about 26 percent. The more precise percents can be seen under the "Areas2" tab to have been -18.65, -18.88, -19.12, -20.85, and -26.24 percent, respectively.
Setting COUNTY to "(all)" and clicking the Counties tab displays the following page:
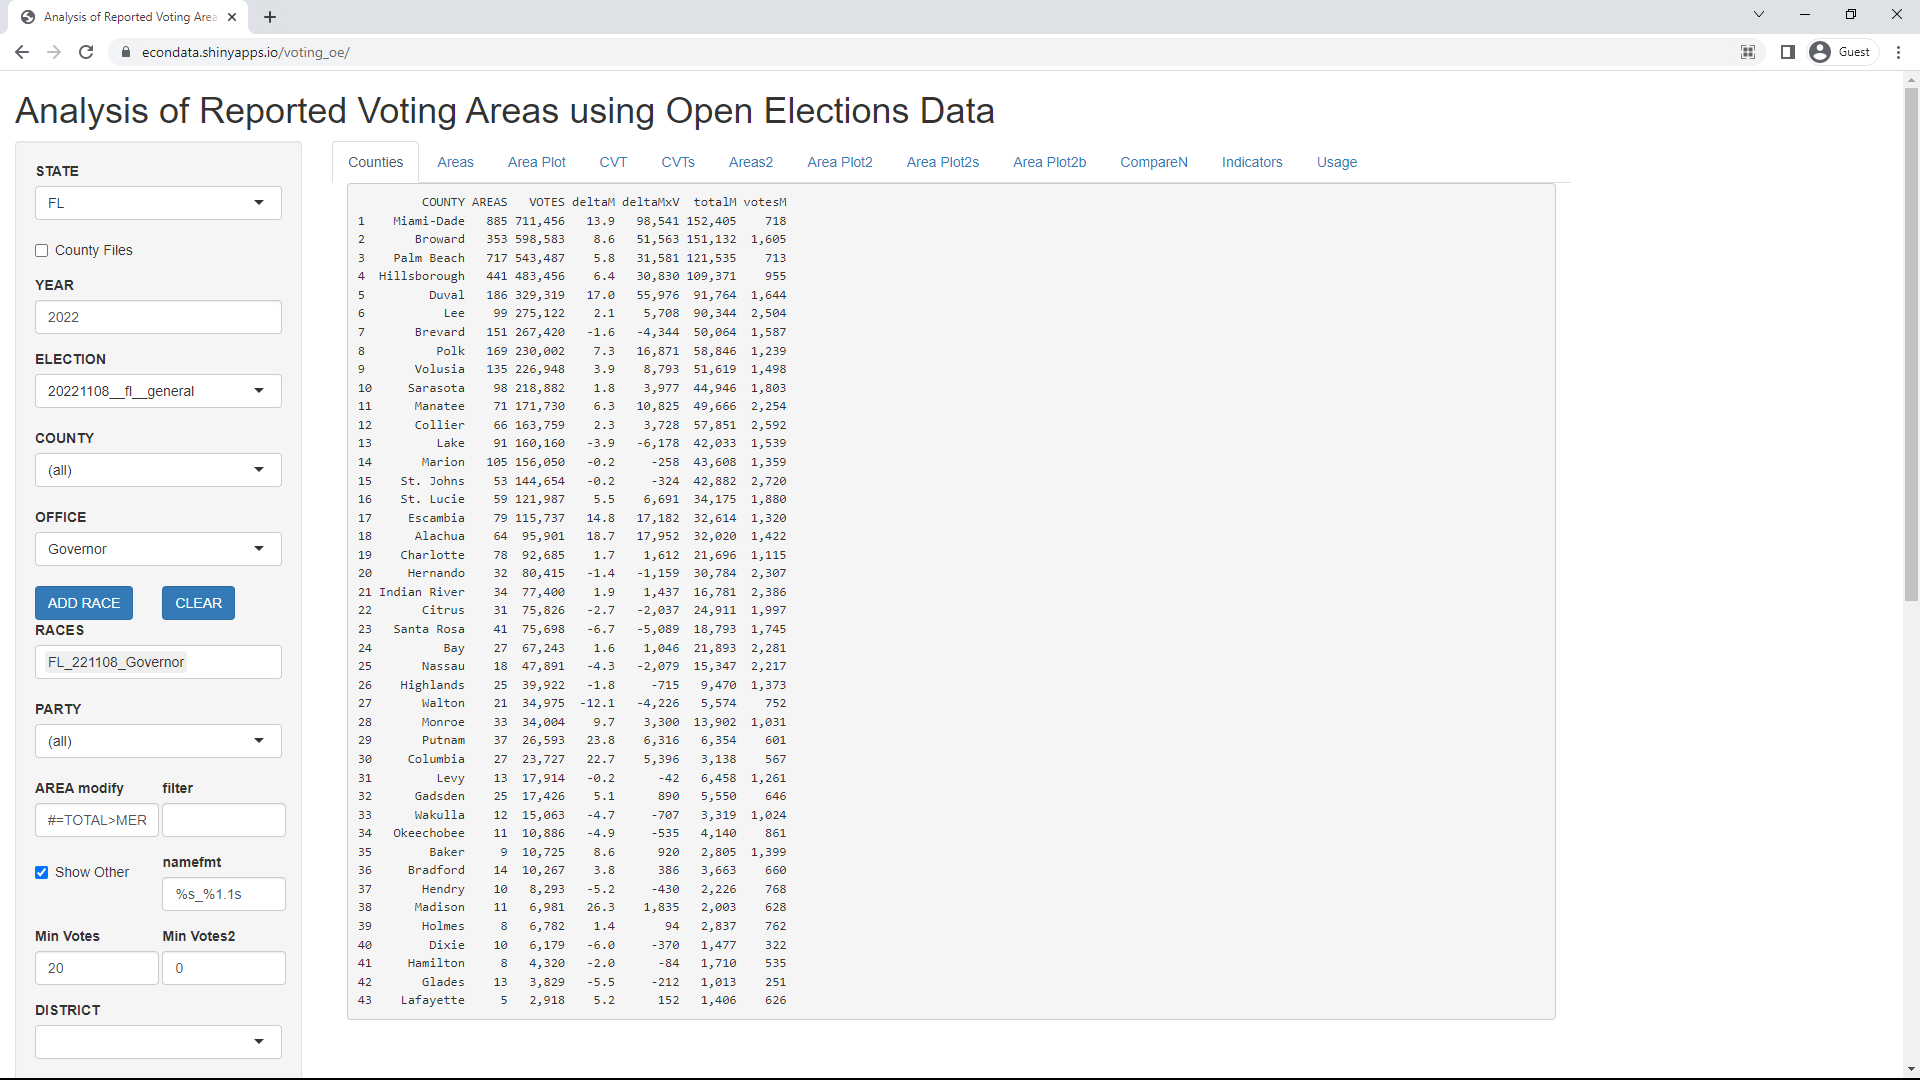
As previously mentioned, this will only include 43 counties if the first race in the RACES box is for 2022. The table gives the number of AREAS or precincts and the vote count for each county. The last four columns are measurements related to the CVT (Cumulative Vote Tally) for the 2022 Governor race. These measurement are described at this link.
Clicking on the Map tab now displays the following page:
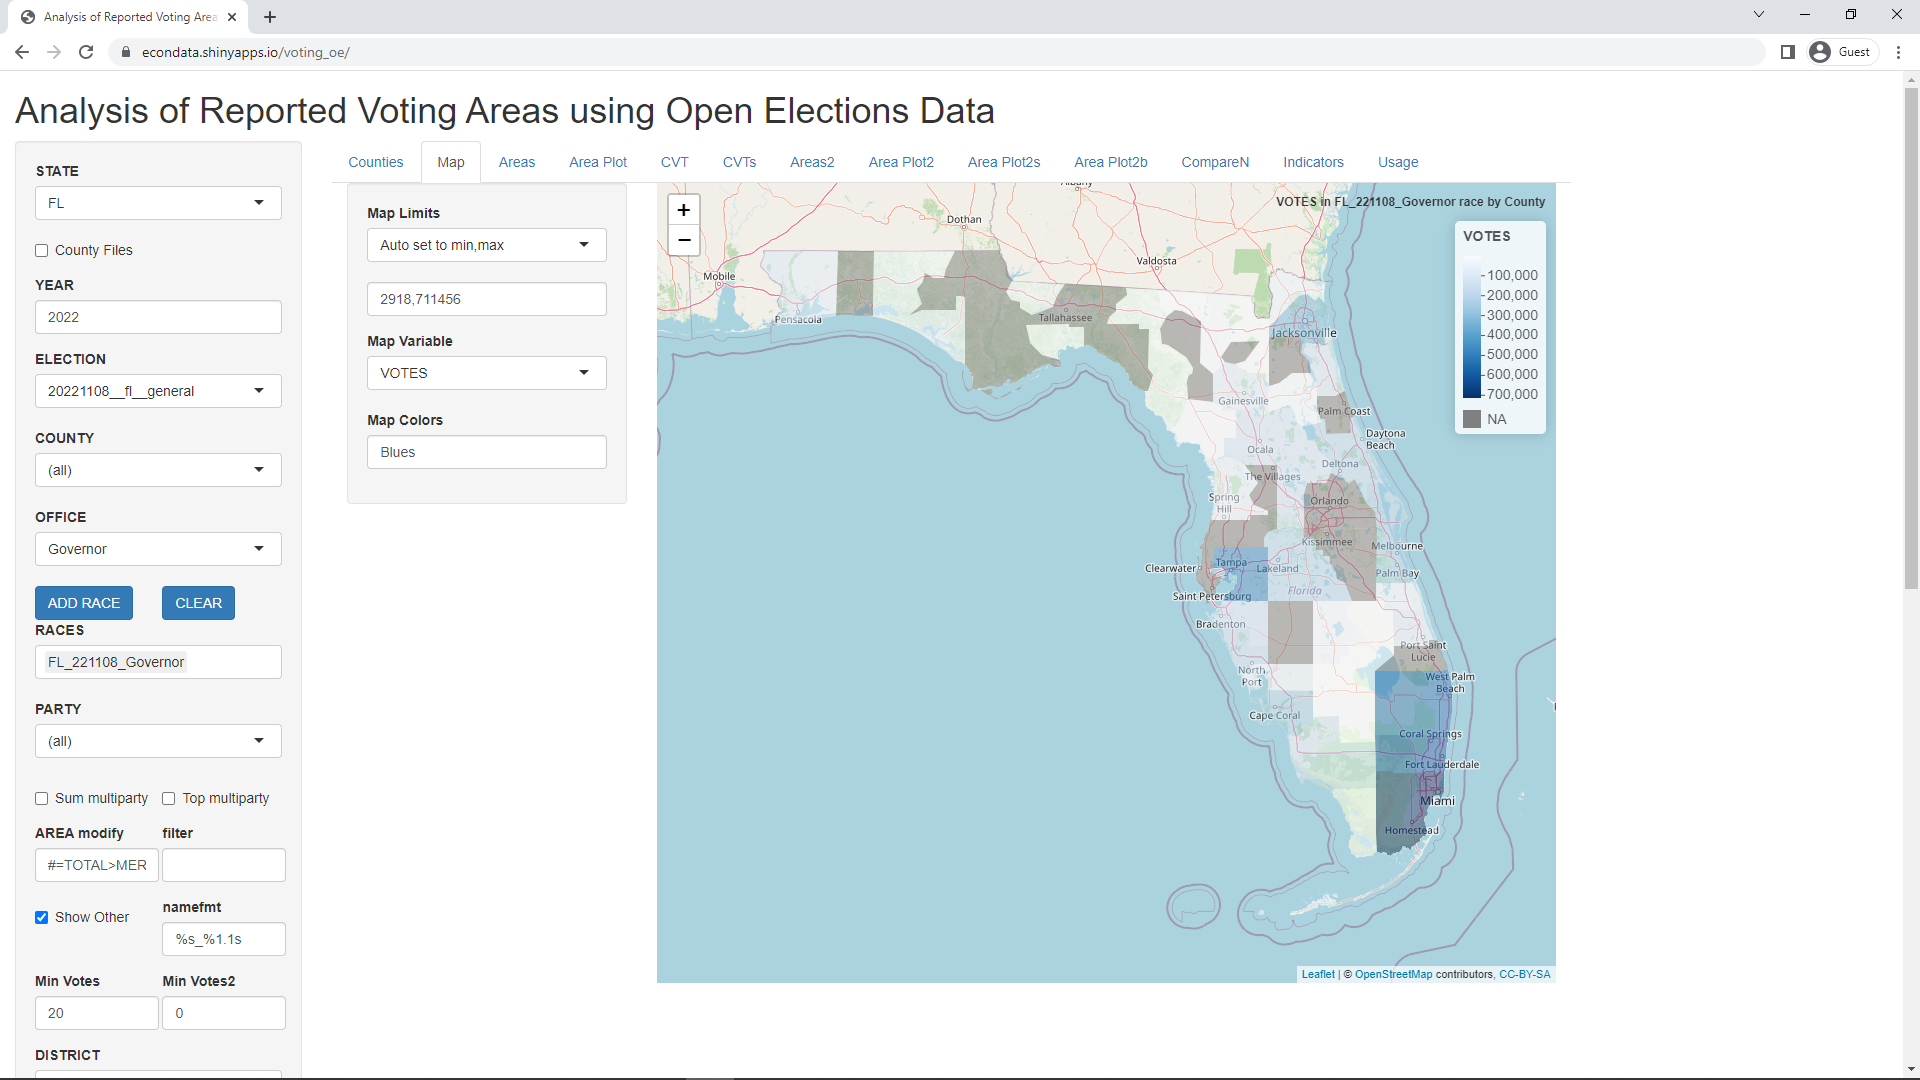
This displays a choropleth map of Florida with the counties colored according to the Map Variable selected. The Map Variable can be set to any of the columns displayed in the Counties tab. The gray counties are those counties for which there is currently no data in OpenElections. For 2022, only 43 of the 67 Florida counties currently have data.
To look at the same data for 2020, click the CLEAR button, set YEAR to 2020, ensure that ELECTION is set to 20201103__fl__general and COUNTY is set to (all), set OFFICE to President, and click the ADD RACE button. This will display the following page:
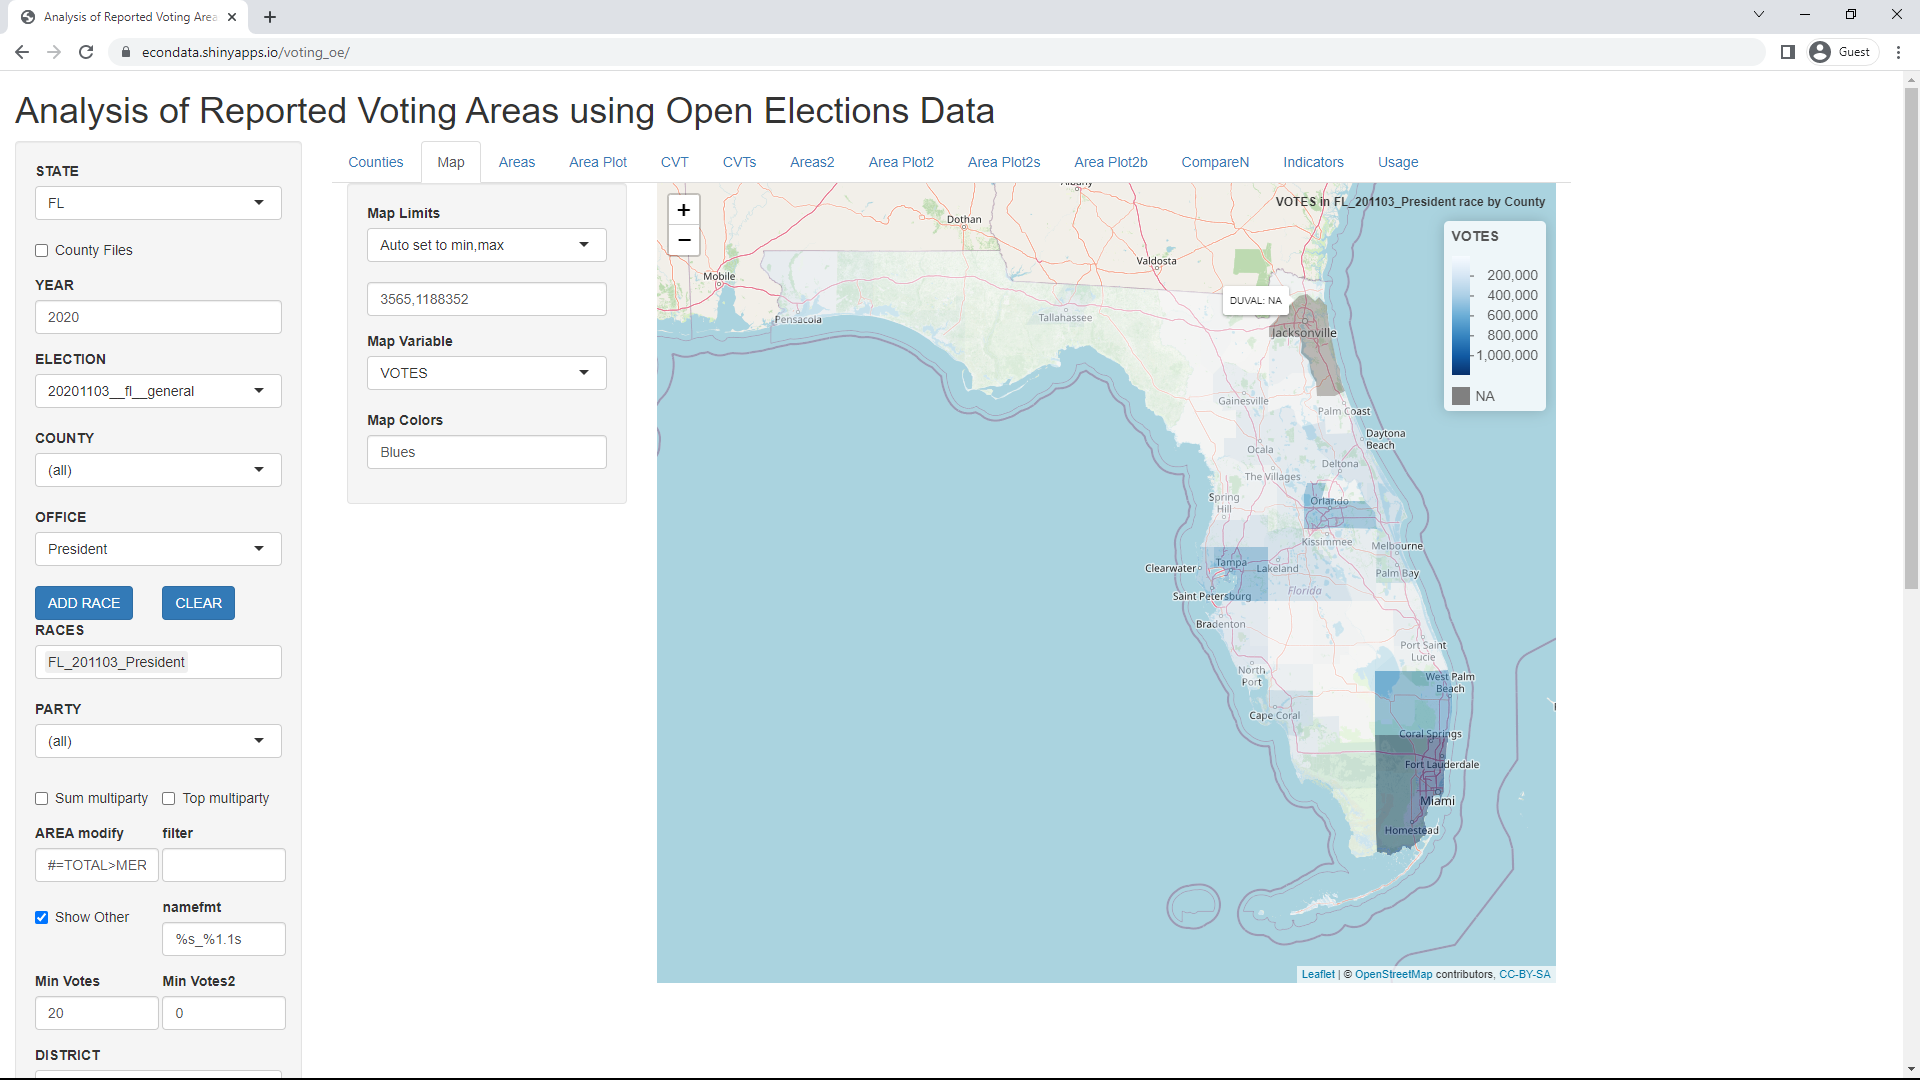
Hovering the mouse over the upper part of the gray area shows that Duval County is not currently in the 2020 data in OpenElections. However, moving the mouse to the lower part of the gray area suggests that St. Johns County is also not present. But looking at the data on the County tab does show a "St. John's" county. Hence, this appears to be due to a mismatch between the name "St. Johns" in the map package and the name "St. John's" in the OpenElections data. This will be fixed in the code but will remain mentioned here since this mismatch may occur in other counties in other states.